Review
. 2023 Aug 19:42:57-72.
doi: 10.1016/j.jot.2023.07.005. eCollection 2023 Sep.

Magnetic resonance imaging techniques for the quantitative analysis of skeletal muscle: State of the art

Affiliations
Review

Magnetic resonance imaging techniques for the quantitative analysis of skeletal muscle: State of the art

Klaus Engelke et al. J Orthop Translat. .

Abstract

Background: Magnetic resonance imaging (MRI) is the dominant 3D imaging modality to quantify muscle properties in skeletal muscle disorders, in inherited and acquired muscle diseases, and in sarcopenia, in cachexia and frailty.

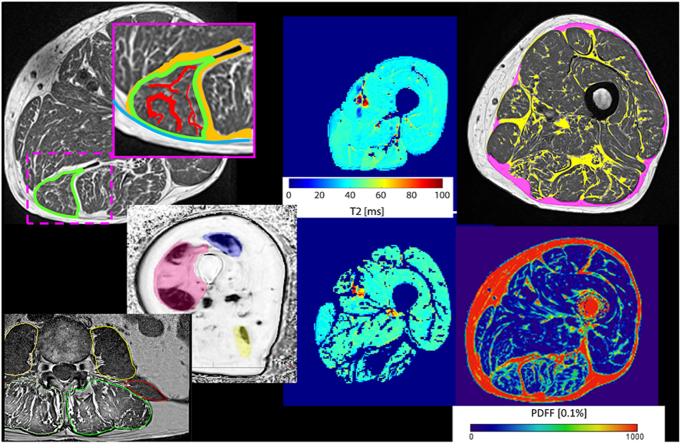
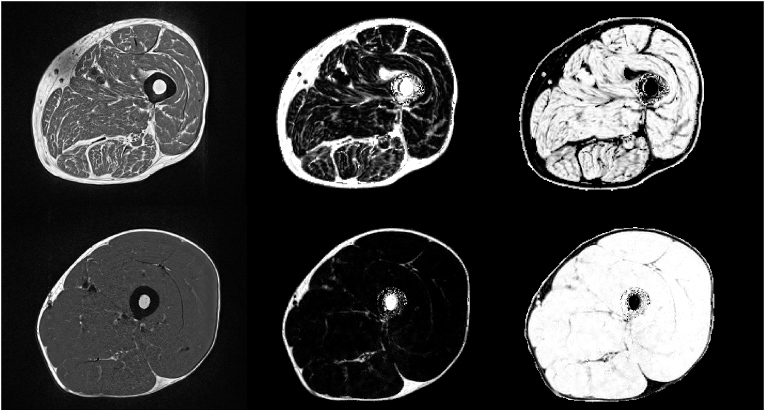
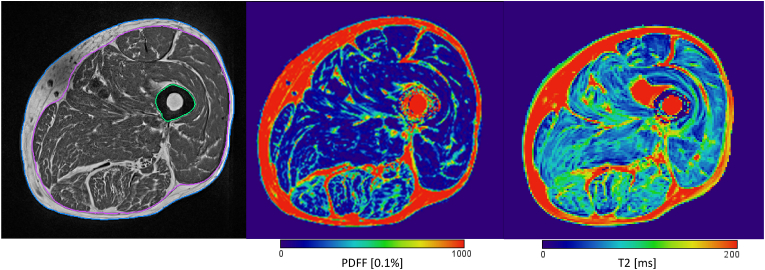
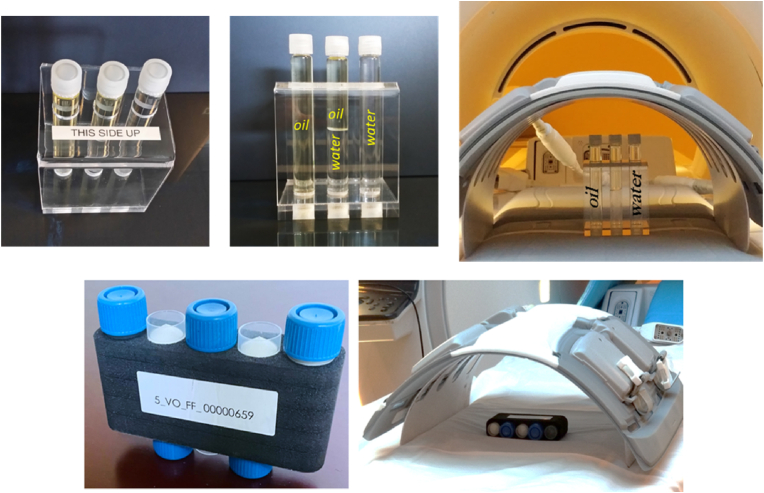
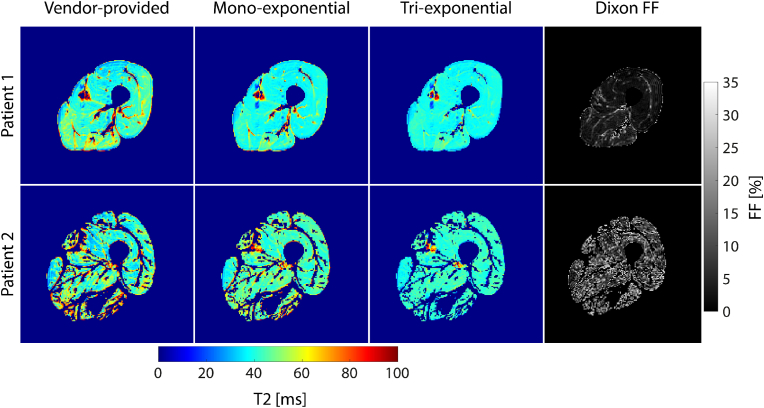
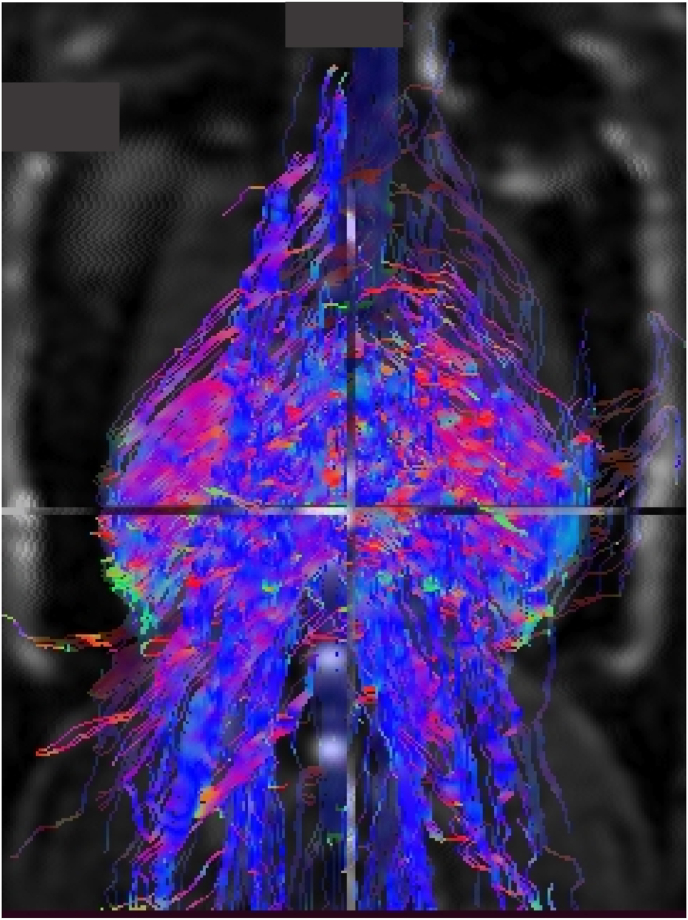
Methods: This review covers T1 weighted and Dixon sequences, introduces T2 mapping, diffusion tensor imaging (DTI) and non-proton MRI. Technical concepts, strengths, limitations and translational aspects of these techniques are discussed in detail. Examples of clinical applications are outlined. For comparison 31P-and 13C-MR Spectroscopy are also addressed.

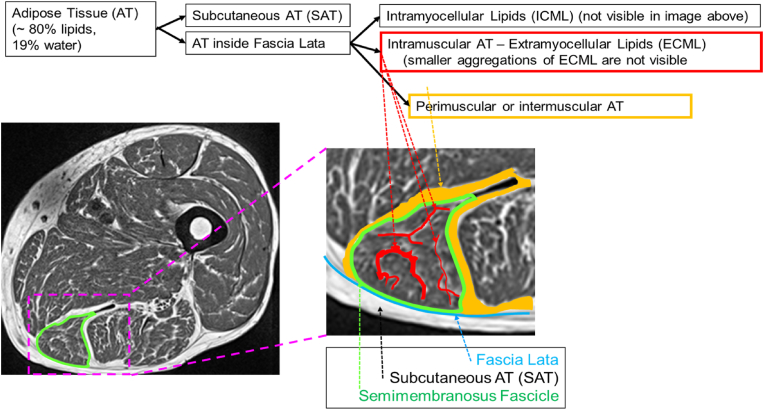
Results: MRI technology provides a rich toolset to assess muscle deterioration. In addition to classical measures such as muscle atrophy using T1 weighted imaging and fat infiltration using Dixon sequences, parameters characterizing inflammation from T2 maps, tissue sodium using non-proton MRI techniques or concentration or fiber architecture using diffusion tensor imaging may be useful for an even earlier diagnosis of the impairment of muscle quality.

Conclusion: Quantitative MRI provides new options for muscle research and clinical applications. Current limitations that also impair its more widespread use in clinical trials are lack of standardization, ambiguity of image segmentation and analysis approaches, a multitude of outcome parameters without a clear strategy which ones to use and the lack of normal data.

Keywords: Clinical trials; Diffusion tensor imaging; Dixon; Muscle MRI; Quantitative analysis; T2 mapping.


Conflict of interest statement

The authors declare that the research was conducted in the absence of any commercial or financial relationships that could be construed as a potential conflict of interest. KE is a part time and MABE a full time employee of Clario, Inc.

Figures

Image 1
Graphical abstract
Fig. 1
Fig. 1
Muscle fat infiltration shown schematically in the semimembranosus of the mid-thigh. The T1w image provides good contrast and shows the individual muscles separated by perimuscular adipose tissue (orange) and intramuscular adipose tissue (red). However, the amount of visible intramuscular adipose tissue depends on the spatial resolution and smaller aggregations of intramuscular adipose tissue either cause partial volume artifacts or cannot be detected in T1w images at all. The muscle tissue (dark) contains contractile tissue, and lipids, either as EMCLs and IMCLs that contribute to the fat faction signal in Dixon images. (For interpretation of the references to color in this figure legend, the reader is referred to the Web version of this article.)
Fig. 2
Fig. 2
T1w images of elderly subject with sarcopenia (top) and of young healthy subject (bottom). A: T1 weighted sequence, B: Dixon fat fraction sequence and C: Dixon water fraction sequence. The T1w image in A is affected by bias (upper left corner of the image in the upper row), Dixon fat and water images are also affected but this effect cancels out the PDFF and PDFW images (upper row B and C).
Fig. 3
Fig. 3
Left: T1 weighted sequence after bias correction, with segmented fascia lata (pink); center Dixon fat fraction map after 3D registration to T1w sequence and registration of fascia lata. Right: T2 map after registration to Dixon sequence. One axial slice of 3D dataset shown each. Bias correction did not remove all artifacts in the T1w image.
Fig. 4
Fig. 4
Dixon fat fraction map without (top) and with (bottom) segmentation of IMAT and muscle tissue. Left: high resolution (in plane pixel size x slice thickness - 0.98 ​× ​0.98 ​× ​3.0 ​mm3); center: standard resolution (1.56 ​× ​1.56 ​× ​3.0 ​mm3); right: same resolution as center but muscle tissue peeled by one voxel. The figure shows one slice out of 29 of the acquired 3D dataset. Results of the complete dataset for muscle tissue (MT) volume and proton density fat fraction (PDFF) depend on spatial resolution and on segmentation technique. Left: MT vol ​= ​985 ​cm³, PDFF ​= ​8.7%; center: MT vol ​= ​923 ​cm³, PDFF ​= ​13.2%; right: MT vol ​= ​500 ​cm³, PDFF ​= ​10.2%.
Fig. 5
Fig. 5
In elderly subjects the fascia lata is not always in direct contact with muscle but partly separated by layers of adipose tissue (pink), which are part of intermuscular adipose tissue (IMAT). A tight muscle envelope excluding most or all of the pink ROI would significantly decrease the volume of IMAT (yellow). In younger subjects Fig. 2a there is no or very little adipose tissue located between muscle and fascia. (For interpretation of the references to color in this figure legend, the reader is referred to the Web version of this article.)
Fig. 6
Fig. 6
Left: Manual contouring of individual muscles (here: vastus medialis, rectus femoris and biceps femoris) in T1 weighted sequence; center Dixon FF map after 3D registration to T1w sequence and registration of muscle contours. Right: Threshold based separation of muscle tissue and adipose tissue compartments of each segmented muscle.
Fig. 7
Fig. 7
Segmentation and analysis of paraspinal muscles of the lumbar spine. Left. T1w images with segmented psoas, erector spinae and quadratus lumborum muscles; right: Dixon FF map 3D registered to T1w sequence and registered segmentation maps.
Fig. 8
Fig. 8
Phantoms for calibration of Dixon sequences. Top: Clario FF phantom with pure water and fat inserts; bottom: Calimetrix PDFF phantom with 5 inserts containing 0, 10, 20, 30, and 40% fat fraction.
Fig. A1
Fig. A1
T2 maps and corresponding Dixon FF maps of a subject with lower and a subject with higher muscle tissue FF (patient 1, mean FF ​= ​4.9%; patient 2, mean FF ​= ​13.1%). In subject 2 with higher FF, T2 values are elevated, particularly in the vendor-provided T2 map, but also in the mono-exponentially fitted T2 map. In contrast, T2 values were similar for both patients in the tri-exponential T2 map. Moreover, within the thigh muscle of subject 1, a variation could be observed between individual muscles in the product T2 map, which was not present in the custom-fit T2 maps.
Fig. A2
Fig. A2
Illustration of paraspinal muscle fibers of a rat using tractography.

Similar articles

Cited by

References

    1. Mercuri E., Pichiecchio A., Allsop J., Messina S., Pane M., Muntoni F. Muscle MRI in inherited neuromuscular disorders: past, present, and future. J Magn Reson Imag. 2007 Feb;25(2):433–440. - PubMed
    1. Paoletti M., Pichiecchio A., Cotti Piccinelli S., Tasca G., Berardinelli A.L., Padovani A., et al. Advances in quantitative imaging of genetic and acquired myopathies: clinical applications and perspectives. Front Neurol. 2019;10:78. - PMC - PubMed
    1. Smitaman E., Flores D.V., Mejia Gomez C., Pathria M.N. MR imaging of atraumatic muscle disorders. Radiographics. 2018 Mar-Apr;38(2):500–522. - PubMed
    1. Ten Dam L., van der Kooi A.J., Verhamme C., Wattjes M.P., de Visser M. Muscle imaging in inherited and acquired muscle diseases. Eur J Neurol. 2016 Apr;23(4):688–703. - PubMed
    1. Weber A., editor. Magnetic resonance imaging of skeletal musculature. Springer; Heidelberg: 2014.

LinkOut - more resources