

Inequality in the Distribution of Air Pollution Attributable Mortality Within Canadian Cities
- PMID: 37654974
- PMCID: PMC10465848
- DOI: 10.1029/2023GH000816
Inequality in the Distribution of Air Pollution Attributable Mortality Within Canadian Cities
Abstract
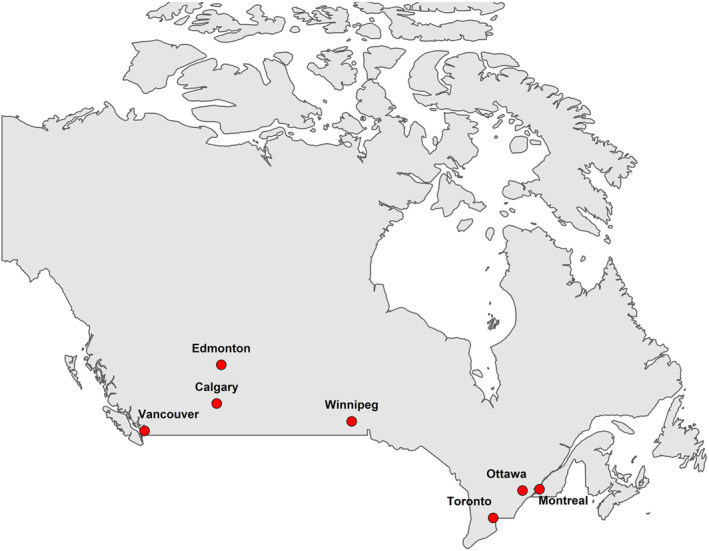
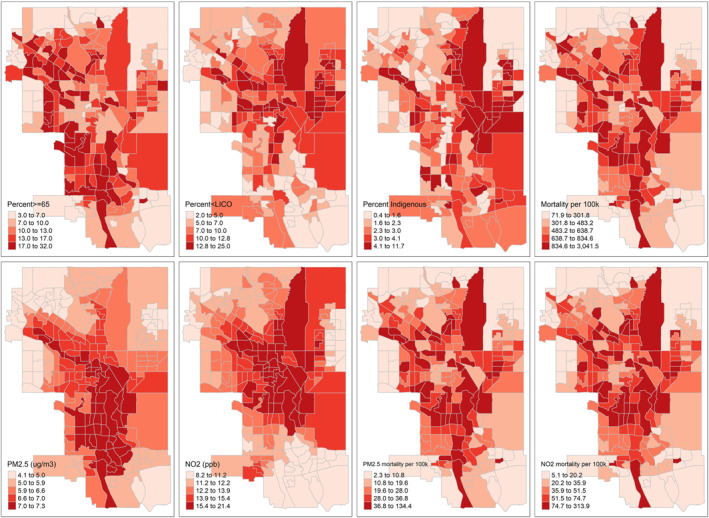
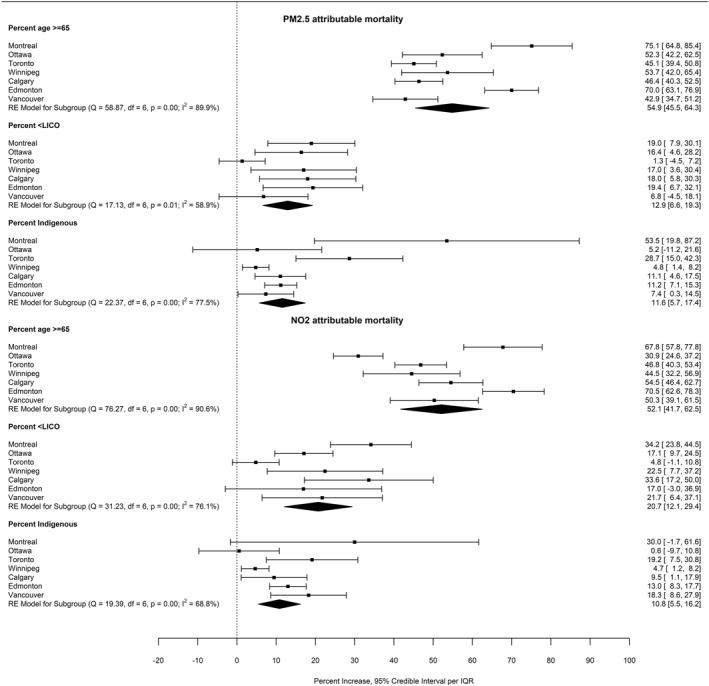
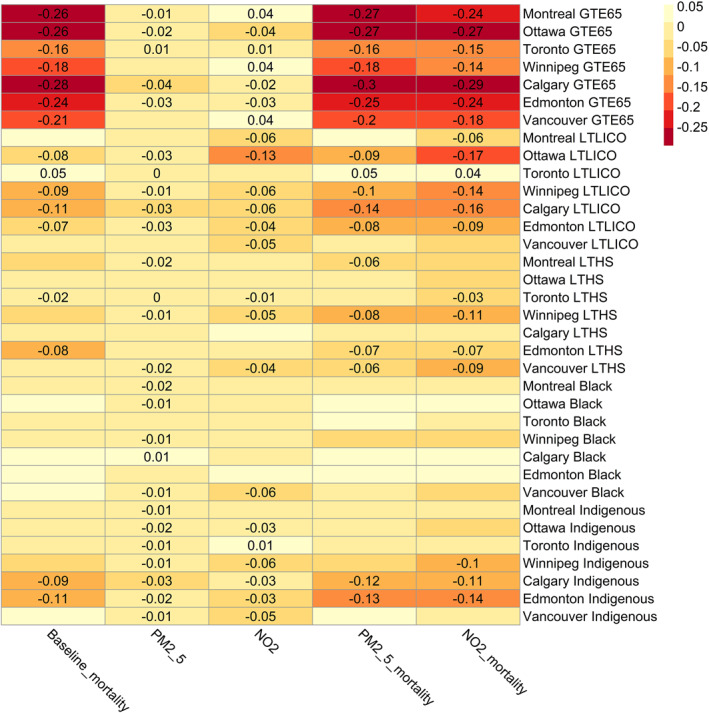
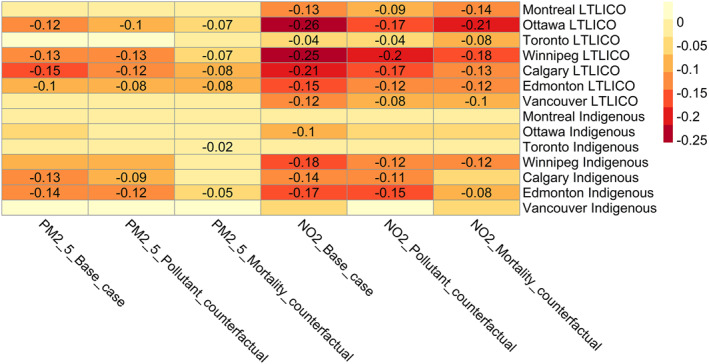
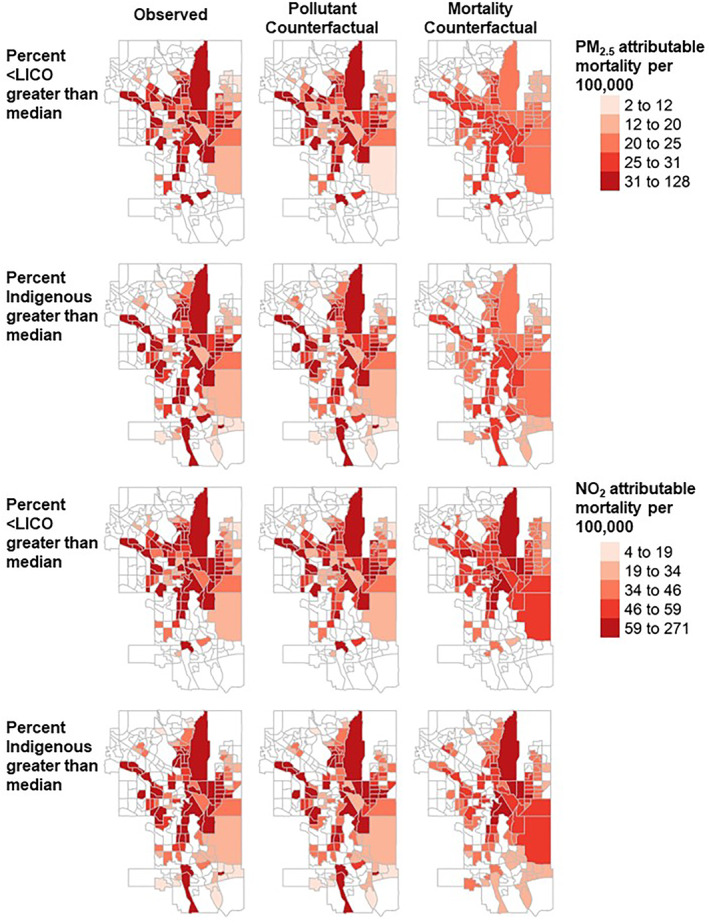
Recent studies have identified inequality in the distribution of air pollution attributable health impacts, but to our knowledge this has not been examined in Canadian cities. We evaluated the extent and sources of inequality in air pollution attributable mortality at the census tract (CT) level in seven of Canada's largest cities. We first regressed fine particulate matter (PM2.5) and nitrogen dioxide (NO2) attributable mortality against the neighborhood (CT) level prevalence of age 65 and older, low income, low educational attainment, and identification as an Indigenous (First Nations, Métis, Inuit) or Black person, accounting for spatial autocorrelation. We next examined the distribution of baseline mortality rates, PM2.5 and NO2 concentrations, and attributable mortality by neighborhood (CT) level prevalence of these characteristics, calculating the concentration index, Atkinson index, and Gini coefficient. Finally, we conducted a counterfactual analysis of the impact of reducing baseline mortality rates and air pollution concentrations on inequality in air pollution attributable mortality. Regression results indicated that CTs with a higher prevalence of low income and Indigenous identity had significantly higher air pollution attributable mortality. Concentration index, Atkinson index, and Gini coefficient values revealed different degrees of inequality among the cities. Counterfactual analysis indicated that inequality in air pollution attributable mortality tended to be driven more by baseline mortality inequalities than exposure inequalities. Reducing inequality in air pollution attributable mortality requires reducing disparities in both baseline mortality and air pollution exposure.
Keywords: air pollution; environmental injustice; environmental racism.
© 2023 His Majesty the King in Right of Canada and The Authors. Reproduced with the permission of the Minister of Health Canada.
Conflict of interest statement
The authors declare no conflicts of interest relevant to this study.
Figures
References
-
- Bivand, R. , Kitt, T. , & Rowlington, B. (2019). R package “rgdal”: Bindings for the ‘geospatial’ data abstraction library. (version 1.4‐8). Retrieved from https://CRAN.R-project.org/package=rgdal
-
- Bougie, E. (2021). Acute‐care hospitalizations among First Nations people, Inuit and Métis: Results from the 2006 and 2011 Canadian Census Health and Environment Cohorts. Health Reports, 32(82), 18. - PubMed
-
- Buzzelli, M. , Jerrett, M. , Burnett, R. , & Finklestein, N. (2003). Spatiotemporal perspectives on air pollution and environmental justice in Hamilton, Canada, 1985‐1996. Annals of the Association of American Geographers, 93(3), 557–573. 10.1111/1467-8306.9303003 - DOI
-
- CANUE—The Canadian Urban Environmental Health Research Consortium . (2018). NO2‐Supplementary‐Methods‐Documentation‐2013‐2016.pdf (pp. 1–2). Retrieved from https://canue.ca/wp-content/uploads/2020/05/NO2-Supplementary-Methods-Do...
-
- CANUE—The Canadian Urban Environmental Health Research Consortium . (2023). Data portal. Retrieved from https://www.canuedata.ca/metadata.php
LinkOut - more resources
Full Text Sources
Research Materials