Melatonin downregulates the increased hepatic alpha-fetoprotein expression and restores pancreatic beta cells in a streptozotocin-induced diabetic rat model: a clinical, biochemical, immunohistochemical, and descriptive histopathological study
- PMID: 37655263
- PMCID: PMC10467430
- DOI: 10.3389/fvets.2023.1214533
Melatonin downregulates the increased hepatic alpha-fetoprotein expression and restores pancreatic beta cells in a streptozotocin-induced diabetic rat model: a clinical, biochemical, immunohistochemical, and descriptive histopathological study
Abstract
Background: Diabetes mellitus (DM) is a chronic metabolic disorder. Hepatopathy is one of the serious effects of DM Melatonin (MT) is a potent endogenous antioxidant that can control insulin output. However, little information is available about the potential association between melatonin and hepatic alpha-fetoprotein expression in diabetes.
Objective: This study was conducted to assess the influence of MT on diabetes-related hepatic injuries and to determine how β-cells of the pancreas in diabetic rats respond to MT administration.
Materials and methods: Forty rats were assigned to four groups at random (ten animals per group). Group I served as a normal control group. Group II was induced with DM, and a single dose of freshly prepared streptozotocin (45 mg/kg body weight) was intraperitoneally injected. In Group III, rats received 10 mg/kg/day of intraperitoneal melatonin (IP MT) intraperitoneally over a period of 4 weeks. In Group IV (DM + MT), following the induction of diabetes, rats received MT (the same as in Group III). Fasting blood sugar, glycosylated hemoglobin (HbA1c), and serum insulin levels were assessed at the end of the experimental period. Serum liver function tests were performed. The pancreas and liver were examined histopathologically and immunohistochemically for insulin and alpha-fetoprotein (AFP) antibodies, respectively.
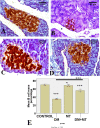
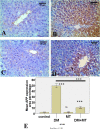
Results: MT was found to significantly modulate the raised blood glucose, HbA1c, and insulin levels induced by diabetes, as well as the decreased alanine aminotransferase (ALT) and aspartate aminotransferase (AST). Furthermore, MT attenuated diabetic degenerative changes in the pancreas and the hepatic histological structure, increased the β-cell percentage area, and decreased AFP expression in the liver tissue. It attenuated diabetes-induced hepatic injury by restoring pancreatic β-cells; its antioxidant effect also reduced hepatocyte injury.
Conclusion: Collectively, the present study confirmed the potential benefits of MT in downregulating the increased hepatic alpha-fetoprotein expression and in restoring pancreatic β-cells in a streptozotocin-induced diabetic rat model, suggesting its promising role in the treatment of diabetes.
Keywords: STZ; alpha-fetoprotein expression; diabetes; histopathology; liver; melatonin.
Copyright © 2023 Alsharif, Hamad, Alblihd, Ali, Mohammed, Theyab, Al-Amer, Almuqati, Almalki, Albarakati, Alzahrani, Albrakati, Albarakati, Abass, Lokman and Elmahallawy.
Conflict of interest statement
The authors declare that the research was conducted in the absence of any commercial or financial relationships that could be construed as a potential conflict of interest.
Figures


Similar articles
-
Melatonin ameliorates the adrenal and pancreatic alterations in streptozotocin-induced diabetic rats: Clinical, biochemical, and descriptive histopathological studies.Front Vet Sci. 2022 Oct 21;9:1016312. doi: 10.3389/fvets.2022.1016312. eCollection 2022. Front Vet Sci. 2022. PMID: 36337190 Free PMC article.
-
The role of the adipose tissue-derived mesenchymal stem cells enriched with melatonin in pancreatic cellular regeneration.Folia Morphol (Warsz). 2022;81(4):931-941. doi: 10.5603/FM.a2021.0093. Epub 2021 Sep 21. Folia Morphol (Warsz). 2022. PMID: 34545556
-
Ameliorative role of Cyanus depressus (M.Bieb.) Soják plant extract against diabetes-associated oxidative-stress-induced liver, kidney, and pancreas damage in rats.J Food Biochem. 2022 Oct;46(10):e14314. doi: 10.1111/jfbc.14314. Epub 2022 Jul 8. J Food Biochem. 2022. PMID: 35802765
-
Launaea acanthodes (Boiss) O. Kuntze mediates hepatic glucose metabolism and ameliorates impaired pancreatic function in streptozotocin-induced diabetic rats.J Ethnopharmacol. 2021 Mar 25;268:113577. doi: 10.1016/j.jep.2020.113577. Epub 2020 Nov 7. J Ethnopharmacol. 2021. PMID: 33171271
-
Melatonin ameliorates serobiochemical alterations and restores the cardio-nephro diabetic vascular and cellular alterations in streptozotocin-induced diabetic rats.Front Vet Sci. 2023 Mar 31;10:1089733. doi: 10.3389/fvets.2023.1089733. eCollection 2023. Front Vet Sci. 2023. PMID: 37065258 Free PMC article.
Cited by
-
Antidiabetic effects of fennel leaf aqueous extract in alloxan-induced diabetic rats.J Pharm Health Care Sci. 2025 Jun 16;11(1):50. doi: 10.1186/s40780-025-00458-x. J Pharm Health Care Sci. 2025. PMID: 40518509 Free PMC article.
-
Practical application of melatonin for pancreas disorders: protective roles against inflammation, malignancy, and dysfunctions.Pharmacol Rep. 2025 Apr;77(2):315-332. doi: 10.1007/s43440-024-00683-5. Epub 2024 Nov 28. Pharmacol Rep. 2025. PMID: 39604705 Review.
-
Melatonin mitigated methotrexate-induced hepatotoxicity through interrelated biological processes.Mol Biol Rep. 2024 Jul 22;51(1):833. doi: 10.1007/s11033-024-09792-z. Mol Biol Rep. 2024. PMID: 39039363
-
Integrated in vitro, in silico, and in vivo approaches to elucidate the antidiabetic mechanisms of Cicer arietinum and Hordeum vulgare extract and secondary metabolites.Sci Rep. 2025 Feb 24;15(1):6620. doi: 10.1038/s41598-025-89642-5. Sci Rep. 2025. PMID: 39994296 Free PMC article.
References
-
- Cruz PL, Moraes-Silva IC, Ribeiro AA, Machi JF, de Melo MDT, dos Santos F, et al. . Nicotinamide attenuates streptozotocin-induced diabetes complications and increases survival rate in rats: role of autonomic nervous system. BMC Endocr Disord. (2021) 21:133. 10.1186/s12902-021-00795-6 - DOI - PMC - PubMed
LinkOut - more resources
Full Text Sources

