. 2023 Dec;12(30):e2301692.
doi: 10.1002/adhm.202301692. Epub 2023 Sep 17.

3D-Printed Osteoinductive Polymeric Scaffolds with Optimized Architecture to Repair a Sheep Metatarsal Critical-Size Bone Defect

Affiliations

3D-Printed Osteoinductive Polymeric Scaffolds with Optimized Architecture to Repair a Sheep Metatarsal Critical-Size Bone Defect

Charlotte Garot et al. Adv Healthc Mater. 2023 Dec.

Abstract

The reconstruction of critical-size bone defects in long bones remains a challenge for clinicians. A new osteoinductive medical device is developed here for long bone repair by combining a 3D-printed architectured cylindrical scaffold made of clinical-grade polylactic acid (PLA) with a polyelectrolyte film coating delivering the osteogenic bone morphogenetic protein 2 (BMP-2). This film-coated scaffold is used to repair a sheep metatarsal 25-mm long critical-size bone defect. In vitro and in vivo biocompatibility of the film-coated PLA material is proved according to ISO standards. Scaffold geometry is found to influence BMP-2 incorporation. Bone regeneration is followed using X-ray scans, µCT scans, and histology. It is shown that scaffold internal geometry, notably pore shape, influenced bone regeneration, which is homogenous longitudinally. Scaffolds with cubic pores of ≈870 µm and a low BMP-2 dose of ≈120 µg cm-3 induce the best bone regeneration without any adverse effects. The visual score given by clinicians during animal follow-up is found to be an easy way to predict bone regeneration. This work opens perspectives for a clinical application in personalized bone regeneration.

Keywords: 3D printing; bone tissue engineering; large animal models; medical devices; surface coatings.


Conflict of interest statement

The authors declare no conflict of interest.

Figures

Figure 1
Figure 1
Summary of the experimental design. Each investigation is presented: Type of scaffold used, dimension of the scaffold, type of experiments and readout of the experiments.
Figure 2
Figure 2
In vitro biocompatibility assays on 2D PLA discs. a) Direct cytotoxicity with contact. Cell viability compared to thermanox (expressed in %) is shown for each experimental condition: latex (positive control), bare PLA discs, film‐coated PLA discs, and film‐coated PLA discs loaded with two doses of BMP‐2: LD and HD. ANOVA with Bonferroni post‐hoc analysis was used. b) Direct cytotoxicity with extract. Cell viability compared to an extraction vehicle (expressed in %) is shown for each experimental condition. c) Cell attachment compared to plastic (expressed in %) for each experimental condition. Kruskal–Wallis ANOVA with Dunn's test was used. d) Cell proliferation, expressed as fluorescence arbitrary unit, for each experimental condition. Conditions were compared to the plastic control. Kruskal–Wallis ANOVA with Dunn's test was used. In all panels of this figure, experiments were performed with n = 3 or 4 samples per condition in each independent experiment. Data are represented as mean ± SD. *p < 0.05; **p < 0.01.
Figure 3
Figure 3
In vivo biocompatibility and biodegradability of films in rats quantified over time. Images of sections of PLA discs taken as a function of time at D7, D28, and D48 (endpoint) for the four experimental conditions studied: PLA; PLA + film; PLA+ film + BMP‐2 LD; PLA + film + BMP‐2 HD. a1–a3,d3) Scale bar is 1 mm. a1’, b1,c1–d1’,a2’,b2,c2,d2,a3’,b3,c3,d3,d3’) Scale bar is 100 µm. b1’,b2’,c2’,d2’,b3’c3’) Scale bar is 50 µm. Yellow arrows: fibrous capsule. (*) Macrophages and/or polynuclear cells. F: biomimetic film. NB: new bone. Red arrows: macrophagic border. VFS: vascularized fibroblastic shell. Green arrows: osteoblasts. (#) Giant multinucleated cells. e) Quantification of the bone area (mm2) formed at D28 and D48 when BMP‐2 was used. ANOVA with Bonferroni post‐hoc analysis was used. * p < 0.05 compared to D7. f) Quantitative analysis of the amount of film (%) remaining on the biomaterials surface. Kruskal–Wallis ANOVA with Dunn's test was used and showed that there was no significant statistical difference between conditions. In (e,f), for each time point, there were n = 12 samples per condition using n = 3 rats, each receiving four implants. Data are represented as mean ± SD.
Figure 4
Figure 4
Characterization of BMP‐2 loading in 3D mini‐scaffolds. a) Quantification of the total dose of BMP‐2 incorporated in 3D mini‐scaffolds as a function of the BMP‐2 initial concentration in the loading solution expressed as absolute mass (µg) and b) expressed as surface dose in µg cm 2. The parameters extracted from the fits of the data are given in Table S2a,b, Supporting Information, respectively. n = 3 scaffolds per geometry. Data are expressed as mean ± SD. c) Total dose of BMP‐2 incorporated in 3D scaffolds prepared for in vivo experiments in sheep (µg) as a function of scaffold geometry. d) BMP‐2 dose incorporated in 3D scaffolds prepared for in vivo experiments in sheep expressed as surface dose (µg cm 2) after normalization by the scaffold effective surface, as a function of scaffold geometry. In (c,d), n = 7 for Cubic S, n = 8 for Gyroid S (one scaffold was not implanted), and n = 2 for Gyroid L and Cubic‐Gyroid. Data are presented by median and interquartile range. ANOVA with Bonferroni test was used and showed that there was no significant statistical difference between conditions. e) Fluorescence macroscopy images of 3D scaffolds loaded with BMP‐2Rhod for each studied geometry Cubic S, Gyroid S, Gyroid L, and Cubic‐Gyroid. Scale bar is 1 mm.
Figure 5
Figure 5
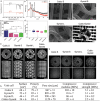
Physico‐chemical, mechanical, and morphological characterization of PLA scaffolds and film coating. a) ATR‐FTIR transmittance spectra of rgPLA and cgPLA. Remarkable peaks are numbered and identified in Table S3, Supporting Information. b) SAXS spectra of rgPLA and cgPLA. Remarkable peaks are identified with Miller indices on the graph and in Table S4, Supporting Information. c) Compressive modulus (MPa) of the different scaffold geometries measured at different time points of the experiment: before incubation, after the immersion in a physiological solution over 12 weeks (scaffolds were never dried), and after the weight loss experiment, for which scaffolds were dried at each time point before weighing. Data are presented as mean ± SD. **p < 0.01. d) Weight loss (expressed in %) measured for the scaffolds of different the geometries Cubic S, Gyroid S, Gyroid L, and Cubic‐Gyroid. Data are presented by median and interquartile range. In (c,d), n = 3 for each condition and ANOVA with Bonferroni test was used. e) µCT scans of the different scaffold geometries. f) Representative SEM images of the top surface of the different scaffolds for each geometry. g) Fluorescence macroscopy images of PLLFITC coated‐scaffolds (scale bar: 1 mm). h) Table recapitulating all measured values for each geometry (n = 3): effective surface (in cm2), porosity (in %), pore size (in µm), compressive modulus (in MPa), compressive strength (MPa).
Figure 6
Figure 6
Preliminary experiment in sheep metatarsal critical‐size bone defect to assess the influence of scaffold geometry on bone regeneration. a) Representative X‐ray scans of bone regeneration achieved with film‐coated scaffolds loaded with BMP‐2 with different internal geometries at different time points: right after scaffold implantation (M0), after one, two, three months (M1, M2, M3), and after explantation (M4). b) X‐ray score given by the clinicians as a function of time for each scaffold geometry. Data are represented as mean ± SD of scores given by five clinicians and veterinarians. The scores for Cubic S were linearly fitted (R 2 = 0.97). c) Representative µCT scans acquired after explantation for each scaffold geometry. For each geometry, scans in the axial plane, longitudinal plane, and a 3D reconstruction are shown. d) Quantification of the newly formed bone volume for each scaffold geometry (n = 2 implants per geometry). e–g’) Representative histological sections for each scaffold geometry: Cubic S, Gyroid L, and Cubic‐Gyroid. For each geometry, a global section and a magnified view are given. Bone is stained in pink. NB: new bone. (*) Giant cells. Black arrow: multinucleated giant cells.
Figure 7
Figure 7
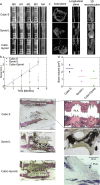
Main experiment in sheep metatarsal critical‐size bone defect to assess the influence of pore shape and optimize bone regeneration. a) Representative X‐ray scans acquired at different time points: right after scaffold implantation (M0), after one, two, three months (M1, M2, M3), and after explantation (M4) for each scaffold geometry. b) X‐ray score as a function of time (same calculation as in Figure 6). The scores for Cubic S and Gyroid S loaded with BMP‐2 were fitted with an exponential function y=Bmax+Aexp(tτ). Quantitative parameters obtained by the fit (B max and τ) are given in the table. Data are presented as mean ± SD. c) Representative µCT scans acquired after explantation for each scaffold geometry. For each geometry, scans in the axial plane, longitudinal plane, and a 3D reconstruction are shown. d) Quantification of the newly formed bone volume for each scaffold geometry, in comparison to bone autograft. Data are presented as box plots with median and interquartile range. Bone autograft (n = 2), Cubic S and Gyroid S (n = 7 for each) loaded with BMP‐2. Cubic S and Gyroid S without BMP‐2 (n = 2 for each). Student's t‐tests were performed. *p < 0.05; **p < 0.01. e) Correlation between the qualitative X‐ray score given by clinicians (at 4 months) and the quantitative bone volumes deduced from µCT images: for each sample, bone volume (cm3) is plotted versus mean X‐ray score. Data are represented as mean ± SD. Each type of scaffold has a given symbol and color.
Figure 8
Figure 8
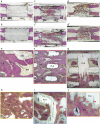
Histological analysis of scaffolds with Cubic S and Gyroid S geometries. Representative histological sections for the different scaffolds. Film‐coated PLA scaffold without BMP‐2: a) Cubic S and b) Gyroid S geometries. In the presence of BMP‐2 in the films, bone was formed in both types of scaffolds c,c’) Cubic S and d,d’) Gyroid S. At higher magnification, specific features of the newly formed bone were visible: e,f) Formation of mature lamellar bone (LB), homogeneous and dense bone with thick trabeculae filled with bone marrow (BM). Vessels (V) are also visible. g) Some remnants of the films (F) are visible, encapsulated in a fibrous capsule. h) Lamellar bone and bone marrow. i) Numerous multinucleated giant cells (red arrowheads); and j) these cells were visible close to the scaffold struts. Bone is stained in pink. PLA, PLA scaffold; BM, bone marrow; F, biomimetic film; LB, lamellar bone; NB, new bone; WB, woven bone; V, blood vessels. Scale bars: 2 mm (a–d); 400 µm (f,g); 200 µm (e,h,i); 100 µm (j).

References

    1. Decambron A., Fournet A., Bensidhoum M., Manassero M., Sailhan F., Petite H., Logeart‐Avramoglou D., Viateau V., J. Orthop. Res. 2017, 35, 2637. - PubMed
    1. Norris B. L., Vanderkarr M., Sparks C., Chitnis A. S., Ray B., Holy C. E., Injury 2021, 52, 2935. - PubMed
    1. Pape H. C., Evans A., Kobbe P., J. Orthop. Trauma 2010, 24, S36. - PubMed
    1. Jimi E., Hirata S., Osawa K., Terashita M., Kitamura C., Fukushima H., Int. J. Dent. 2012, 2012, 10.1155/2012/148261. - DOI - PMC - PubMed
    1. Laurencin C., Khan Y., El‐Amin S. F., Expert Rev. Med. Devices 2006, 3, 49. - PubMed

Publication types

LinkOut - more resources