. 2023 Sep 1;133(17):e169314.
doi: 10.1172/JCI169314.

Immune checkpoint blockade induces distinct alterations in the microenvironments of primary and metastatic brain tumors

Affiliations

Immune checkpoint blockade induces distinct alterations in the microenvironments of primary and metastatic brain tumors

Lu Sun et al. J Clin Invest. .

Abstract

In comparison with responses in recurrent glioblastoma (rGBM), the intracranial response of brain metastases (BrM) to immune checkpoint blockade (ICB) is less well studied. Here, we present an integrated single-cell RNA-Seq (scRNA-Seq) study of 19 ICB-naive and 9 ICB-treated BrM samples from our own and published data sets. We compared them with our previously published scRNA-Seq data from rGBM and found that ICB led to more prominent T cell infiltration into BrM than rGBM. These BrM-infiltrating T cells exhibited a tumor-specific phenotype and displayed greater activated/exhausted features. We also used multiplex immunofluorescence and spatial transcriptomics to reveal that ICB reduced a distinct CD206+ macrophage population in the perivascular space, which may modulate T cell entry into BrM. Furthermore, we identified a subset of progenitor exhausted T cells that correlated with longer overall survival in BrM patients. Our study provides a comprehensive immune cellular landscape of ICB's effect on metastatic brain tumors and offers insights into potential strategies for improving ICB efficacy for brain tumor patients.

Keywords: Brain cancer; Cancer immunotherapy; Immunology; Neuroscience.


Figures

Figure 1
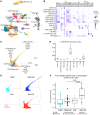
Figure 1. ICB increases T cell infiltration within the TME of BrM.
(A) Schematic of experimental design and analysis workflow. (B) The fraction of tumor-infiltrating T and myeloid cells analyzed with CyTOF (348,257 cells from 37 patients: 8 rGBM, 14 rGBM.ICB, 10 BrM, and 5 BrM.ICB). (C) The number of myeloid and T cells per mg of tissue section from 36 patients: 7 rGBM, 14 rGBM.ICB, 10 BrM, and 5 BrM.ICB. One rGBM sample was excluded because the tumor mass was not recorded. (D) UMAP of tumor-infiltrating CD45+ cells analyzed with scRNA-Seq with 170,129 cells from 53 patients: 11 rGBM, 14 rGBM.ICB, 19 BrM, and 9 BrM.ICB. rGBM and rGBM.ICB data are from Lee et al., 2021, 10 BrM samples are from Gonzalez et al., 2022, and 1 BrM.ICB sample is from Sade-Feldman et al., 2018. (E) The fraction of total TIL and myeloid cells (including the proliferating population) across different tumor groups analyzed by scRNA-Seq. (F) Representative mIF images of immune cell distribution in 33 ICB-naive BrM tumors. Original magnification, ×20. (G) Representative mIF images of immune cell distribution in 5 ICB-treated BrM tumors. Original magnification, ×20. (H) mIF quantification of immune-cell density within the stromal and tumor regions (33 BrM and 5 BrM.I CB). For all box plots, each dot represents a patient, the lower and upper bounds indicate the 25th and 75th percentiles, and the middle lines the median values. P values were calculated using a 2-sided Wilcoxon’s rank-sum test.
Figure 2
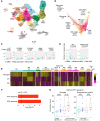
Figure 2. scRNA-Seq analysis of intratumoral lymphoid cells.
(A) UMAP of the lymphoid cells, with 32,508 cells from 53 patients: 11 rGBM, 14 rGBM.ICB, 19 BrM, and 9 BrM.ICB. (B) Dot plots of marker genes of lymphoid cell subtypes. (C) 3D diffusion map of CD8+ T cell clusters identified in A. Colors of the cell types are the same as in A. (D) Box plot of clonal expansion levels of T cell clusters from the 3 BrM.ICB samples with paired scTCR-Seq data. (E) 3D diffusion map as in C overlaid with each cell’s tumor type and treatment. (F) Sample-level enrichment score of tumor-specific CD8+ T cell gene signature across different tumor groups: 11 rGBM, 14 rGBM.ICB, 18 BrM, and 9 BrM.ICB. One BrM sample was excluded because it had fewer than 20 lymphoid cells. For all box plots, each dot represents a patient, the lower and upper bounds indicate the 25th and 75th percentiles, and the middle lines the median values. P values were calculated using a 2-sided Wilcoxon’s rank-sum test.
Figure 3
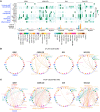
Figure 3. scRNA-Seq analysis of intratumoral myeloid cells.
(A) UMAP of the myeloid cells with 76,256 cells from 53 patients: 11 rGBM, 14 rGBM.ICB, 19 BrM, and 9 BrM.ICB. (B) 2D diffusion map of monocyte and macrophage clusters identified in A. Colors of the cell types are the same as in A. (C) Normalized expressions of genes which were differentially expressed between ICB-naive rGBM and BrM samples: 11 rGBM, 4 melanoma BrM, and 15 other BrM. (D) The fractions of MG and MDSC-ISG in ICB-naive rGBM and BrM samples: 11 rGBM, 4 melanoma BrM, and 15 other BrM. (E) Heatmap of single cell level enrichment of MG/macrophage gene signatures across different myeloid clusters identified in A. (F) MSigDB Hallmark gene signature enrichment of genes that were differentially upregulated by ICB in BrM compared with rGBM: (log2FC[BrM.ICB – rGBM.ICB] – log2FC[BrM – rGBM] ≥ 0.322). (G) Sample-level enrichment score of MSigDB Hallmark IFNG signature in MG- and blood-derived myeloid compartments across different tumor groups: 11 rGBM, 14 rGBM.ICB, 19 BrM, and 9 BrM.ICB. For all box plots, each dot represents a patient, the lower and upper bounds indicate the 25th and 75th percentiles, and the middle lines the median values. P values were calculated using 2-sided Wilcoxon’s rank-sum test.
Figure 4
Figure 4. Interactome analysis of the scRNA-Seq–derived lymphoid and myeloid subtypes.
(A) The overall interaction strength of overrepresented pathways in BrM.ICB versus BrM. The bottom histogram compares the sum of normalized interaction strength per subtype. (B) Inferred CTLA4-CD28-CD80 signaling networks among the lymphoid and myeloid subtypes. (C) Inferred TIGIT-CD226-NECTIN2 signaling networks among the lymphoid and myeloid subtypes. For B and C, edge width represents the pathway-specific interaction strength. Up to the top 10 subsets based on the sum of their interaction probability were labeled.
Figure 5
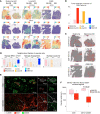
Figure 5. ST and mIF analysis of immune subtypes in BrM and rGBM.
(A) Spatial expression pattern of selected marker genes: PMEL, melanoma BrM; EPCAM, lung BrM; SOX2, rGBM; MKI67, cycling cells; GFAP, brain cells. (B) Fraction of CD8-Tterm.ex among all tumor-adjacent spots in each sample. (C) Spatial distribution of CD8-Tterm.ex subtype on melanoma and lung BrM and rGBM tissue sections. (D) Box plot showing the fraction of MRC1+ macrophage subtypes in the neighborhood of vascular cell spots. ***P ≤ 1 × 10–15. (E) Representative mIF images of CD3 and CD206 staining in blood vessel–enriched regions in 5 ICB-naive and 5 ICB-treated BrM tumors. Original magnification, × 20. (F) mIF quantification showing the number of CD3+ and CD14+CD206+ cells per mm2 of tumor section within the blood vessel–enriched regions (50 μm in diameter around α-SMA+ vessels). The analysis includes 5 BrM and 5 BrM.ICB patients. Each dot represents a patient. For all box plots, the lower and upper bounds indicate the 25th and 75th percentiles and the middle lines the median values. P values were calculated using a 2-sided Wilcoxon’s rank-sum test.
Figure 6
Figure 6. The frequency of T cell subsets is associated with overall survival of BrM and rGBM patients.
(A) Overall survival analysis by Kaplan-Meier plotting of BrM patients with high and low frequencies of the selected lymphoid subtypes. (B) Overall survival analysis by Kaplan-Meier plotting of rGBM patients with high and low frequencies of the selected lymphoid subtypes.

References

    1. Cagney DN, et al. Incidence and prognosis of patients with brain metastases at diagnosis of systemic malignancy: a population-based study. Neuro Oncol. 2017;19(11):1511–1521. doi: 10.1093/neuonc/nox077. - DOI - PMC - PubMed
    1. Hughes RT, et al. Initial SRS for patients with 5 to 15 brain metastases: results of a multi-institutional experience. Int J Radiat Oncol Biol Phys. 2019;104(5):1091–1098. doi: 10.1016/j.ijrobp.2019.03.052. - DOI - PubMed
    1. Lukas RV, et al. Treatment of brain metastases. Oncology. 2014;87(6):321–329. doi: 10.1159/000362389. - DOI - PubMed
    1. Achrol AS, et al. Brain metastases. Nat Rev Dis Primers. 2019;5(1):5. doi: 10.1038/s41572-018-0055-y. - DOI - PubMed
    1. Long GV, et al. Nivolumab for patients with advanced melanoma treated beyond progression: analysis of 2 phase 3 clinical trials. JAMA Oncol. 2017;3(11):1511–1519. doi: 10.1001/jamaoncol.2017.1588. - DOI - PMC - PubMed

Publication types

Substances