. 2023 Sep 1;133(17):e163128.
doi: 10.1172/JCI163128.

Autotaxin suppresses cytotoxic T cells via LPAR5 to promote anti-PD-1 resistance in non-small cell lung cancer

Affiliations

Autotaxin suppresses cytotoxic T cells via LPAR5 to promote anti-PD-1 resistance in non-small cell lung cancer

Jessica M Konen et al. J Clin Invest. .

Abstract

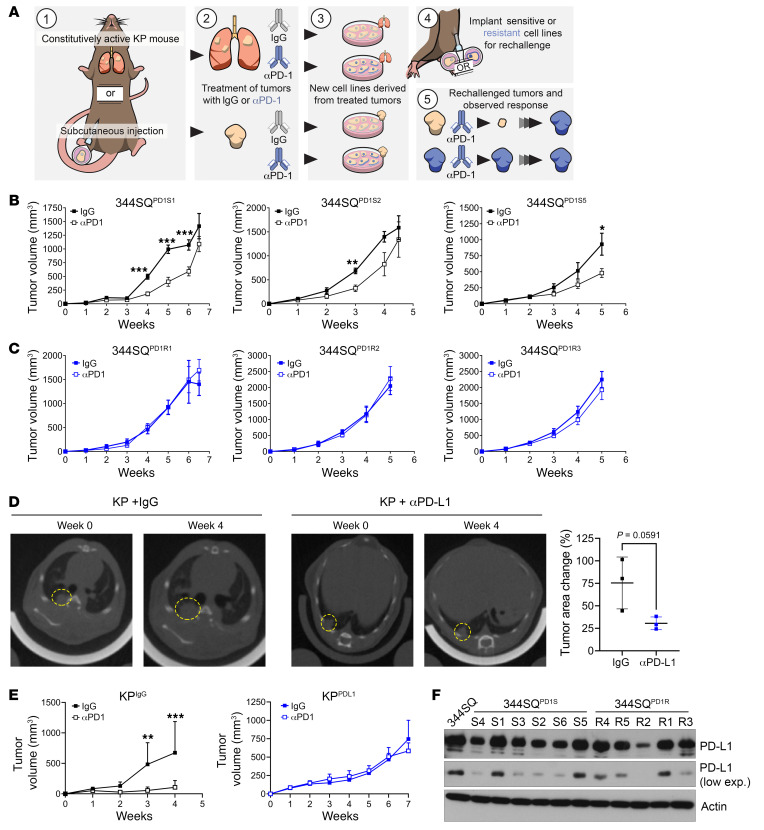
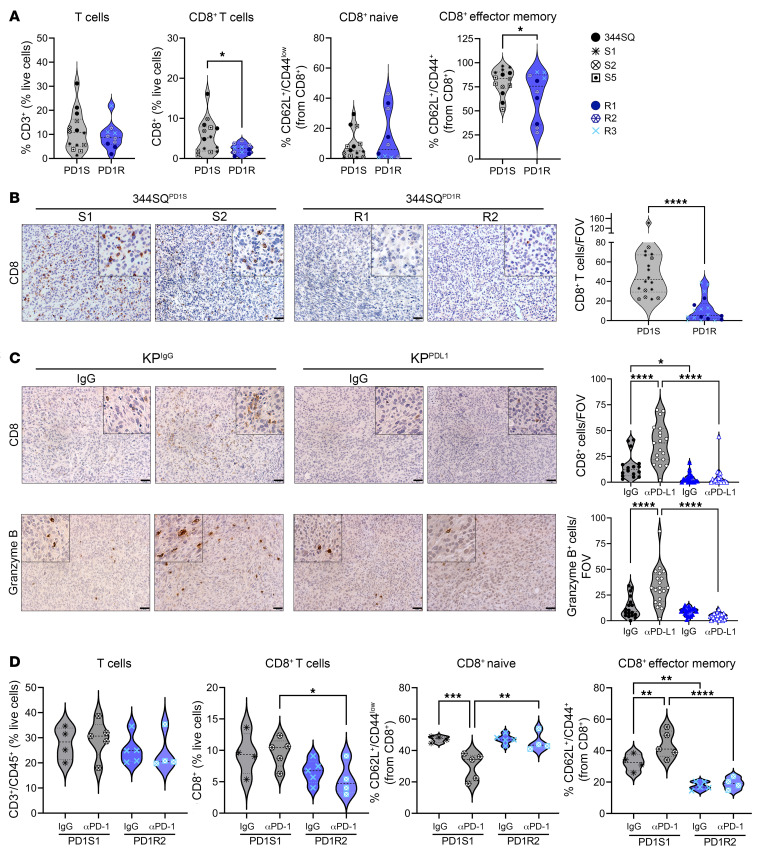
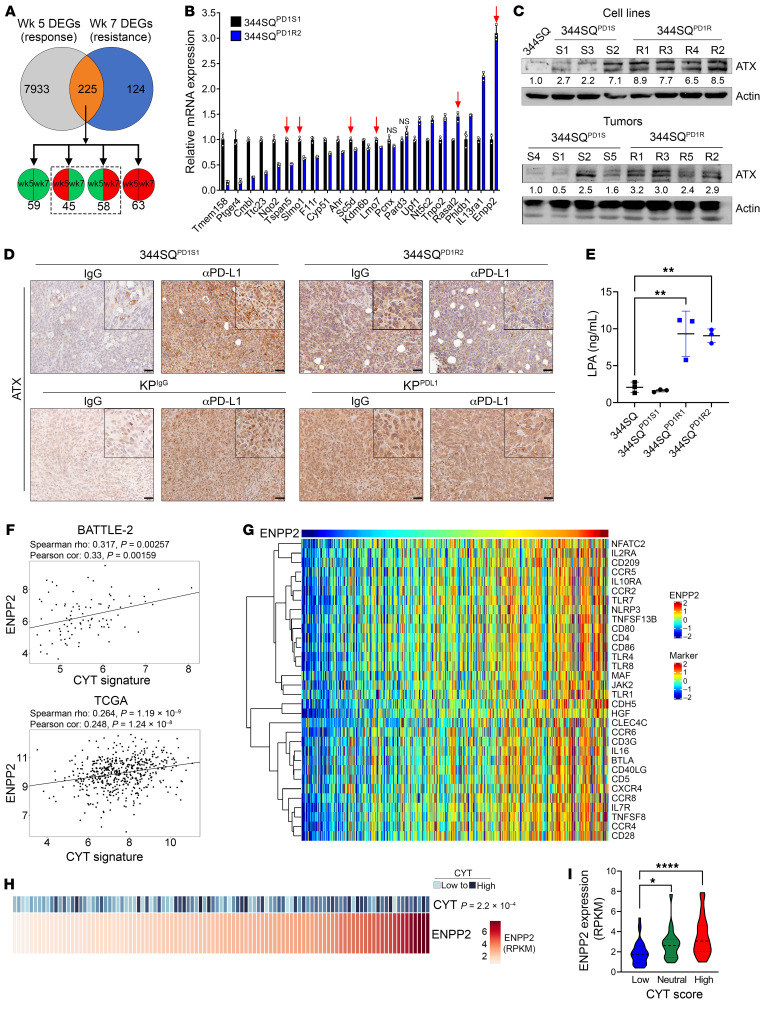
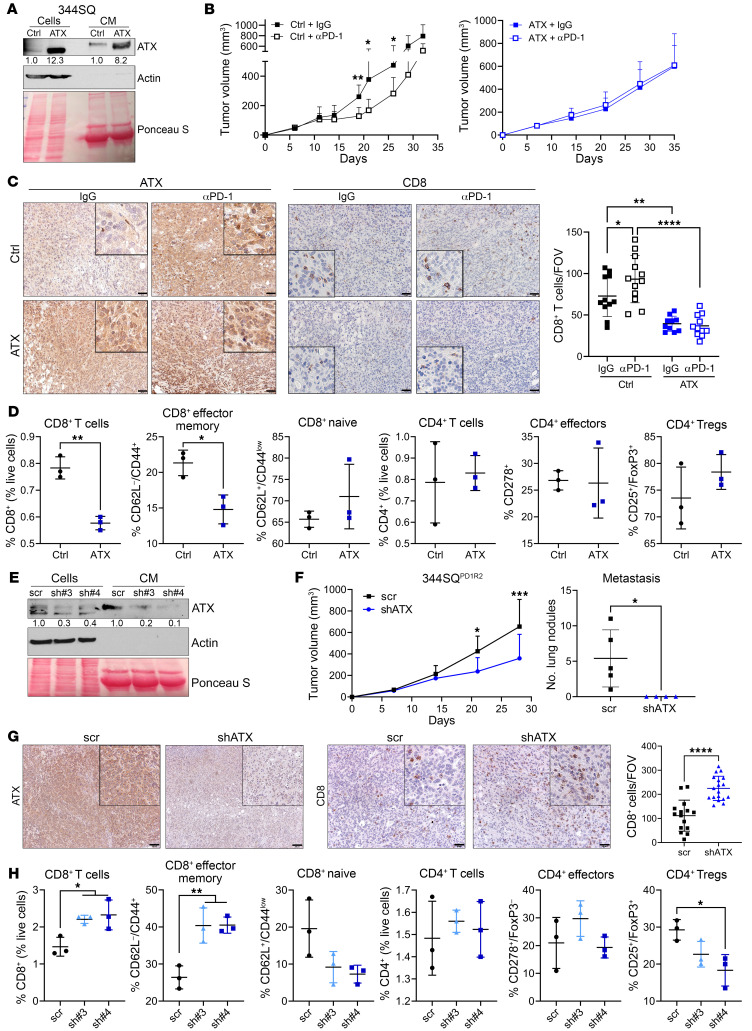
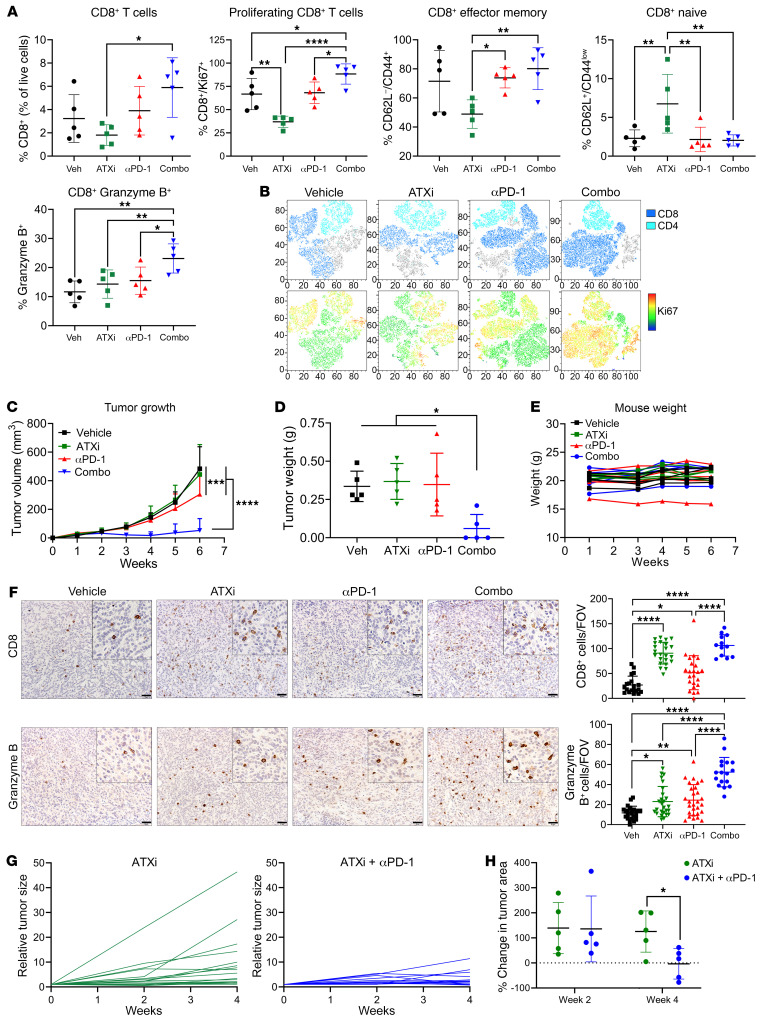
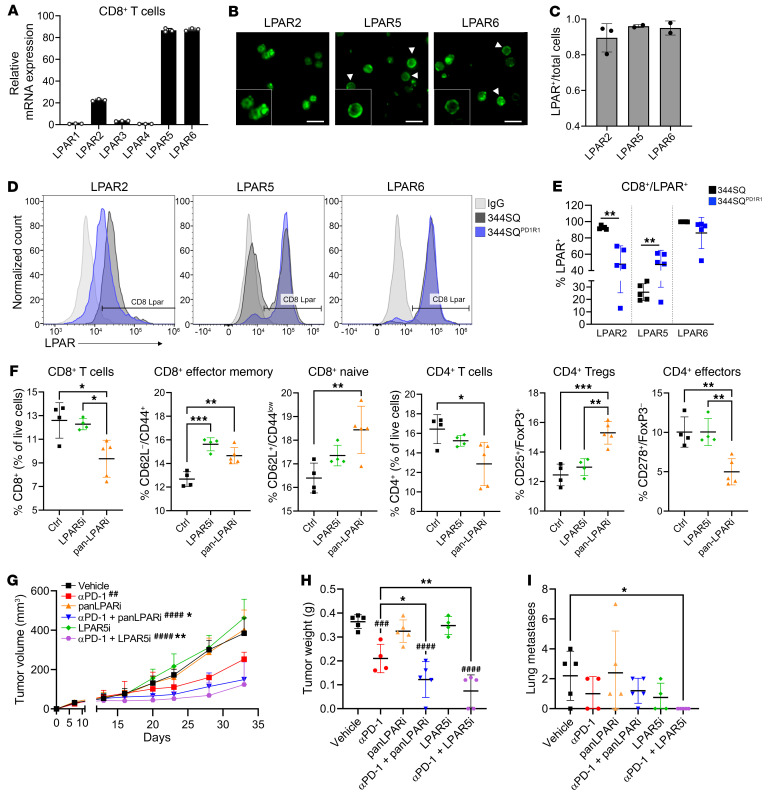
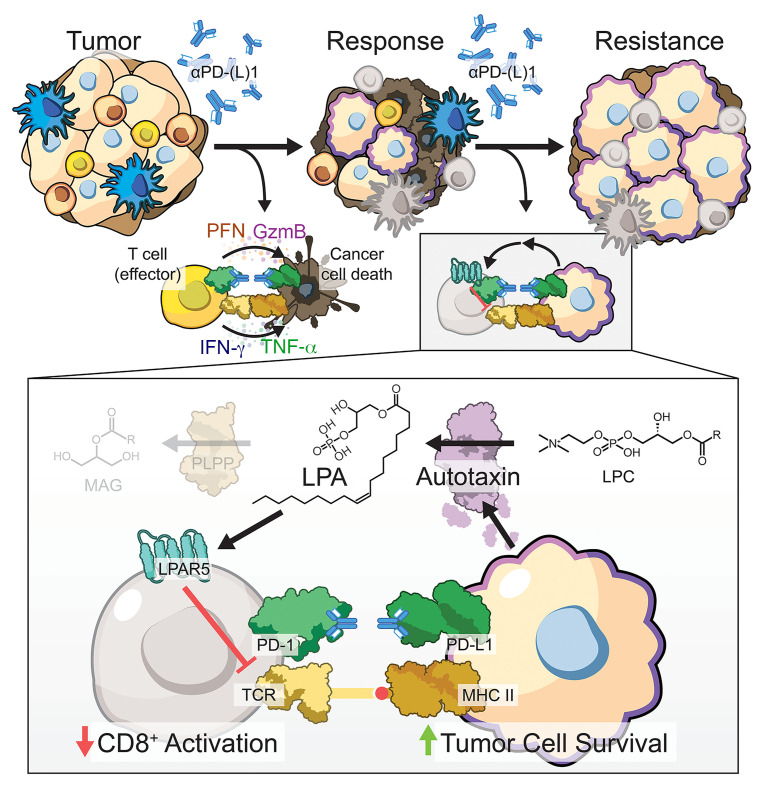
Non-small cell lung cancers that harbor concurrent KRAS and TP53 (KP) mutations are immunologically warm tumors with partial responsiveness to anti-PD-(L)1 blockade; however, most patients observe little or no durable clinical benefit. To identify novel tumor-driven resistance mechanisms, we developed a panel of KP murine lung cancer models with intrinsic resistance to anti-PD-1 and queried differential gene expression between these tumors and anti-PD-1-sensitive tumors. We found that the enzyme autotaxin (ATX), and the metabolite it produces, lysophosphatidic acid (LPA), were significantly upregulated in resistant tumors and that ATX directly modulated antitumor immunity, with its expression negatively correlating with total and effector tumor-infiltrating CD8+ T cells. Pharmacological inhibition of ATX, or the downstream receptor LPAR5, in combination with anti-PD-1 was sufficient to restore the antitumor immune response and efficaciously control lung tumor growth in multiple KP tumor models. Additionally, ATX was significantly correlated with inflammatory gene signatures, including a CD8+ cytolytic score in multiple lung adenocarcinoma patient data sets, suggesting that an activated tumor-immune microenvironment upregulates ATX and thus provides an opportunity for cotargeting to prevent acquired resistance to anti-PD-1 treatment. These data reveal the ATX/LPA axis as an immunosuppressive pathway that diminishes the immune checkpoint blockade response in lung cancer.

Keywords: Cancer immunotherapy; Immunology; Lung cancer; Oncology; Phosphodiesterases.


Conflict of interest statement

Conflict of interest: DLG has served a consulting/advisory role for Sanofi, GlaxoSmithKline, Eli Lilly, Menarini Ricerche, 4D Pharma, and Onconova, and has received research funding from Janssen Research and Development, Takeda, AstraZeneca, Astellas, Ribon Therapeutics, Boehringer Ingelheim, and NGM Biopharmaceuticals.

Figures

Figure 1
Figure 1. Tumor models created from KP subcutaneous tumors or GEMM lung tumors treated with anti–PD-(L)1 display intrinsic resistance when rechallenged in vivo.
(A) Schematic illustrating the development of anti–PD-1– or anti–PD-L1–resistant KP tumor models. Tumors were generated either with subcutaneous implantation models using syngeneic 344SQ KP murine lung cancer cells or from autochthonous lung tumors developed in the KrasLA1-G12D/p53R172HΔg GEMM. Mice were then treated with IgG control or PD-1/PD-L1 axis–blocking antibodies until the development of resistance. At this point, tumors were excised, cultured, and expanded ex vivo, and then reimplanted into wild-type (WT) mice for rechallenge with anti–PD-(L1). (B) Three of the 344SQ IgG-treated tumors described in A (344SQPD1S) were implanted into WT mice and treated with either IgG or anti–PD-1. Tumors were measured weekly with calipers. n = 5 mice per group. *P < 0.05, **P < 0.01, ***P < 0.001 by multiple t tests (1 per time point). (C) The anti–PD-1–treated tumors described in A (344SQPD1R) were implanted and treated as in B. (D) KrasLA1-G12D/p53R172HΔg mice were imaged by micro-CT to confirm lung nodule formation. Mice were randomly distributed into IgG or anti–PD-L1 treatment arms and treated for 4 weeks. Endpoint images using micro-CT were taken (left). The percentage change in tumor area was measured for 3 independent tumors per mouse (right). (E) Cell lines were derived from the IgG-treated (KPIgG) or anti–PD-L1–treated (KPPDL1) GEMMs described in D and implanted into WT mice. Mice were rechallenged with anti–PD-L1 or IgG control antibodies and tumor response measured over time using calipers. n = 5 mice per group. **P < 0.01, ***P < 0.001 by multiple t tests (1 per time point). (F) 344SQPD1S and 344SQPD1R cells were analyzed for PD-L1 expression by Western blotting (see supplemental material for full, uncut gels). Actin was used as a loading control.
Figure 2
Figure 2. Anti–PD-1–resistant tumor models demonstrate reduced CD8+ T cell and effector functions compared with sensitive tumors.
(A) Three of the 344SQPD1R lines, 3 of the 344SQPD1S lines, and the 344SQ parental line were implanted into WT mice. After 3 weeks, tumors were excised, processed into single cells, and stained for multicolor flow cytometry analysis of immune cell subsets. The total intratumoral T cells were gated as CD3+ as a percentage of total CD45+ cells. Under total T cells, we then analyzed the CD8+ T cells for total amounts and effector memory (CD62LCD44+) or naive (CD62L+CD44) status. Individual models are denoted by different symbols and colors. n = 2–5 mice per model. *P < 0.05 by t test. (B) Two representative cell lines for both 344SQPD1S and 344SQPD1R were implanted into WT mice and tumors grown until endpoint (about 6–7 weeks). Tumors were collected and analyzed via IHC for CD8+ T cells. A representative image per model is depicted (left). All tumors per group were combined and graphed as total CD8+ T cells per field of view (FOV) (right). n = 2 mice per cell line, 3–6 images per mouse tumor. ****P < 0.0001 by t test. Scale bars: 50 μm; insets zoomed 200%. (C) The KPIgG and KPPDL1 tumors from Figure 1E were collected for IHC and analyzed for total CD8+ T cells (top) and granzyme B staining (bottom). n = 3 tumors per condition, 5–6 images per tumor. *P < 0.05, ****P < 0.0001 by 1-way ANOVA with multiple comparisons corrected. Scale bars: 50 μm; insets zoomed 200%. (D) 344SQPD1S1 and 344SQPD1R2 models were implanted into WT mice and then treated with either IgG control or anti–PD-1 antibody. After 2 weeks of treatment, tumors were excised and analyzed via multicolor flow as described in A. *P < 0.05, **P < 0.01, ***P < 0.001, ****P < 0.0001.
Figure 3
Figure 3. Enpp2/ATX is upregulated with PD-(L)1 resistance in KP murine models and cytolytic gene signature in patients with human lung adenocarcinoma.
(A) Previously published transcriptomics from IgG or anti–PD-L1–treated 344SQ tumors were analyzed at week 5 (response) and week 7 (resistance) (17). DEGs between treatments at each time point (225 total) were analyzed for directionality, and we focused on DEGs that changed in directionality between time points (dashed box). (B) The top DEGs from A were analyzed via quantitative PCR in 344SQPD1S1 and 344SQPD1R2 cells and are graphed relative to 344SQPD1S1. Arrows denote genes changing in the same direction as the microarray. All genes except those marked “NS” are significantly different at P < 0.05, by t test. (C) The 344SQPD1S and 344SQPD1R cells (top) and tumors (bottom) were analyzed via Western blotting for Enpp2/ATX expression. Actin densitometric values were normalized to the corresponding actin band and then to the first lane. (D) Representative ATX IHC images in anti–PD-L1– or IgG-treated 344SQPD1S1 and 344SQPD1R2 (top) or KPIgG and KPPDL1 (bottom) tumors. Scale bars: 50 μm; insets zoomed 200%. (E) Conditioned media from 344SQPD1S and 344SQPD1R models were analyzed for LPA via ELISA. **P < 0.01, by 1-way ANOVA. (F) ENPP2 expression in lung adenocarcinoma patients with lung adenocarcinoma was correlated with a previously described T cell cytolytic score (CYT) (62) in BATTLE-2 (top) and TCGA Firehouse Legacy (bottom) data sets. (G) ENPP2 expression in TCGA Firehouse Legacy samples was correlated with a previously published inflammatory gene signature (33) (rho cutoff, 0.4; FDR, 0.05). (H and I) Analysis of ENPP2 in the MD Anderson ICON data set. (H) Correlation of ENPP2 with the CYT score as described in F. (I) ENPP2 expression was compared across ICON patients grouped as having a low, neutral, or high CYT score. *P < 0.05 and ****P < 0.0001, by Wilcoxon’s rank-sum testing.
Figure 4
Figure 4. ATX expression negatively correlates with CD8+ T cell infiltration and effector status in tumors.
(A) 344SQ-control (ctrl) or ATX-overexpressing cells were analyzed via Western blotting of cells and conditioned media (CM). ATX densitometric values were normalized to the corresponding actin or Ponceau bands and then to 344SQ-ctrl. (B) Tumor growth was measured from mice implanted with 344SQ-ctrl or -ATX cells and treated with IgG or anti–PD-1. n = 5 mice per group. *P < 0.05 and **P < 0.01, by multiple t tests (per time point). (C) Representative ATX and CD8 IHC images completed on tumors from B. CD8+ T cells were quantified as number per FOV. n = 3 mice each. *P < 0.05, **P < 0.01, and ****P < 0.0001, by 1-way ANOVA. Scale bars: 50 μm; insets zoomed 300% (ATX) or 250% (CD8). (D) 344SQ-ctrl or -ATX cells were cocultured with naive immune cells over time, and immune cell populations were analyzed by flow cytometry. The experiment was completed twice. *P < 0.05 and **P < 0.01, by t test. (E) 344SQPD1R2 cells depleted of ATX using 2 shRNAs or a control (scr) were analyzed as in A. (F) Tumor growth from 344SQPD1R2-scr and shATX#4 cells implanted into mice was monitored via calipers (left). Metastatic lung nodules were quantified at necropsy (right). n = 4–5 mice per group. *P < 0.05 and ***P < 0.001, by multiple t tests (G) Representative ATX and CD8 IHC images completed on tumors from F. n = 2 mice each, 6–9 FOV per tumor. ****P < 0.0001, by t test. Scale bars: 100 μm (ATX), 50 μm (CD8); insets zoomed 200%. (H) The 344SQPD1R2-scr and shATX cells from E were cocultured with naive immune cells as in D. The experiment was completed twice. *P < 0.05, **P < 0.01, and ***P < 0.001, by 1-way ANOVA.
Figure 5
Figure 5. Pharmacological targeting of ATX in combination with PD-1 blockade promotes CD8+ T cell proliferation and activation, effectively controlling tumor growth in vivo.
(A) 344SQ cells were implanted into mice and treated with IgG/vehicle, ATX inhibitor (ATXi), anti–PD-1, or a combination. After 1 week of treatment, tumors were processed for flow cytometry of immune populations. *P < 0.05, **P < 0.01, and ****P < 0.0001, by 1-way ANOVA. (B) Representative t-distributed stochastic neighbor embedding (TSNE) plots of data from A. Total CD3+ (top) and CD3+Ki67+ (bottom) cells are depicted. (CF) 344SQ cells were implanted into mice and treated as described in A. n = 5 mice per group. (C) Tumor growth was measured via calipers. ***P < 0.001 and ****P < 0.0001, by 2-way ANOVA with Tukey’s correction. (D) Tumor weights were collected at necropsy. *P < 0.05, by 1-way ANOVA with Tukey’s correction. (E) Mouse weights were recorded weekly. (F) Representative CD8 (top) and granzyme B (bottom) IHC images on tumors from C. Cells per FOV were quantified as in Figure 2D. n = 3 mice per group (except the combination, which had 2 tumors at endpoint), 6–9 FOV per tumor. *P < 0.05, **P < 0.01, and ****P < 0.0001, by 1-way ANOVA with Tukey’s correction. Scale bars: 50 μm; insets zoomed 200%. (G and H) KrasLSL-G12D/p53wmR172H mice were given adenoviral Cre recombinase intratracheally, and tumor formation was monitored via micro-CT imaging (Supplemental Figure 7D). After tumor development, mice were randomized and treated for 4 weeks. n = 5 mice per group. (G) Individual tumors were measured at weeks 0, 2, and 4 and normalized to week 0. (H) Percentage change of tumor size was calculated between each time point. All individual tumors per mouse were measured, and median growth is shown. n = 5 mice per group. *P < 0.05, by t test.
Figure 6
Figure 6. Targeting LPAR5 on CD8+ T cells significantly increases effector functions and antitumor activity.
(A) CD8+ T cells were purified from murine spleens and collected for quantitative PCR analysis of LPARs, which were then normalized to LPAR1. (B) Immunofluorescence images of LPAR2, LPAR5, and LPAR6 on murine CD8+ T cells. Arrowheads denote cells with membranous LPAR. Scale bars: 10 μm; insets zoomed 150%. (C) Images from B were quantified as a fraction of LPAR+ cells compared with total nuclei (DAPI). (D) 344SQ and 344SQPD1R1 cells were implanted into mice (n = 5 mice each). After 3 weeks, tumors were processed for flow cytometry. Each tumor was separated into 3 samples and stained with LPAR2, LPAR5, or LPAR6. Histograms depict CD8+LPAR+ cells. An IgG-stained sample is shown as a negative control. (E) Quantification of the experiment in D, which was completed twice. **P < 0.01, by t test. (F) 344SQPD1R2 cells were cocultured with naive immune cells and treated with vehicle, LPAR5 inhibitor (AS2717638), or pan-LPAR inhibitor (BrP-LPA). Immune cells were then analyzed by flow cytometry. The experiment was completed twice. *P < 0.05, **P < 0.01, and ***P < 0.001, by 1-way ANOVA. (GI) 344SQ cells were implanted into mice and treated with vehicle, anti–PD-1, BrP-LPA alone or with anti–PD-1, or AS2717638 alone or with anti–PD-1. n = 5 mice per group. (G) Tumor growth was monitored with calipers. ##P < 0.01 and ####P < 0.0001, by 1-way ANOVA compared with vehicle; *P < 0.05 and **P < 0.01, by 1-way ANOVA compared with anti–PD-1. (H) Tumor weight recorded at necropsy. ###P < 0.001 and ####P < 0.0001, by 1-way ANOVA compared with vehicle; *P < 0.05 and **P < 0.01, by 1-way ANOVA compared with anti–PD-1. (I) Lung metastases recorded at necropsy. *P < 0.05, by 1-way ANOVA.
Figure 7
Figure 7. The ATX/LPA axis is upregulated with anti–PD-(L)1 treatment resistance, modulating CD8+ T cell functionality via LPAR5 activation.
Kras/p53 mutant lung cancers respond initially to PD-1/PD-L1 axis blockade, but eventually acquire resistance. Our data indicate that a robust and stable upregulation of the enzyme autotaxin (ATX) occurs with resistance, which causes an aberrant accumulation of its bioactive metabolite, lysophosphatidic acid (LPA). LPA acts in a paracrine manner on tumor-resident immune cells, particularly the CD8+ T cell compartment. Activation of LPA receptor 5 (LPAR5) via LPA diminishes T cell receptor signaling and downstream activation required for effective antitumor functionality, thereby promoting tumor cell survival. Targeting ATX or LPAR5 with anti–PD-1 treatment can promote antitumor immunity by restoring T cell proliferation and activation, leading to more efficacious control of lung cancer growth.

References

    1. Surveillance, Epidemiology, and End Results Program. Stat Fact Sheets: Lung and Bronchus. http://seer.cancer.gov/statfacts/html/lungb.html Accessed June 14, 2022.
    1. Borghaei H, et al. Nivolumab versus docetaxel in advanced nonsquamous non-small-cell lung cancer. N Engl J Med. 2015;373(17):1627–1639. doi: 10.1056/NEJMoa1507643. - DOI - PMC - PubMed
    1. Brahmer JR, et al. Safety and activity of anti-PD-L1 antibody in patients with advanced cancer. N Engl J Med. 2012;366(26):2455–2465. doi: 10.1056/NEJMoa1200694. - DOI - PMC - PubMed
    1. Topalian SL, et al. Safety, activity, and immune correlates of anti-PD-1 antibody in cancer. N Engl J Med. 2012;366(26):2443–2454. doi: 10.1056/NEJMoa1200690. - DOI - PMC - PubMed
    1. Borghaei H, et al. Five-year outcomes from the randomized, phase III trials CheckMate 017 and 057: nivolumab versus docetaxel in previously treated non–small-cell lung cancer. J Clin Oncol. 2021;39(7):723–733. doi: 10.1200/JCO.20.01605. - DOI - PMC - PubMed

Publication types

Substances