Published Erratum
. 2023 Nov;29(22):6423-6433.
doi: 10.1111/gcb.16910. Epub 2023 Sep 1.

Corrigendum

No authors listed
Published Erratum

Corrigendum

No authors listed. Glob Chang Biol. 2023 Nov.
No abstract available


Figures

None
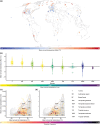
FIGURE 1 Temperature offsets between soil and air temperature differed significantly among biomes. (a) Distribution of in situ measurement locations across the globe, coloured by the mean annual temperature offset (in °C) between in situ measured soil temperature (topsoil, 0–5 cm depth) and gridded air temperature (ERA5‐Land). Offsets were averaged per hexagon, each with a size of approximately 70,000 km². Mollweide projection. (b) Mean annual temperature offsets per Whittaker biome (adapted from Whittaker 1970, based on geographic location of sensors averaged at 1 km2; 0–5 cm depth), ordered by mean temperature offset and coloured by mean annual precipitation. (c–d) Distribution of sensors in 2D climate space for the topsoil (c, 0–5 cm depth, N = 4530) and the second layer (d, 5–15 cm depth, N = 3989). Colours of hexagons indicate the number of sensors at each climatic location, with a resolution of 1.2°C (x‐axis) and 100 mm (y‐axis). Grey dots in the background represent the global variation in climatic space (obtained by sampling 1,000,000 random locations from the CHELSA world maps). Overlay with grey lines depicts a delineation of Whittaker biomes. [Colour figure can be viewed at wileyonlinelibrary.com]
None
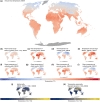
FIGURE 2 Global modelled temperature offsets between soil and air temperature show strong spatiotemporal variation across months. Modelled annual (a) and monthly (b–m) temperature offset (in °C) between in situ measured soil temperature (topsoil, 0–5 cm) and gridded air temperature. Positive (red) values indicate soils that are warmer than the air. Dark grey represents regions outside the modelling area. [Colour figure can be viewed at wileyonlinelibrary.com]
None
FIGURE 3 Soil bioclimatic variables. Global maps of bioclimatic variables for topsoil (0–5 cm depth) climate, calculated using the maps of the monthly offsets between soil and air temperature (see Figure 2), and the bioclimatic variables for air temperature from CHELSA. [Colour figure can be viewed at wileyonlinelibrary.com]
None
FIGURE 4 Mean annual soil temperature shows significantly lower spatial variability than air temperature. (a) Global map of mean annual topsoil temperature (SBIO1, 0–5 cm depth, in °C), created by adding the monthly offset between soil and air temperature for the period 2000–2020 (Figure 2) to the monthly air temperature from CHELSA. A black mask is used to exclude regions where our models are extrapolating (i.e. interpolation values in Figure 5 are <0.9, 18% of pixels). Dark grey represents regions outside the modelling area. (b–c) Density plots of mean annual soil temperature across the globe (b) and for each Whittaker biome separately (c) for SBIO1 (dark grey, soil temperature), compared with BIO1 from CHELSA (light grey, air temperature), created by extracting 1,000,000 random points from the 1‐km² gridded bioclimatic products. The numbers in (c) represent the standard deviations of air temperature (light grey) and soil temperature (dark grey). Biomes are ordered according to the median annual soil temperature values (vertical black line) from the highest temperature (subtropical desert) to the lowest (tundra). [Colour figure can be viewed at wileyonlinelibrary.com]
None
FIGURE 5 Models of the temperature offset between soil and air temperature have low standard deviations and good global coverage. Analyses for the temperature offset between in situ measured topsoil (0–5 cm depth) temperature and gridded air temperature. (a) Standard deviation (in °C) over the predictions from a cross‐validation analysis that iteratively varied the set of covariates (explanatory data layers) and model hyperparameters across 100 models and evaluated model strength using 10‐fold cross‐validation, for January (left) and July (right), as examples of the two most contrasting months. (b) The fraction of axes in the multidimensional environmental space for which the pixel lies inside the range of data covered by the sensors in the database. Low values indicate increased extrapolation. [Colour figure can be viewed at wileyonlinelibrary.com]
None
FIGURE 6 The mean annual soil temperature (SBIO1, 1 x 1 km resolution) modelled here is consistently cooler than ERA5L (9 x 9 km) soil temperature in forested areas. (a) Spatial representation of the difference between SBIO1 based on our model and based on ERA5L soil temperature data. Negative values (blue colours) indicate areas where our model predicts cooler soil temperature. Dark grey areas (Greenland and Antarctica) are excluded from our models. Asterisk in Scandinavia indicates the highlighted area in panels d to f (see below). (b) Distribution of the difference between SBIO1 and ERA5L along the macroclimatic gradient (represented by SBIO1 itself) based on a random subsample of 50,000 points from the map in a). Red line from a Generalized Additive Model (GAM) with k = 4. (c–e) High‐resolution zoomed panels of an area of high elevational contrast in Norway (from 66.0–66.4° N, 15.0–16.0° E) visualizing SBIO1 (c), ERA5L (d) and their difference (e), to highlight the higher spatial resolution as obtained with SBIO1. [Colour figure can be viewed at wileyonlinelibrary.com]
None
CORRIGENDUM FIGURE 1 Difference between the modeled mean annual temperature in the topsoil layer (SBio1) following the corrected (new) calculation versus the original (old) calculation. (a) Pixel‐level differences in temperature (new minus old). (b) Temperature differences (new minus old) as a function of SBio1, showing more consistent lower temperatures in cold climates following the corrected calculations. (c) Histogram of errors in mean annual temperature. [Colour figure can be viewed at wileyonlinelibrary.com]
None
CORRIGENDUM FIGURE 2 Difference between the modeled maximum temperature of the warmest month in the topsoil layer (SBio5) following the corrected (new) calculation versus the original (old) calculation. (a) Pixel‐level differences in temperature. (b) Temperature differences (new minus old) as a function of SBio5, showing higher temperatures in cold and warm climates following the corrected calculations. (c) Histogram of errors in maximum temperature of the warmest month. [Colour figure can be viewed at wileyonlinelibrary.com]
None
CORRIGENDUM FIGURE 3 Difference between the modeled minimum temperature of the coldest month in the topsoil layer (SBio6) following the corrected (new) calculation versus the original (old) calculation. (a) Pixel‐level differences in temperature (new minus old). (b) Temperature differences (new minus old) as a function of SBio6, showing overall higher temperatures following the corrected calculations. (c) Histogram of errors in minimum temperature of the coldest month. [Colour figure can be viewed at wileyonlinelibrary.com]

Erratum for

  • Global maps of soil temperature.
    Lembrechts JJ, van den Hoogen J, Aalto J, Ashcroft MB, De Frenne P, Kemppinen J, Kopecký M, Luoto M, Maclean IMD, Crowther TW, Bailey JJ, Haesen S, Klinges DH, Niittynen P, Scheffers BR, Van Meerbeek K, Aartsma P, Abdalaze O, Abedi M, Aerts R, Ahmadian N, Ahrends A, Alatalo JM, Alexander JM, Allonsius CN, Altman J, Ammann C, Andres C, Andrews C, Ardö J, Arriga N, Arzac A, Aschero V, Assis RL, Assmann JJ, Bader MY, Bahalkeh K, Barančok P, Barrio IC, Barros A, Barthel M, Basham EW, Bauters M, Bazzichetto M, Marchesini LB, Bell MC, Benavides JC, Benito Alonso JL, Berauer BJ, Bjerke JW, Björk RG, Björkman MP, Björnsdóttir K, Blonder B, Boeckx P, Boike J, Bokhorst S, Brum BNS, Brůna J, Buchmann N, Buysse P, Camargo JL, Campoe OC, Candan O, Canessa R, Cannone N, Carbognani M, Carnicer J, Casanova-Katny A, Cesarz S, Chojnicki B, Choler P, Chown SL, Cifuentes EF, Čiliak M, Contador T, Convey P, Cooper EJ, Cremonese E, Curasi SR, Curtis R, Cutini M, Dahlberg CJ, Daskalova GN, de Pablo MA, Della Chiesa S, Dengler J, Deronde B, Descombes P, Di Cecco V, Di Musciano M, Dick J, Dimarco RD, Dolezal J, Dorrepaal E, Dušek J, Eisenhauer N, Eklundh L, Erickson TE, Erschbamer B, Eugster W, Ewers RM, … See abstract for full author list ➔ Lembrechts JJ, et al. Glob Chang Biol. 2022 May;28(9):3110-3144. doi: 10.1111/gcb.16060. Epub 2022 Feb 11. Glob Chang Biol. 2022. PMID: 34967074 Free PMC article.

References

    1. Lembrechts, J. J. , van den Hoogen, J. , Aalto, J. , Ashcroft, M. B. , De Frenne, P. , Kemppinen, J. , Kopecký, M. , Luoto, M. , Maclean, I. M. D. , Crowther, T. W. , Bailey, J. J. , Haesen, S. , Klinges, D. H. , Niittynen, P. , Scheffers, B. R. , Van Meerbeek, K. , Aartsma, P. , Abdalaze, O. , Abedi, M. , … Lenoir, J. (2022). Global maps of soil temperature. Global Change Biology, 28, 3110–3144. 10.1111/gcb.16060 - DOI - PMC - PubMed

Publication types