. 2023 Sep 13;145(36):19662-19675.
doi: 10.1021/jacs.3c04303. Epub 2023 Sep 1.

Unveiling the Crucial Roles of O2•- and ATP in Hepatic Ischemia-Reperfusion Injury Using Dual-Color/Reversible Fluorescence Imaging

Affiliations

Unveiling the Crucial Roles of O2•- and ATP in Hepatic Ischemia-Reperfusion Injury Using Dual-Color/Reversible Fluorescence Imaging

Jihong Liu et al. J Am Chem Soc. .

Abstract

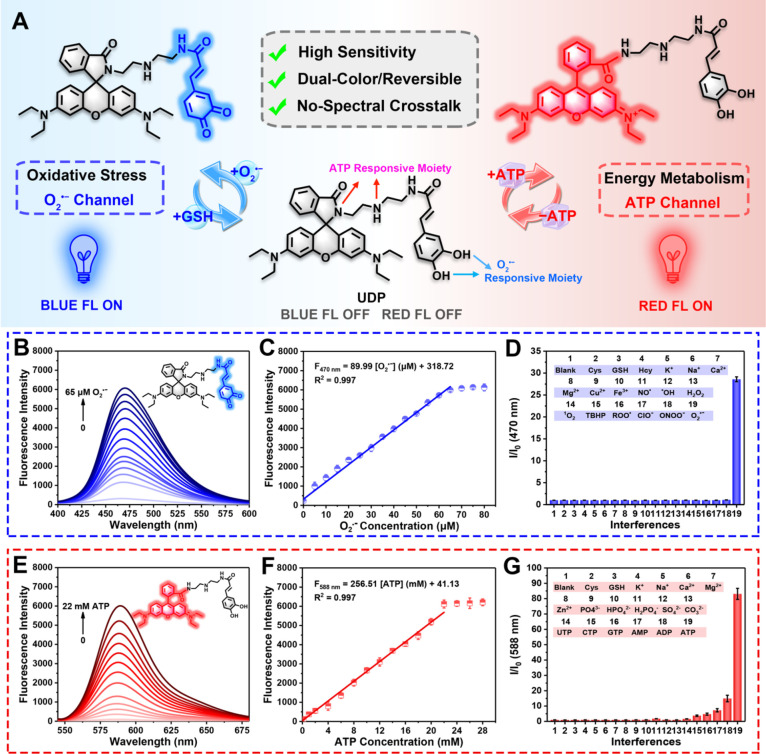
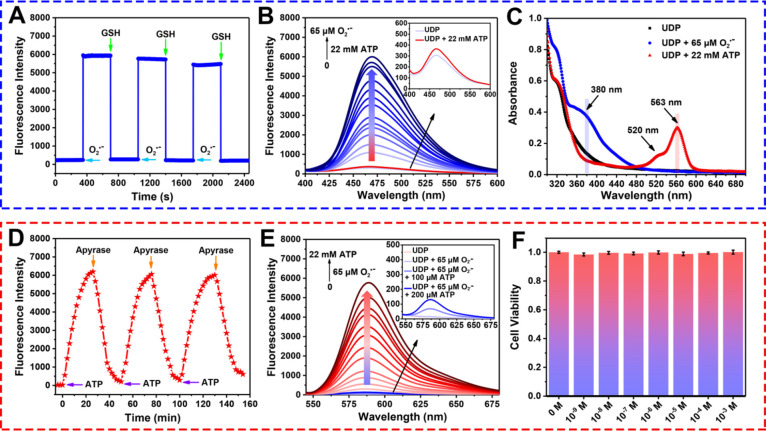
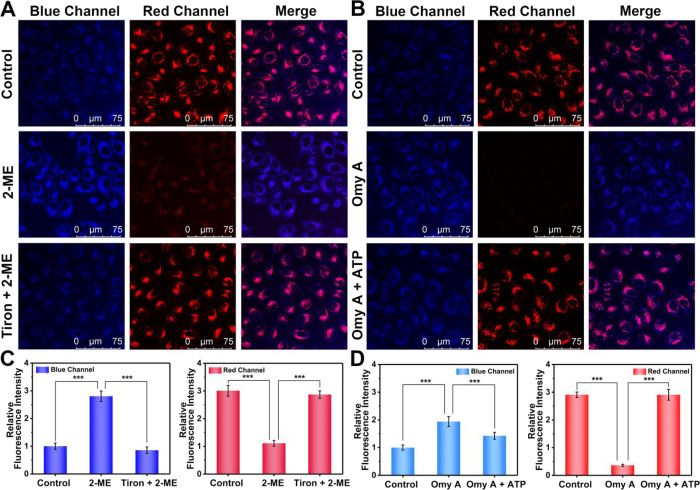
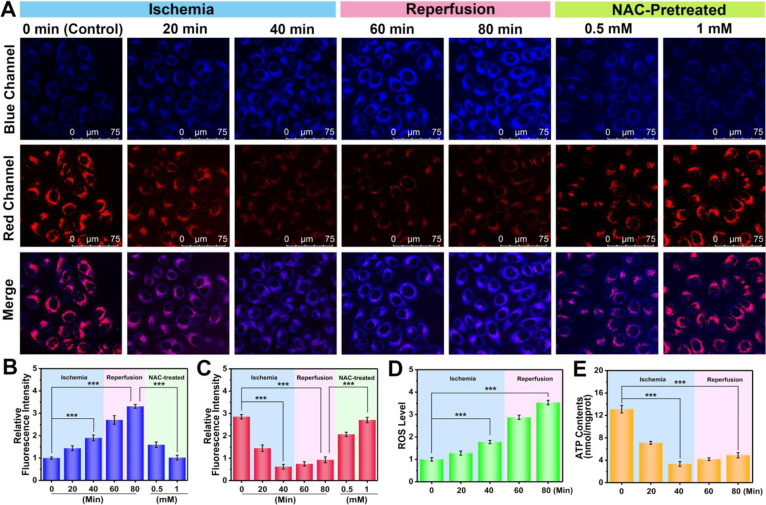
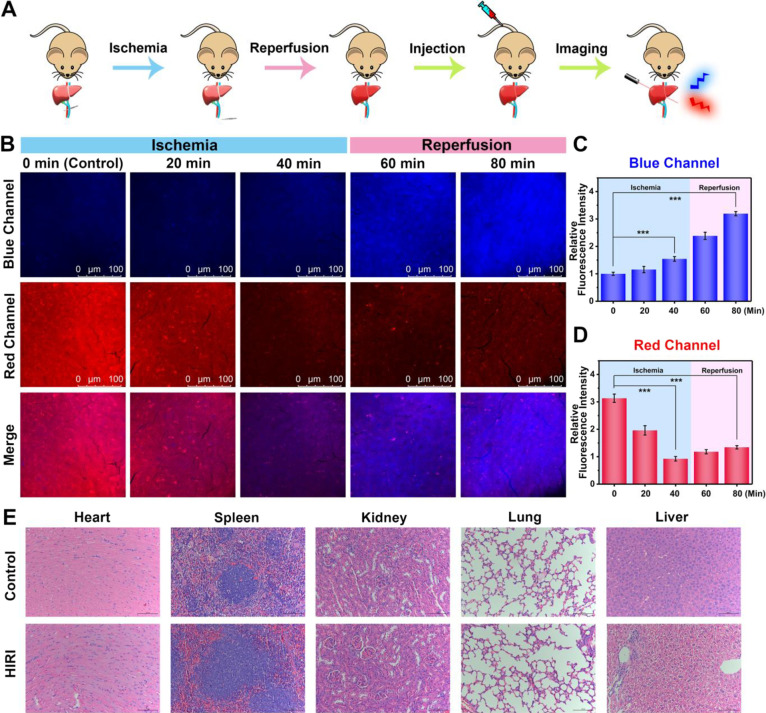
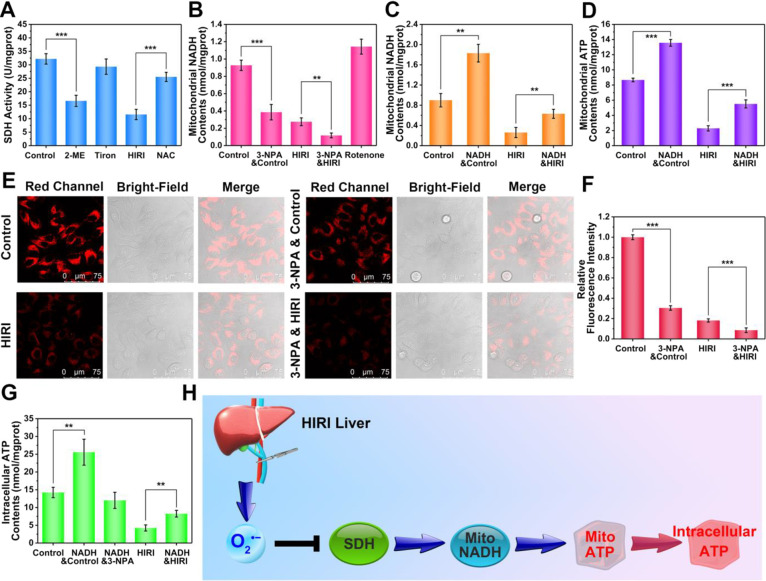
Hepatic ischemia-reperfusion injury (HIRI) is mainly responsible for morbidity or death due to graft rejection after liver transplantation. During HIRI, superoxide anion (O2-) and adenosine-5'-triphosphate (ATP) have been identified as pivotal biomarkers associated with oxidative stress and energy metabolism, respectively. However, how the temporal and spatial fluctuations of O2- and ATP coordinate changes in HIRI and particularly how they synergistically regulate each other in the pathological mechanism of HIRI remains unclear. Herein, we rationally designed and successfully synthesized a dual-color and dual-reversible molecular fluorescent probe (UDP) for dynamic and simultaneous visualization of O2- and ATP in real-time, and uncovered their interrelationship and synergy in HIRI. UDP featured excellent sensitivity, selectivity, and reversibility in response to O2- and ATP, which rendered UDP suitable for detecting O2- and ATP and generating independent responses in the blue and red fluorescence channels without spectral crosstalk. Notably, in situ imaging with UDP revealed for the first time synchronous O2- bursts and ATP depletion in hepatocytes and mouse livers during the process of HIRI. Surprisingly, a slight increase in ATP was observed during reperfusion. More importantly, intracellular O2-─succinate dehydrogenase (SDH)─mitochondrial (Mito) reduced nicotinamide adenine dinucleotide (NADH)─Mito ATP─intracellular ATP cascade signaling pathway in the HIRI process was unveiled which illustrated the correlation between O2- and ATP for the first time. This research confirms the potential of UDP for the dynamic monitoring of HIRI and provides a clear illustration of HIRI pathogenesis.


Conflict of interest statement

The authors declare no competing financial interest.

Figures

Figure 1
Figure 1
Structure and optical properties of UDP. (A) Luminescence reversible mechanisms of UDP in response to O2 and ATP. (B) Fluorescence spectra of UDP (25 μM) after incubation with different concentrations of O2 (0–65 μM) in PBS buffer solutions (10 mM, pH = 7.4) after 5 min. (C) Fluorescence intensity at 470 nm of UDP (25 μM) as a function of O2 level. (D) Selectivity of UDP to common interfering substances (1–19: Blank, 1 mM Cys, 1 mM GSH, 1 mM Hcy, 10 mM K+, 10 mM Na+, 200 μM Ca2+, 200 μM Mg2+, 200 μM Cu2+, 200 μM Fe3+, 50 μM NO, 100 μΜ OH, 10 mM H2O2, 100 μM 1O2, 100 μΜ TBHP, 100 μΜ ROO, 100 μM NaClO, 25 μM ONOO, and 65 μM O2) in the O2 channel. (E) Fluorescence spectra of UDP (25 μM) after incubation with different concentrations of ATP (0–22 mM) in PBS buffer solutions (10 mM, pH = 7.4) after 25 min. (F) Fluorescence intensity at 588 nm of UDP (25 μM) as a function of ATP level. (G) Selectivity of UDP to common interfering substances (1–19: Blank, 1 mM Cys, 1 mM GSH, 10 mM K+, 10 mM Na+, 200 μM Ca2+, 200 μM Mg2+, 200 μM Zn2+, 10 mM PO43–, 10 mM HPO42–, 10 mM H2PO4, 10 mM SO42–, 10 mM CO32–, 10 mΜ UTP, 10 mΜ CTP, 10 mM GTP, 10 mM AMP, 10 mM ADP, and 10 mM ATP) in ATP channel. λex = 380 nm for O2. λex = 520 nm for ATP.
Figure 2
Figure 2
Reversibility, spectral crosstalk and biotoxicity evaluation of UDP. (A) Reversible response cycle for blue fluorescence of UDP (25 μM) with the addition of O2 (65 μM) and GSH (200 μM). λex/em = 380/470 nm. (B) In the presence of 22 mM ATP, fluorescence spectra of UDP (25 μM) after addition of different concentrations of O2 (0–65 μM) in the O2 channel. Inset: fluorescence spectra of UDP before and after adding 22 mM ATP in the O2 channel. λex = 380 nm. (C) Absorption spectra of UDP (25 μM) before and after reaction with 65 μM O2 and 22 mM ATP. (D) Reversible response cycle for red fluorescence of UDP (25 μM) with the addition of ATP (22 mM) and apyrase (1 U/N). λex/em = 520/588 nm. (E) In the presence of 65 μM O2, fluorescence spectra of UDP (25 μM) after addition of different concentrations of ATP (0–22 mM) in the ATP channel. Inset: fluorescence spectra of UDP before and after adding of 65 μM O2 and the subsequent addition of 100 μM, 200 μM ATP in ATP channel. λex = 520 nm. (F) Cell viability of HL-7702 cells after incubation with different concentrations of UDP (0–10–3 M).
Figure 3
Figure 3
Confocal fluorescence imaging of O2 and ATP fluctuations in hepatocytes stimulated by 2-ME or oligomycin A. (A) Confocal fluorescence images of O2 (blue channel, λex = 405 nm, λem = 420–490 nm) and ATP (red channel, λex = 514 nm, λem = 525–668 nm) in hepatocytes by UDP staining (40 μM, 20 min) after incubation of 2-ME (3 μg/mL, 1 h) and Tiron (10 μM, 1 h). (B) Confocal fluorescence images of O2 (blue channel, λex = 405 nm, λem = 420–490 nm) and ATP (red channel, λex = 514 nm, λem = 525–668 nm) in hepatocytes by UDP staining (40 μM, 20 min) after incubation of oligomycin A (50 μM, 1 h) and ATP (10 mM, 1 h). (C, D) Relative blue and red fluorescence intensity output of (A) and (B), respectively. The blue fluorescence intensity of control group was defined as 1. The data are expressed as the mean ± SD. ***P < 0.001. Concordant results were obtained from five independent experiments.
Figure 4
Figure 4
Dynamic visualization of O2 and ATP fluctuations in hepatocytes during the whole process of HIRI and effect of intervention by HIRI drug NAC. (A) Fluorescence imaging of O2 (blue channel, λex = 405 nm, λem = 420–490 nm) and ATP (red channel, λex = 514 nm, λem = 525–668 nm) by UDP (40 μM) in hepatocytes undergoing 0, 20, or 40 min of ischemia and 20 or 40 min of reperfusion after 40 min of ischemia, and pretreatment with 0.5 or 1 mM NAC. (B, C) Relative blue and red fluorescence intensity output of (A). The blue fluorescence intensity of control group was defined as 1. (D) Relative ROS levels in different phases of HIRI by ROS content assay kit. (E) ATP levels in different phases of HIRI by the ATP content assay kit. The data are expressed as the mean ± SD. ***P < 0.001. Concordant results were obtained from five independent experiments.
Figure 5
Figure 5
Real-time visualization of O2 and ATP dynamics in mouse livers during HIRI. (A) Procedure diagram. (B) Fluorescence imaging of O2 (blue channel, λex = 405 nm, λem = 420–490 nm) and ATP (red channel, λex = 514 nm, λem = 525–668 nm) by UDP (100 μM) in mouse livers undergoing 0, 20, or 40 min of ischemia and 20 or 40 min of reperfusion after 40 min of ischemia. (C, D) Relative blue and red fluorescence intensity output of (B). The blue fluorescence intensity of the control group was defined as 1. (E) H&E staining of heart, spleen, kidney, lung, and liver in control and HIRI mice. The data are expressed as the mean ± SD. ***P < 0.001. Concordant results were obtained from five independent experiments.
Figure 6
Figure 6
Proteomic analysis of the reaction of SDH with O2 through LC–MS/MS. (A) Oxidation of C68, M71. (B) Oxidation of W47. (C) Oxidation of H57. (D) Oxidation of W218. Residues represented by * and red color are modification sites by O2.
Figure 7
Figure 7
Potential signaling pathways involving O2 and ATP in HIRI. (A) SDH activity assays in hepatocytes under different treatments. (B, C) Analyses of mitochondrial NADH contents in hepatocytes under various treatments. (D) Mitochondrial ATP contents analyses of hepatocytes in different treatment groups. (E) Fluorescence imaging of ATP (red channel, λex = 514 nm, λem = 525–668 nm) in hepatocytes by UDP under the incubation of 3-NPA. (F) Relative red fluorescence intensity output of (E). (G) Intracellular ATP contents analyses of hepatocytes in different treatment groups. (H) Schematic of intracellular O2—SDH—Mito NADH—Mito ATP—intracellular ATP cascade signaling pathway during HIRI.

Similar articles

Cited by

References

    1. Li J.; Li R.; Lv G.; Liu H. The mechanisms and strategies to protect from hepatic ischemia-reperfusion injury. Eur. Rev. Med. Pharmacol. Sci. 2015, 19, 2036–2047. - PubMed
    1. Song D.; Li C.; Zhu M.; Chi S.; Liu Z. Tracking Hepatic Ischemia-Reperfusion Injury in Real Time with a Reversible NIR-IIb Fluorescent Redox Probe. Angew. Chem., Int. Ed. 2022, 61, e20221272110.1002/anie.202212721. - DOI - PubMed
    1. Nastos C.; Kalimeris K.; Papoutsidakis N.; Tasoulis M.-K.; Lykoudis P. M.; Theodoraki K.; Nastou D.; Smyrniotis V.; Arkadopoulos N. Global Consequences of Liver Ischemia/Reperfusion Injury. Oxid. Med. Cell. Longev. 2014, 2014, 90696510.1155/2014/906965. - DOI - PMC - PubMed
    1. Huang J.; Xian S.; Liu Y.; Chen X.; Pu K.; Wang H. A Renally Clearable Activatable Polymeric Nanoprobe for Early Detection of Hepatic Ischemia-Reperfusion Injury. Adv. Mater. 2022, 34, 220135710.1002/adma.202201357. - DOI - PubMed
    1. Wu H.; Xia F.; Zhang L.; Fang C.; Lee J.; Gong L.; Gao J.; Ling D.; Li F. A ROS-Sensitive Nanozyme-Augmented Photoacoustic Nanoprobe for Early Diagnosis and Therapy of Acute Liver Failure. Adv. Mater. 2022, 34, 210834810.1002/adma.202108348. - DOI - PubMed

Publication types