. 2023 Sep 28;89(9):e0082623.
doi: 10.1128/aem.00826-23. Epub 2023 Sep 1.

Mechanistic insights into sulfur source-driven physiological responses and metabolic reorganization in the fuel-biodesulfurizing Rhodococcus qingshengii IGTS8

Affiliations

Mechanistic insights into sulfur source-driven physiological responses and metabolic reorganization in the fuel-biodesulfurizing Rhodococcus qingshengii IGTS8

Julie Zumsteg et al. Appl Environ Microbiol. .

Abstract

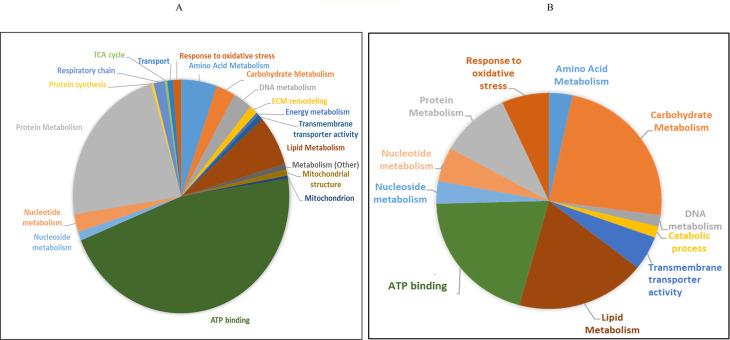
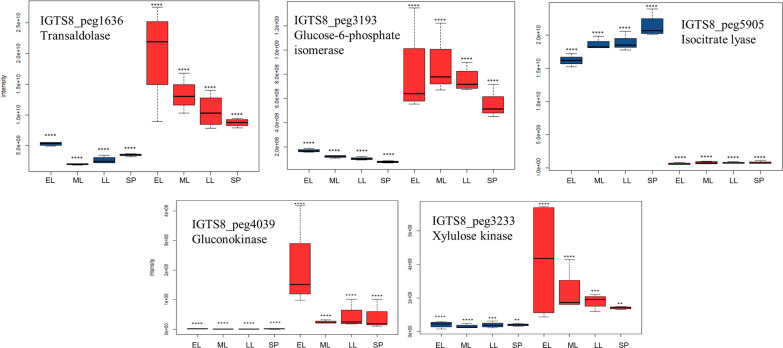
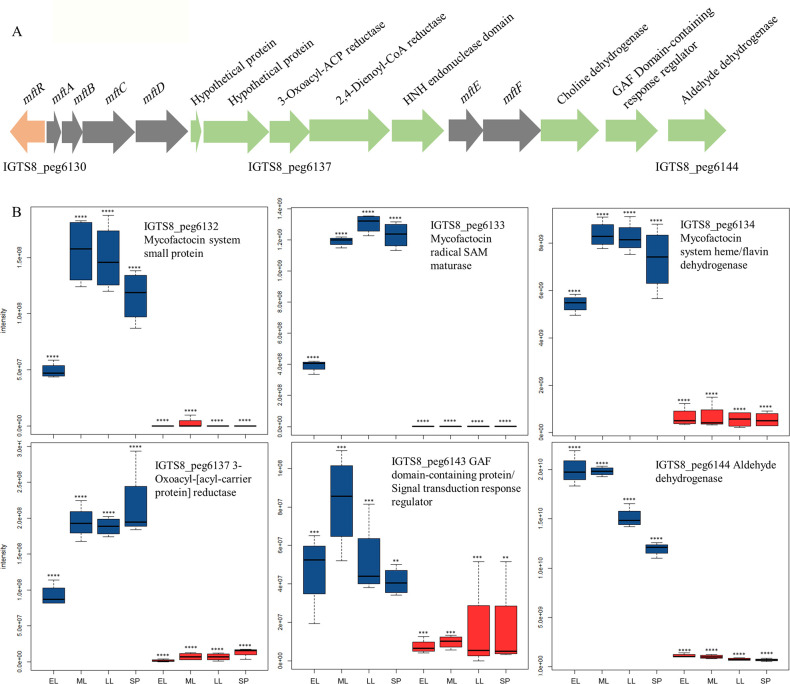
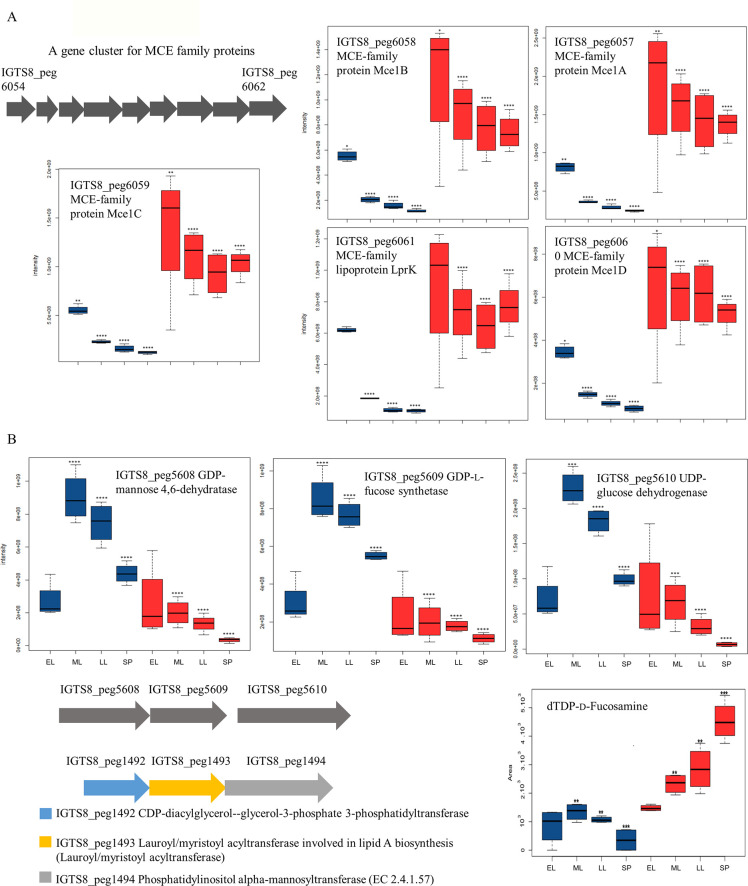
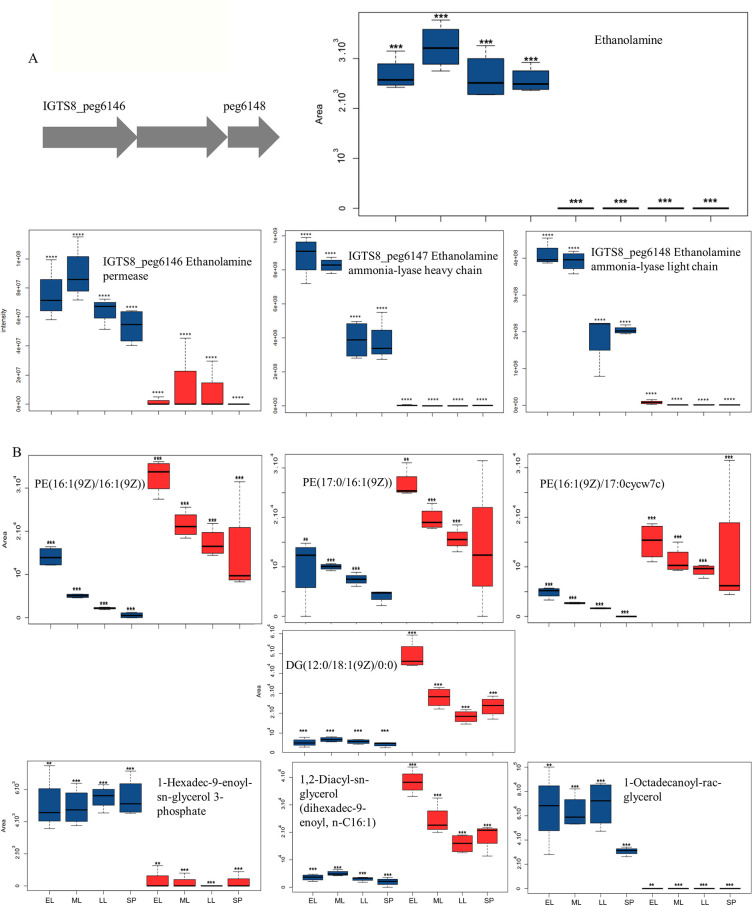
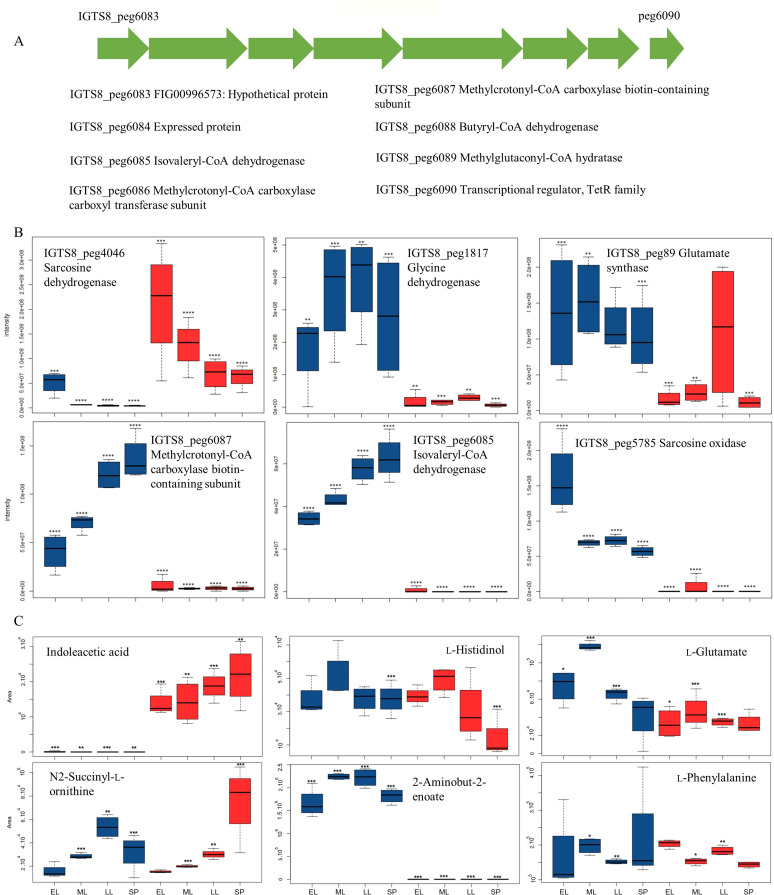
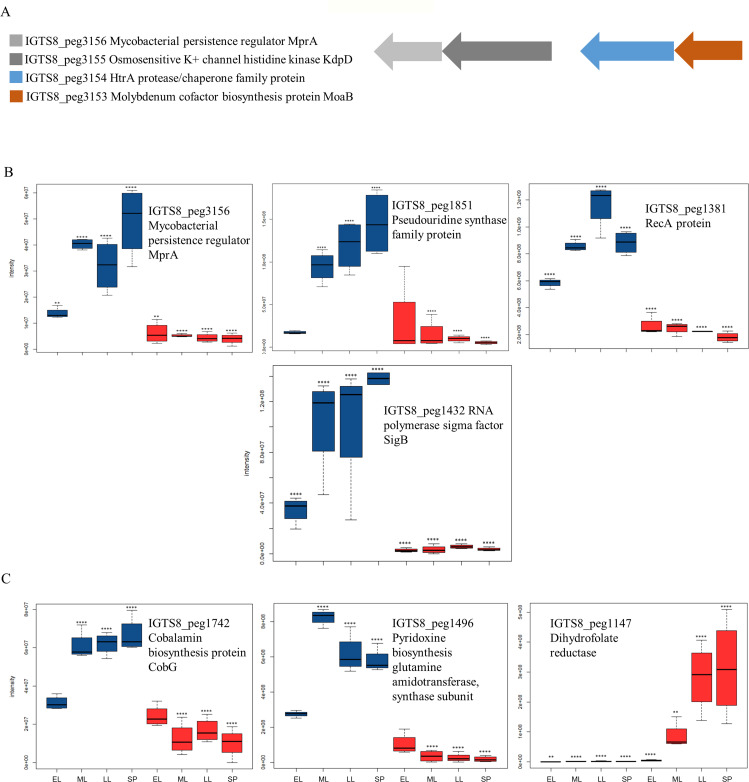
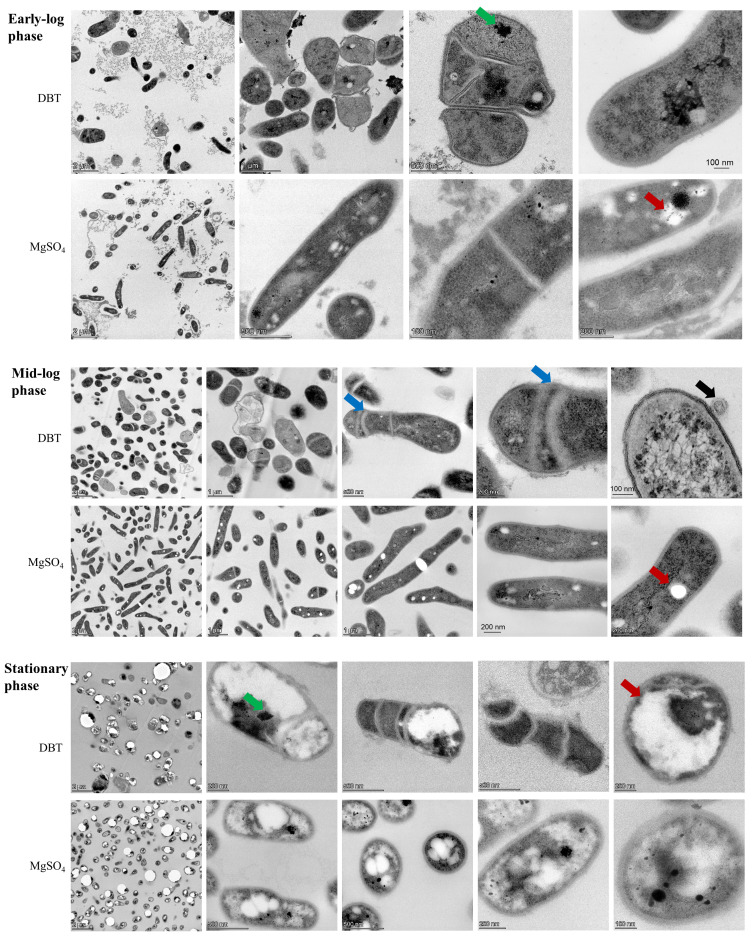
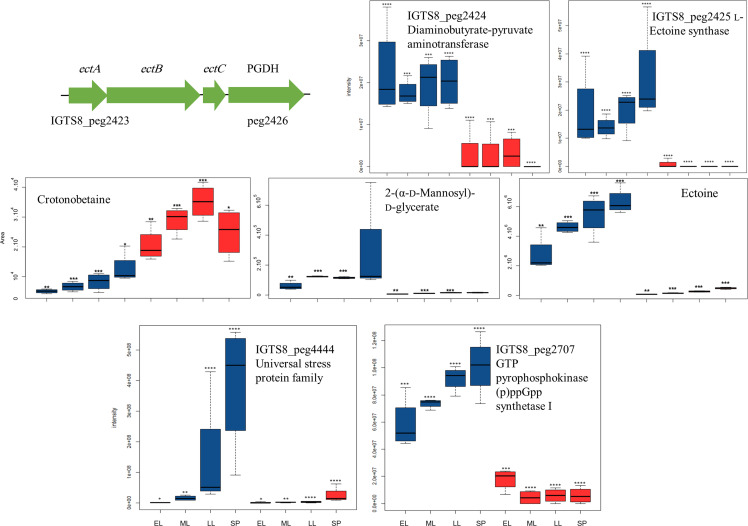
Comparative proteomics and untargeted metabolomics were combined to study the physiological and metabolic adaptations of Rhodococcus qingshengii IGTS8 under biodesulfurization conditions. After growth in a chemically defined medium with either dibenzothiophene (DBT) or MgSO4 as the sulfur source, many differentially produced proteins and metabolites associated with several metabolic and physiological processes were detected including the metabolism of carbohydrates, amino acids, lipids, nucleotides, vitamins, protein synthesis, transcriptional regulation, cell envelope biogenesis, and cell division. Increased production of the redox cofactor mycofactocin and associated proteins was one of the most striking adaptations under biodesulfurization conditions. While most central metabolic enzymes were less abundant in the presence of DBT, a key enzyme of the glyoxylate shunt, isocitrate lyase, was up to 26-fold more abundant. Several C1 metabolism and oligotrophy-related enzymes were significantly more abundant in the biodesulfurizing culture. R. qingshengii IGTS8 exhibited oligotrophic growth in liquid and solid media under carbon starvation. Moreover, the oligotrophic growth was faster on the solid medium in the presence of DBT compared to MgSO4 cultures. In the DBT culture, the cell envelope and phospholipids were remodeled, with lower levels of phosphatidylethanolamine and unsaturated and short-chain fatty acids being the most prominent changes. Biodesulfurization increased the biosynthesis of osmoprotectants (ectoine and mannosylglycerate) as well as glutamate and induced the stringent response. Our findings reveal highly diverse and overlapping stress responses that could protect the biodesulfurizing culture not only from the associated sulfate limitation but also from chemical, oxidative, and osmotic stress, allowing efficient resource management. IMPORTANCE Despite decades of research, a commercially viable bioprocess for fuel desulfurization has not been developed yet. This is mainly due to lack of knowledge of the physiology and metabolism of fuel-biodesulfurizing bacteria. Being a stressful condition, biodesulfurization could provoke several stress responses that are not understood. This is particularly important because a thorough understanding of the microbial stress response is essential for the development of environmentally friendly and industrially efficient microbial biocatalysts. Our comparative systems biology studies provide a mechanistic understanding of the biology of biodesulfurization, which is crucial for informed developments through the rational design of recombinant biodesulfurizers and optimization of the bioprocess conditions. Our findings enhance the understanding of the physiology, metabolism, and stress response not only in biodesulfurizing bacteria but also in rhodococci, a precious group of biotechnologically important bacteria.

Keywords: Rhodococcus; comparative proteomics; lipid metabolism; metabolomics; mycofactocin; oligotrophy; stress response.


Conflict of interest statement

The authors declare no conflict of interest.

Figures

Fig 1
Fig 1
Functional classification of differentially produced proteins in R. qingshengii IGTS8 during the mid-log phase. (A) Proteins upregulated in the DBT culture. (B) Proteins downregulated in the DBT culture. The names of the protein functional categories are generic terms according to the Gene Ontology database. Therefore, the same functional category can be found in the upregulated and downregulated protein groups, which refer to different proteins belonging to the same category. ECM: extracellular matrix (molecular function of this category is metal ion binding).
Fig 2
Fig 2
Boxplots of the label-free quantification (LFQ) values showing the abundance profile of some central metabolism proteins in the dibenzothiophene (DBT, in blue) and inorganic sulfate (MgSO4, IS, in red) cultures. To show the distribution of the samples, all of them were considered (this applies to all subsequent figures). The growth phases are abbreviated as EL (early-log), ML (mid-log), LL (late-log), and SP (stationary phase). Significance is attested by a Limma moderated t-test as follows: no * P > 0.05, *P ≤ 0.05, **P ≤ 0.01, ***P ≤ 0.001, ****P ≤ 0.0001.
Fig 3
Fig 3
(A) A gene cluster encoding the mycofactocin system (gray arrows) and associated proteins (green arrows) in R. qingshengii IGTS8. (B) Boxplots of the label-free quantification (LFQ) values showing the abundance profile of the mycofactocin system and associated proteins in the dibenzothiophene (DBT, in blue) and inorganic sulfate (MgSO4, IS, in red) cultures. The growth phases are abbreviated as EL (early-log), ML (mid-log), LL (late-log), and SP (stationary phase). Significance is attested by a Limma moderated t-test as follows: no * P > 0.05, *P ≤ 0.05, **P ≤ 0.01, ***P ≤ 0.001, ****P ≤ 0.0001.
Fig 4
Fig 4
Boxplots of the label-free quantification (LFQ) values showing the abundance profile of cell surface (MCE family) (A) and cell envelope biogenesis proteins (B), as well as related metabolites and gene clusters, in the dibenzothiophene (DBT, in blue) and inorganic sulfate (MgSO4, IS, in red) cultures. The growth phases are abbreviated as EL (early-log), ML (mid-log), LL (late-log), and SP (stationary phase). Significance is attested by a Limma moderated t-test as follows: no * P > 0.05, *P ≤ 0.05, **P ≤ 0.01, ***P ≤ 0.001, ****P ≤ 0.0001.
Fig 5
Fig 5
(A) A gene cluster encoding proteins of ethanolamine utilization and boxplots of the label-free quantification (LFQ) values showing the abundance profile of ethanolamine and ethanolamine ammonia lyase and (B) metabolites of lipid metabolism (PEs and acylglycerols) in the dibenzothiophene (DBT, in blue) and inorganic sulfate (MgSO4, IS, in red) cultures. The growth phases are abbreviated as EL (early-log), ML (mid-log), LL (late-log), and SP (stationary phase). Significance is attested by a Limma moderated t-test as follows: no * P > 0.05, *P ≤ 0.05, **P ≤ 0.01, ***P ≤ 0.001, ****P ≤ 0.0001.
Fig 6
Fig 6
(A) A gene cluster encoding proteins of valine/leucine/isoleucine degradation. (B) Boxplots of the label-free quantification (LFQ) values showing the abundance of the profile of amino acid metabolism proteins and (C) metabolites in the dibenzothiophene (DBT, in blue) and inorganic sulfate (MgSO4, IS, in red) cultures. The growth phases are abbreviated as EL (early-log), ML (mid-log), LL (late-log), and SP (stationary phase). Significance is attested by a Limma moderated t-test as follows: no * P > 0.05, *P ≤ 0.05, **P ≤ 0.01, ***P ≤ 0.001, ****P ≤ 0.0001.
Fig 7
Fig 7
(A) Gene cluster encoding the mycobacterial persistence regulator. (B) Boxplots of the label-free quantification (LFQ) values showing the abundance profile of proteins involved in genetic information processing, and (C) vitamin and cofactor metabolism in the dibenzothiophene (DBT, in blue) and inorganic sulfate (MgSO4, IS, in red) cultures. The growth phases are abbreviated as EL (early-log), ML (mid-log), LL (late-log), and SP (stationary phase). Significance is attested by a Limma moderated t-test as follows: no * P > 0.05, *P ≤ 0.05, **P ≤ 0.01, ***P ≤ 0.001, ****P ≤ 0.0001.
Fig 8
Fig 8
TEM images of the DBT and MgSO4 cultures of R. qingshengii IGTS8 at different growth phases. Green arrows: electron-dense inclusions, red arrows: electron-transparent inclusions, blue arrows: multiple division septa, and black arrow: cell-surface-associated vesicles or extensions.
Fig 9
Fig 9
A gene cluster encoding ectoine biosynthesis proteins and boxplots of the label-free quantification (LFQ) values showing the abundance profile of some ectoine biosynthesis and stress response proteins, as well as osmoprotectants in the dibenzothiophene (DBT, in blue) and inorganic sulfate (MgSO4, IS, in red) cultures. The growth phases are abbreviated as EL (early-log), ML (mid-log), LL (late-log), and SP (stationary phase). Significance is attested by a Limma moderated t-test as follows: no * P > 0.05, *P ≤ 0.05, **P ≤ 0.01, ***P ≤ 0.001, ****P ≤ 0.0001. PGDH: phosphoglycerate dehydrogenase.

Similar articles

Cited by

References

    1. Kilbane JJ. 1990. Sulfur-specific microbial metabolism of organic compounds. Resour Conserv Recycl 3:69–79. doi:10.1016/0921-3449(90)90046-7 - DOI
    1. Kilbane JJ, Bielaga B. 1990. Toward sulfur-free fuels. Chemtech 20:747–751.
    1. Denome SA, Olson ES, Young KD. 1993. Identification and cloning of genes involved in specific desulfurization of dibenzothiophene by Rhodococcus sp. strain IGTS8. Appl Environ Microbiol 59:2837–2843. doi:10.1128/aem.59.9.2837-2843.1993 - DOI - PMC - PubMed
    1. Kilbane JJ. 2006. Microbial biocatalyst developments to upgrade fossil fuels. Curr Opin Biotechnol 17:305–314. doi:10.1016/j.copbio.2006.04.005 - DOI - PubMed
    1. Chen S, Zhao C, Liu Q, Zang M, Liu C, Zhang Y. 2018. Thermophilic biodesulfurization and its application in oil desulfurization. Appl Microbiol Biotechnol 102:9089–9103. doi:10.1007/s00253-018-9342-5 - DOI - PubMed

LinkOut - more resources