

The regulator FleQ both transcriptionally and post-transcriptionally regulates the level of RTX adhesins of Pseudomonas fluorescens
- PMID: 37655913
- PMCID: PMC10521353
- DOI: 10.1128/jb.00152-23
The regulator FleQ both transcriptionally and post-transcriptionally regulates the level of RTX adhesins of Pseudomonas fluorescens
Abstract
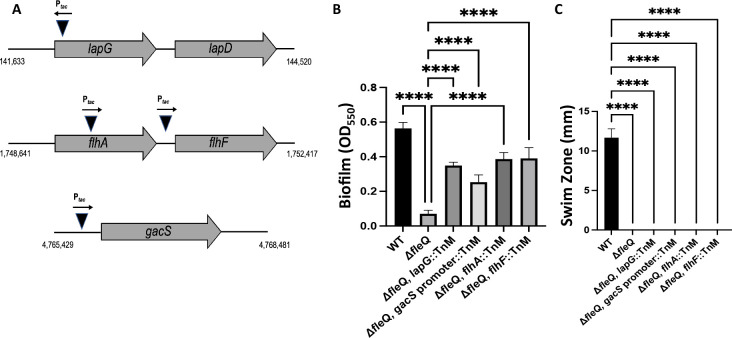
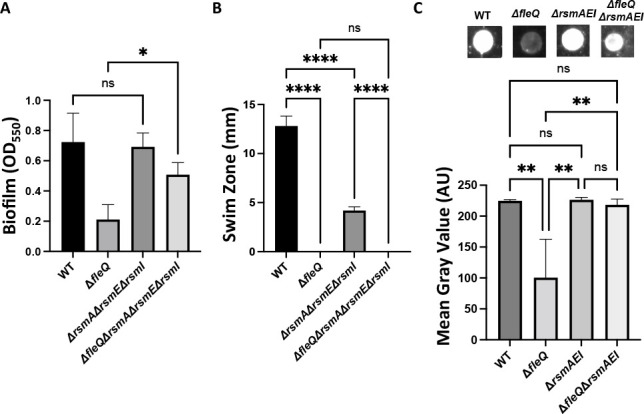
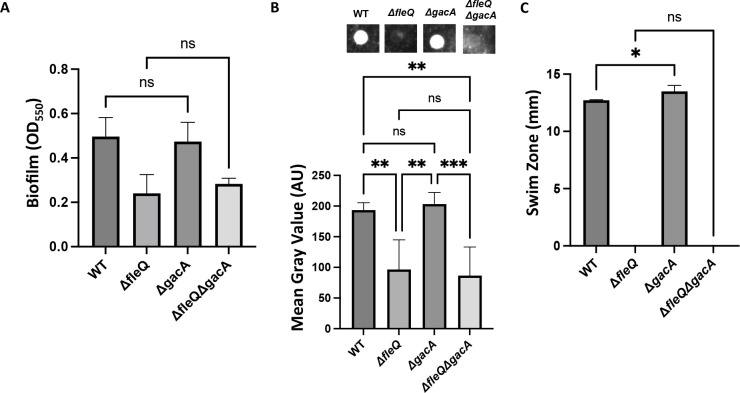
Biofilm formation by the Gram-negative, Gammaproteobacteria Pseudomonas fluorescens relies on the repeats-in-toxin adhesins LapA and MapA in the cytoplasm, secretion of these adhesins through their respective type 1 secretion systems, and retention at the cell surface. Published work has shown that retention of the adhesins occurs via a post-translational mechanism involving the cyclic-di-GMP receptor LapD and the protease LapG. However, little is known about the underlying mechanisms that regulate the level of these adhesins. Here, we demonstrate that the master regulator FleQ modulates biofilm formation by both transcriptionally and post-transcriptionally regulating LapA and MapA. We find that a ΔfleQ mutant has a biofilm formation defect compared to the wild-type (WT) strain, which is attributed in part to a decrease in LapA and MapA abundance in the cell, despite the ΔfleQ mutant having increased levels of lapA and mapA transcripts compared to the WT strain. Through transposon mutagenesis and subsequent genetic analysis, we found that overstimulation of the Gac/Rsm pathway partially rescues biofilm formation in the ΔfleQ mutant background. Collectively, these findings provide evidence that FleQ regulates biofilm formation by both transcriptionally regulating the expression of the lapA and mapA genes and post-transcriptionally regulating the abundance of LapA and MapA, and that activation of the Gac/Rsm pathway can post-transcriptionally enhance biofilm formation by P. fluorescens. IMPORTANCE Biofilm formation is a highly coordinated process that bacteria undergo to colonize a variety of surfaces. For Pseudomonas fluorescens, biofilm formation requires the production and localization of repeats-in-toxin adhesins to the cell surface. To date, little is known about the underlying mechanisms that regulate biofilm formation by P. fluorescens. Here, we identify FleQ as a key regulator of biofilm formation that modulates both gene expression and abundance of LapA and MapA through both a transcriptional and post-transcriptional mechanism. We provide further evidence implicating activation of the Gac/Rsm system in FleQ-dependent regulation of biofilm formation. Together, our findings uncover evidence for a dual mechanism of transcriptional and post-transcriptional regulation of the LapA and MapA adhesins.
Keywords: Pseudomonas fluorescens; RTX adhesins; biofilm; regulation.
Conflict of interest statement
The authors declare no conflict of interest.
Figures


Update of
-
The Regulator FleQ Post-Transcriptionally Regulates the Production of RTX Adhesins by Pseudomonas fluorescens.bioRxiv [Preprint]. 2023 May 9:2023.05.09.540025. doi: 10.1101/2023.05.09.540025. bioRxiv. 2023. Update in: J Bacteriol. 2023 Sep 26;205(9):e0015223. doi: 10.1128/jb.00152-23. PMID: 37214974 Free PMC article. Updated. Preprint.
Similar articles
-
The Regulator FleQ Post-Transcriptionally Regulates the Production of RTX Adhesins by Pseudomonas fluorescens.bioRxiv [Preprint]. 2023 May 9:2023.05.09.540025. doi: 10.1101/2023.05.09.540025. bioRxiv. 2023. Update in: J Bacteriol. 2023 Sep 26;205(9):e0015223. doi: 10.1128/jb.00152-23. PMID: 37214974 Free PMC article. Updated. Preprint.
-
MapA, a Second Large RTX Adhesin Conserved across the Pseudomonads, Contributes to Biofilm Formation by Pseudomonas fluorescens.J Bacteriol. 2020 Aug 25;202(18):e00277-20. doi: 10.1128/JB.00277-20. Print 2020 Aug 25. J Bacteriol. 2020. PMID: 32631946 Free PMC article.
-
From Input to Output: The Lap/c-di-GMP Biofilm Regulatory Circuit.Annu Rev Microbiol. 2020 Sep 8;74:607-631. doi: 10.1146/annurev-micro-011520-094214. Epub 2020 Jul 20. Annu Rev Microbiol. 2020. PMID: 32689917 Free PMC article. Review.
-
An N-Terminal Retention Module Anchors the Giant Adhesin LapA of Pseudomonas fluorescens at the Cell Surface: a Novel Subfamily of Type I Secretion Systems.J Bacteriol. 2018 Mar 26;200(8):e00734-17. doi: 10.1128/JB.00734-17. Print 2018 Apr 15. J Bacteriol. 2018. PMID: 29437852 Free PMC article.
-
Type 1 Does the Two-Step: Type 1 Secretion Substrates with a Functional Periplasmic Intermediate.J Bacteriol. 2018 Aug 24;200(18):e00168-18. doi: 10.1128/JB.00168-18. Print 2018 Sep 15. J Bacteriol. 2018. PMID: 29866808 Free PMC article. Review.
Cited by
-
Multiple pathways impact the swarming motility of Pseudomonas fluorescens Pf0-1.Microbiol Spectr. 2024 Jun 4;12(6):e0016624. doi: 10.1128/spectrum.00166-24. Epub 2024 Apr 30. Microbiol Spectr. 2024. PMID: 38687073 Free PMC article.
-
Suppression of Pseudomonas aeruginosa type III secretion system by a novel calcium-responsive signaling pathway.iScience. 2024 Apr 9;27(5):109690. doi: 10.1016/j.isci.2024.109690. eCollection 2024 May 17. iScience. 2024. PMID: 38660402 Free PMC article.
-
Multiple Pathways Impact Swarming Motility of Pseudomonas fluorescens Pf0-1.bioRxiv [Preprint]. 2024 Jan 18:2024.01.17.576057. doi: 10.1101/2024.01.17.576057. bioRxiv. 2024. Update in: Microbiol Spectr. 2024 Jun 4;12(6):e0016624. doi: 10.1128/spectrum.00166-24. PMID: 38293239 Free PMC article. Updated. Preprint.
-
Drag reduction and degradation by sodium alginate in turbulent flow.Sci Rep. 2024 Jul 22;14(1):16854. doi: 10.1038/s41598-024-67873-2. Sci Rep. 2024. PMID: 39039150 Free PMC article.
References
-
- Paulsen IT, Press CM, Ravel J, Kobayashi DY, Myers GSA, Mavrodi DV, DeBoy RT, Seshadri R, Ren Q, Madupu R, Dodson RJ, Durkin AS, Brinkac LM, Daugherty SC, Sullivan SA, Rosovitz MJ, Gwinn ML, Zhou L, Schneider DJ, Cartinhour SW, Nelson WC, Weidman J, Watkins K, Tran K, Khouri H, Pierson EA, Pierson LS, Thomashow LS, Loper JE. 2005. Complete genome sequence of the plant commensal Pseudomonas fluorescens Pf-5. Nat Biotechnol 23:873–878. doi:10.1038/nbt1110 - DOI - PMC - PubMed
-
- Howell CR. 1979. Control of Rhizoctonia solani on cotton seedlings with Pseudomonas fluorescens and with an antibiotic produced by the bacterium. Phytopathology 69:480. doi:10.1094/Phyto-69-480 - DOI
-
- Keel C. 1992. Suppression of root diseases by Pseudomonas fluorescens CHA0: importance of the bacterial secondary metabolite 2,4-diacetylphloroglucinol. MPMI 5:4. doi:10.1094/MPMI-5-004 - DOI
Publication types
MeSH terms
Substances
Grants and funding
LinkOut - more resources
Full Text Sources
