. 2023 Dec 12;13(12):2548-2565.
doi: 10.1158/2159-8290.CD-23-0453.

Structural Basis of PML-RARA Oncoprotein Targeting by Arsenic Unravels a Cysteine Rheostat Controlling PML Body Assembly and Function

Affiliations

Structural Basis of PML-RARA Oncoprotein Targeting by Arsenic Unravels a Cysteine Rheostat Controlling PML Body Assembly and Function

Pierre Bercier et al. Cancer Discov. .

Abstract

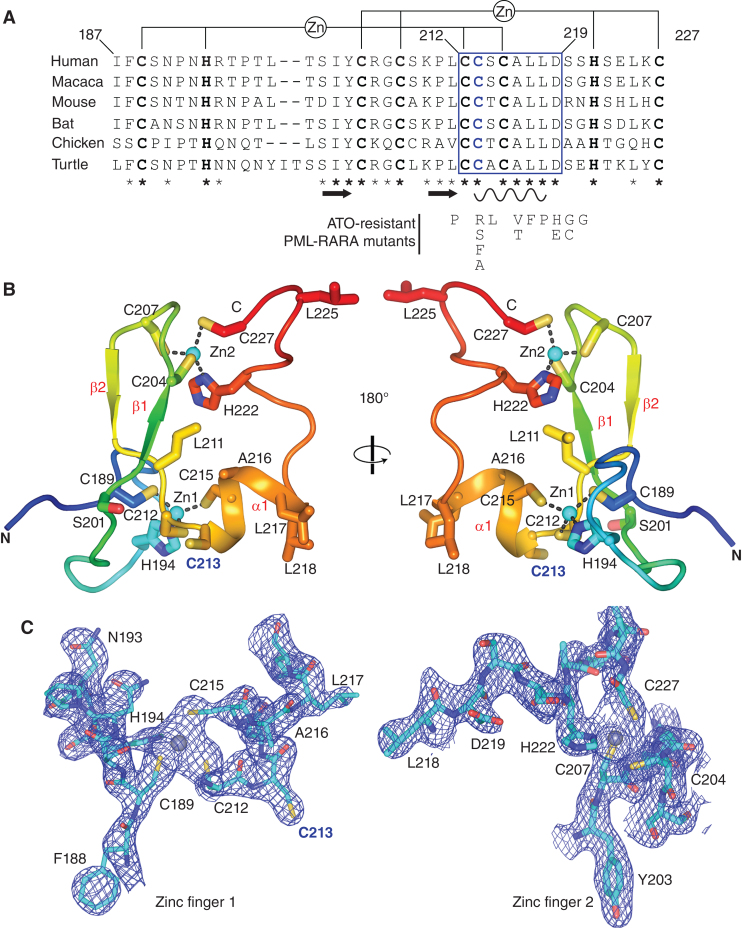
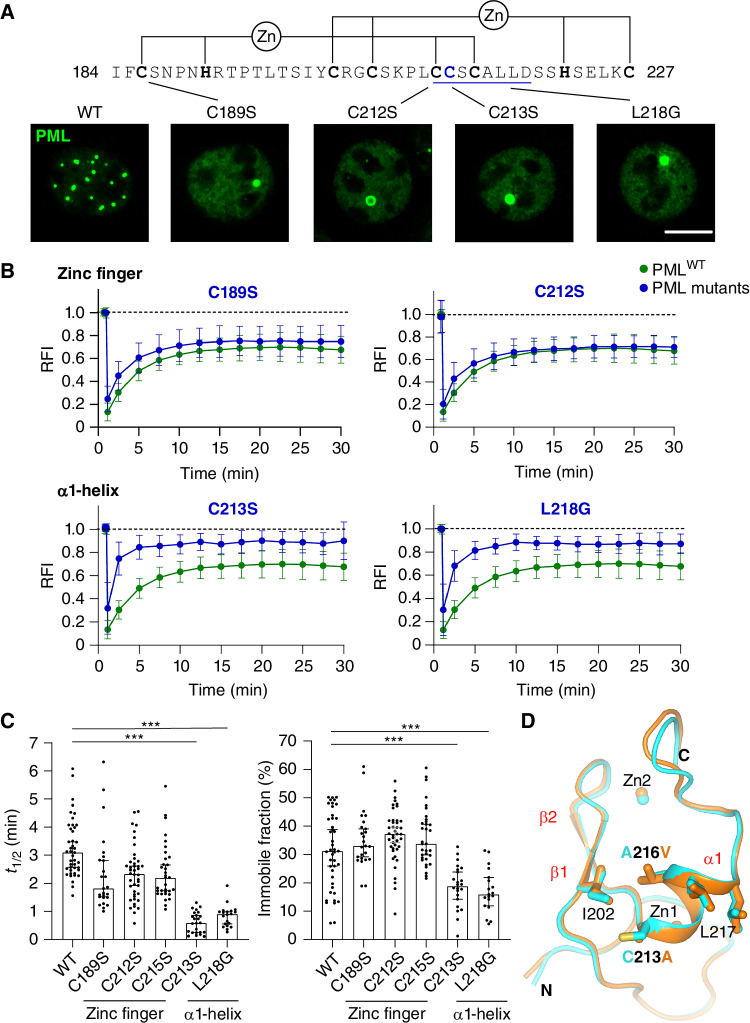
PML nuclear bodies (NB) are disrupted in PML-RARA-driven acute promyelocytic leukemia (APL). Arsenic trioxide (ATO) cures 70% of patients with APL, driving PML-RARA degradation and NB reformation. In non-APL cells, arsenic binding onto PML also amplifies NB formation. Yet, the actual molecular mechanism(s) involved remain(s) elusive. Here, we establish that PML NBs display some features of liquid-liquid phase separation and that ATO induces a gel-like transition. PML B-box-2 structure reveals an alpha helix driving B2 trimerization and positioning a cysteine trio to form an ideal arsenic-binding pocket. Altering either of the latter impedes ATO-driven NB assembly, PML sumoylation, and PML-RARA degradation, mechanistically explaining clinical ATO resistance. This B2 trimer and the C213 trio create an oxidation-sensitive rheostat that controls PML NB assembly dynamics and downstream signaling in both basal state and during stress response. These findings identify the structural basis for arsenic targeting of PML that could pave the way to novel cancer drugs.

Significance: Arsenic curative effects in APL rely on PML targeting. We report a PML B-box-2 structure that drives trimer assembly, positioning a cysteine trio to form an arsenic-binding pocket, which is disrupted in resistant patients. Identification of this ROS-sensitive triad controlling PML dynamics and functions could yield novel drugs. See related commentary by Salomoni, p. 2505. This article is featured in Selected Articles from This Issue, p. 2489.


Figures

Figure 1. PML NBs display hallmarks of LLPS and switch to gel-like features upon ATO exposure. A, STED analysis uncovers the typical spherical core-shell PML NB. Scale bar, 1 μm. B, Time-lapse analysis of PML NB apparition upon GFP-PMLWT expression in PmlKO MEFs. The white circle indicates the nucleus. Representative data from three independent experiments. Scale bar, 5 μm. C, PML NBs undergo fusion with spherical relaxation, similar to liquid-like droplets. Representative time-lapse of PML NB fusion (left) and quantification of effective viscosity (right). Mean values ± SD of n = 21 fusion events in independent cells from three independent experiments. Scale bar, 1 μm. D, Quantification of PML NB nucleation, fusion, and fission events over 1 hour. Mean value ± SD of n = 37 cells from five independent experiments. E, FRAP analyses of GFP-PMLWT dynamics at NBs in control (Ctrl) or ATO-treated MEFs (1 μmol/L, 30 minutes). Mean value ± SD. Number of NBs assessed Ctrl (n = 36), ATO (n = 28), from at least five independent experiments. WT, wild-type. F, Confocal analysis of PML NBs in GFP-PMLWT or GFP-PML-RARA MEFs treated with 1 μmol/L of ATO for 1 hour. Scale bar, 5 μm. G, STED analysis demonstrating incomplete PML NB fusion upon ATO in PMLKO MEFs s. Scale bar, 1 μm. H, Comparison between GFP-PMLWT and GFP-PML-RARA dynamics at NBs by FRAP. ATO treatment (1 μmol/L, 30 minutes) induces a liquid- to gel-like transition of GFP-PML-RARA. Mean value ± SD. Number of dots assessed PML (n = 36), PML-RARA (n = 20), PML-RARA+ATO (n = 37), from at least five independent experiments. RFI, Relative fluorescence intensity.
Figure 1.
PML NBs display hallmarks of LLPS and switch to gel-like features upon ATO exposure. A, STED analysis uncovers the typical spherical core-shell PML NB. Scale bar, 1 μm. B, Time-lapse analysis of PML NB apparition upon GFP-PMLWT expression in PmlKO MEFs. The white circle indicates the nucleus. Representative data from three independent experiments. Scale bar, 5 μm. C, PML NBs undergo fusion with spherical relaxation, similar to liquid-like droplets. Representative time-lapse of PML NB fusion (left) and quantification of effective viscosity (right). Mean values ± SD of n = 21 fusion events in independent cells from three independent experiments. Scale bar, 1 μm. D, Quantification of PML NB nucleation, fusion, and fission events over 1 hour. Mean value ± SD of n = 37 cells from five independent experiments. E, FRAP analyses of GFP-PMLWT dynamics at NBs in control (Ctrl) or ATO-treated MEFs (1 μmol/L, 30 minutes). Mean value ± SD. Number of NBs assessed Ctrl (n = 36), ATO (n = 28), from at least five independent experiments. WT, wild-type. F, Confocal analysis of PML NBs in GFP-PMLWT or GFP-PML-RARA MEFs treated with 1 μmol/L of ATO for 1 hour. Scale bar, 5 μm. G, STED analysis demonstrating incomplete PML NB fusion upon ATO in PMLKO MEFs s. Scale bar, 1 μm. H, Comparison between GFP-PMLWT and GFP-PML-RARA dynamics at NBs by FRAP. ATO treatment (1 μmol/L, 30 minutes) induces a liquid- to gel-like transition of GFP-PML-RARA. Mean value ± SD. Number of dots assessed PML (n = 36), PML-RARA (n = 20), PML-RARA+ATO (n = 37), from at least five independent experiments. RFI, Relative fluorescence intensity.
Figure 2. PML NB assembly depends on C213 in B2 domain, but not on C389-mediated intermolecular disulfide bonds. A, Confocal analysis of PML NB formation following cysteine alkylation with NEM (10 μmol/L, 1 hour) or ATO (1 μmol/L, 1 hour) used alone or sequentially in GFP-PMLWT MEFs. Scale bar, 5 μm. Ctrl, control. B, Western blot analysis (nonreducing conditions) of PML disulfide bond formation in MEFs expressing HA-PMLWT or PML cysteine mutants, treated or not with ATO (10 μmol/L, 1 hour) or H2O2 (500 μmol/L, 1 hour). Brackets: SUMO-conjugated or intermolecular disulfide-bound PML. Blue arrowheads, intermolecular disulfide-bound PML. Molecular weight (kDa). C, Confocal analysis of PML NBs upon ATO (1 μmol/L, 1 hour) or H2O2 (500 μmol/L, 1 hour) exposure in HA-PMLWT- or cysteine mutant–expressing MEFs. Arrowheads, single NB in HA-PMLC213A-expressing MEFs. Scale bar, 5 μm.
Figure 2.
PML NB assembly depends on C213 in B2 domain, but not on C389-mediated intermolecular disulfide bonds. A, Confocal analysis of PML NB formation following cysteine alkylation with NEM (10 μmol/L, 1 hour) or ATO (1 μmol/L, 1 hour) used alone or sequentially in GFP-PMLWT MEFs. Scale bar, 5 μm. Ctrl, control. B, Western blot analysis (nonreducing conditions) of PML disulfide bond formation in MEFs expressing HA-PMLWT or PML cysteine mutants, treated or not with ATO (10 μmol/L, 1 hour) or H2O2 (500 μmol/L, 1 hour). Brackets: SUMO-conjugated or intermolecular disulfide-bound PML. Blue arrowheads, intermolecular disulfide-bound PML. Molecular weight (kDa). C, Confocal analysis of PML NBs upon ATO (1 μmol/L, 1 hour) or H2O2 (500 μmol/L, 1 hour) exposure in HA-PMLWT- or cysteine mutant–expressing MEFs. Arrowheads, single NB in HA-PMLC213A-expressing MEFs. Scale bar, 5 μm.
Figure 3. Uncovering PML B2 structure. A, Conservation of PML B2 box through evolution. Top, putative position of the two zinc fingers intertwined in a cross-brace. Bold, amino acids implicated in putative zinc coordination. The additional cysteine in position 213 is highlighted in blue. Predicted secondary structures of PML B-box-2 are depicted. Arrow, beta-sheet; loop, α1-helix; stars, evolutionary conserved amino acids (bold, identical; star custom, 1/6 variation only). The highly conserved α-helix is boxed in blue. Bottom, PML-RARA mutations from patients with therapy-resistant APL. B, Crystal structure of PML B2 monomer shown in a cartoon representation. PML B2 folds around two zinc fingers organized in a cross-brace. The C3H1 zinc coordination leaves the C213 free. Helix α1 (C213 to L218) exposes C213 toward the outside of the structure. Cyan sphere, zinc atoms; blue bold font, C213. C, Left, composite omit map contoured at 2 σ of a segment from PML B2 near zinc finger 1 at 2.1 Å. C213 appears as a free cysteine (blue bold font). Right, composite omit map contoured at 2 σ of a segment from PML B2 near zinc finger 2 at 2.1 Å. C227, not D219, coordinates Zn2+. Grey spheres, zinc atoms.
Figure 3.
Uncovering PML B2 structure. A, Conservation of PML B2 box through evolution. Top, putative position of the two zinc fingers intertwined in a cross-brace. Bold, amino acids implicated in putative zinc coordination. The additional cysteine in position 213 is highlighted in blue. Predicted secondary structures of PML B-box-2 are depicted. Arrow, beta-sheet; loop, α1-helix; stars, evolutionary conserved amino acids (bold, identical; star custom, 1/6 variation only). The highly conserved α-helix is boxed in blue. Bottom, PML-RARA mutations from patients with therapy-resistant APL. B, Crystal structure of PML B2 monomer shown in a cartoon representation. PML B2 folds around two zinc fingers organized in a cross-brace. The C3H1 zinc coordination leaves the C213 free. Helix α1 (C213 to L218) exposes C213 toward the outside of the structure. Cyan sphere, zinc atoms; blue bold font, C213. C, Left, composite omit map contoured at 2 σ of a segment from PML B2 near zinc finger 1 at 2.1 Å. C213 appears as a free cysteine (blue bold font). Right, composite omit map contoured at 2 σ of a segment from PML B2 near zinc finger 2 at 2.1 Å. C227, not D219, coordinates Zn2+. Grey spheres, zinc atoms.
Figure 4. PML B2 α1-helix controls PML assembly and dynamics. A, Representative PML NB formation in MEFs expressing PML B2 mutants in Zn2+-coordinating cysteines or α1-helix (underlined in blue) residues. Scale bar, 5 μm. B, FRAP analyses of GFP-PML dynamics at NBs in WT- or mutant-expressing MEFs. Mean value ± SD. RFI, Relative fluorescence intensity. NBs assessed PMLWT (n = 36), PMLC189S (n = 25), PMLC212S (n = 42), PMLC213S (n = 24), PMLL218G (n = 20), from at least five independent experiments. C, Plot representation of B, with t1/2 (left) and immobile fraction (right) of PML mutants harboring mutations on the α1-helix or zinc finger. Each dot represents an individual NB. Median ± 95% confidence interval, statistical significance by comparison with GFP-PMLWT, Kruskal–Wallis test. ***, P ≤ 0.001 are displayed. P value for Zn-finger mutants, C189S = 0.0097, C212S = 0.0115, C213S = 0.028. D, Superposition of PML B2 crystal structure (cyan) with that of PMLC213A/A216V mutant (orange) demonstrates absence of misfolding.
Figure 4.
PML B2 α1-helix controls PML assembly and dynamics. A, Representative PML NB formation in MEFs expressing PML B2 mutants in Zn2+-coordinating cysteines or α1-helix (underlined in blue) residues. Scale bar, 5 μm. B, FRAP analyses of GFP-PML dynamics at NBs in WT- or mutant-expressing MEFs. Mean value ± SD. RFI, Relative fluorescence intensity. NBs assessed PMLWT (n = 36), PMLC189S (n = 25), PMLC212S (n = 42), PMLC213S (n = 24), PMLL218G (n = 20), from at least five independent experiments. C, Plot representation of B, with t1/2 (left) and immobile fraction (right) of PML mutants harboring mutations on the α1-helix or zinc finger. Each dot represents an individual NB. Median ± 95% confidence interval, statistical significance by comparison with GFP-PMLWT, Kruskal–Wallis test. ***, P ≤ 0.001 are displayed. P value for Zn-finger mutants, C189S = 0.0097, C212S = 0.0115, C213S = 0.028. D, Superposition of PML B2 crystal structure (cyan) with that of PMLC213A/A216V mutant (orange) demonstrates absence of misfolding.
Figure 5. PML B2 mediates PML trimerization and is required for biological functions. A, Modeling of a PML B2 trimer. B2 monomers are colored in green, gray, and pink. Exponents refer to affiliation to a specific monomer. B, Close-up view of the PML B2 trimer model depicting hydrophobic interactions between the α1-helices. Residues involved in these hydrophobic interactions are shown in blue, linked by dashed lines. Distance between these key hydrophobic residues are in Å. C, SEC-MALs analysis showing a mix of monomeric, dimeric, and trimeric PML B2 (left) (dRI:differential refractive index, RIU:refractive index unit). The C213A mutant shifts toward monomeric and dimeric states (right). MBP-B2 molecular weight: 46.2 kDa. D, Representative PML NB formation in PML B2 mutants predicted to impair trimerization expressed in MEFs. Scale bar, 5 μm. E, GFP-PMLL218F yields filaments (left). Scale bar, 5 μm. FRAP analysis of the exchange rates of GFP-PMLL218F mutant compared with GFP-PMLWT (right). Mean value ± SD. NBs assessed PMLWT (n = 36) and PMLL218F (n = 24), from at least five independent experiments. RFI, Relative fluorescence intensity.
Figure 5.
PML B2 mediates PML trimerization and is required for biological functions. A, Modeling of a PML B2 trimer. B2 monomers are colored in green, gray, and pink. Exponents refer to affiliation to a specific monomer. B, Close-up view of the PML B2 trimer model depicting hydrophobic interactions between the α1-helices. Residues involved in these hydrophobic interactions are shown in blue, linked by dashed lines. Distance between these key hydrophobic residues are in Å. C, SEC-MALs analysis showing a mix of monomeric, dimeric, and trimeric PML B2 (left) (dRI:differential refractive index, RIU:refractive index unit). The C213A mutant shifts toward monomeric and dimeric states (right). MBP-B2 molecular weight: 46.2 kDa. D, Representative PML NB formation in PML B2 mutants predicted to impair trimerization expressed in MEFs. Scale bar, 5 μm. E, GFP-PMLL218F yields filaments (left). Scale bar, 5 μm. FRAP analysis of the exchange rates of GFP-PMLL218F mutant compared with GFP-PMLWT (right). Mean value ± SD. NBs assessed PMLWT (n = 36) and PMLL218F (n = 24), from at least five independent experiments. RFI, Relative fluorescence intensity.
Figure 6. ATO binding to B2 trimer is responsible for ATO-induced phase transition. A, Modeling of PML B2 trimer around an arsenic atom. The key C213 residues are indicated in blue and the arsenic atom is shown as an orange sphere. The predicted distance between the arsenic atom and C213 represented by the dashed line is around 2.7 Å. B, FRAP analyses of GFP-PMLWT dynamics at NBs in untreated cells or cells treated with trivalent metalloid oxides: ATO (1 μmol/L, 30 minutes) or STO (1 μmol/L, 30 minutes) or divalent arsenic (MMA, 1 μmol/L, 30 minutes). Mean value ± SD, assessed NBs control (Ctrl; n = 36), MMA (n = 21), ATO (n = 28), STO (n = 33), from at least five independent experiments. RFI, relative fluorescence intensity. C, Representative confocal analyses of PML NB formation in PmlKO MEFs stably expressing GFP-PML B2 mutants, ± ATO (1 μmol/L, 1 hour). Scale bar, 5 μm. D, FRAP analyses of GFP-PML mutant–expressing MEFs treated or not with ATO (1 μmol/L, 30 minutes). Mean value ± SD. NBs assessed PMLC212S Ctrl (n = 42), PMLC212S ATO (n = 28), PMLC213S Ctrl (n = 24), PMLC213S ATO (n = 27), PMLL218G Ctrl (n = 20), PMLL218G ATO (n = 26), PMLA216G Ctrl (n = 40), PMLA216G ATO (n = 28), PMLA216V Ctrl (n = 43), PMLA216V ATO (n = 43), PMLC213V Ctrl (n = 32), PMLC213V ATO (n = 31), from at least five independent experiments. E, Representative images of red fluorescent arsenic (ReAsH) localization to NBs in GFP-PMLWT or mutant MEFs. Scale bar, 1 μm. F, Representative PML NB formation in PML C213 mutant–expressing MEFs. Scale bar, 5 μm. G, Confocal analysis of PML NB formation following cysteine alkylation with NEM (10 μmol/L, 1 hour) in GFP-PMLWT- or PMLC213V -expressing MEFs. Scale bar, 5 μm. H, Western blot analysis of basal PML sumoylation in GFP-PMLWT- or mutant-expressing MEFs (arrowheads highlight different sumoylation levels of PML mutants). I, Western blot analysis of PML sumoylation in GFP-PMLWT or mutant MEFs treated or not with ATO (1 μmol/L, 1 hour). J, Confocal analysis of PML and Sp100 localization in GFP-PMLWT- or C213 mutant–expressing MEFs treated or not with ATO (1 μmol/L, 1 hour). Scale bar, 5 μm. K, Pulldown of HIS10-SUMO2 conjugates from PmlWT or PmlL222G mESCs treated or not with ATO (1 μmol/L, 30 minutes). ATO-treated nontransduced PmlWT mESCs are shown as controls. Western blot with anti-SUMO2/3 (left), anti-mPML (right, top), or anti-KAP1 antibodies (right, bottom). Sumoylated species are indicated. Representative data of n = 3 independent experiments.
Figure 6.
ATO binding to B2 trimer is responsible for ATO-induced phase transition. A, Modeling of PML B2 trimer around an arsenic atom. The key C213 residues are indicated in blue and the arsenic atom is shown as an orange sphere. The predicted distance between the arsenic atom and C213 represented by the dashed line is around 2.7 Å. B, FRAP analyses of GFP-PMLWT dynamics at NBs in untreated cells or cells treated with trivalent metalloid oxides: ATO (1 μmol/L, 30 minutes) or STO (1 μmol/L, 30 minutes) or divalent arsenic (MMA, 1 μmol/L, 30 minutes). Mean value ± SD, assessed NBs control (Ctrl; n = 36), MMA (n = 21), ATO (n = 28), STO (n = 33), from at least five independent experiments. RFI, relative fluorescence intensity. C, Representative confocal analyses of PML NB formation in PmlKO MEFs stably expressing GFP-PML B2 mutants, ± ATO (1 μmol/L, 1 hour). Scale bar, 5 μm. D, FRAP analyses of GFP-PML mutant–expressing MEFs treated or not with ATO (1 μmol/L, 30 minutes). Mean value ± SD. NBs assessed PMLC212S Ctrl (n = 42), PMLC212S ATO (n = 28), PMLC213S Ctrl (n = 24), PMLC213S ATO (n = 27), PMLL218G Ctrl (n = 20), PMLL218G ATO (n = 26), PMLA216G Ctrl (n = 40), PMLA216G ATO (n = 28), PMLA216V Ctrl (n = 43), PMLA216V ATO (n = 43), PMLC213V Ctrl (n = 32), PMLC213V ATO (n = 31), from at least five independent experiments. E, Representative images of red fluorescent arsenic (ReAsH) localization to NBs in GFP-PMLWT or mutant MEFs. Scale bar, 1 μm. F, Representative PML NB formation in PML C213 mutant–expressing MEFs. Scale bar, 5 μm. G, Confocal analysis of PML NB formation following cysteine alkylation with NEM (10 μmol/L, 1 hour) in GFP-PMLWT- or PMLC213V -expressing MEFs. Scale bar, 5 μm. H, Western blot analysis of basal PML sumoylation in GFP-PMLWT- or mutant-expressing MEFs (arrowheads highlight different sumoylation levels of PML mutants). I, Western blot analysis of PML sumoylation in GFP-PMLWT or mutant MEFs treated or not with ATO (1 μmol/L, 1 hour). J, Confocal analysis of PML and Sp100 localization in GFP-PMLWT- or C213 mutant–expressing MEFs treated or not with ATO (1 μmol/L, 1 hour). Scale bar, 5 μm. K, Pulldown of HIS10-SUMO2 conjugates from PmlWT or PmlL222G mESCs treated or not with ATO (1 μmol/L, 30 minutes). ATO-treated nontransduced PmlWT mESCs are shown as controls. Western blot with anti-SUMO2/3 (left), anti-mPML (right, top), or anti-KAP1 antibodies (right, bottom). Sumoylated species are indicated. Representative data of n = 3 independent experiments.
Figure 7. PML-RARA ATO sensitivity requires C213 and B2 controls in vivo responses to ROS. A, Confocal analysis of PmlWT MEFs stably expressing human GFP-PML-RARAWT or its B2 mutants treated or not with ATO (1 μmol/L, 6 hours). Scale bar, 5 μm. Different display settings for each genotype. B, Western blot analysis of PML-RARA sumoylation in Lin− hematopoietic progenitors expressing PML-RARA or the indicated mutants, treated or not with ATO (1 μmol/L, 1 hour). Representative data from three independent experiments. C, FRAP analysis of GFP-PML-RARA dynamics at NBs in GFP-PML-RARAWT- or GFP-PML-RARAC213V–expressing PmlKO MEFs treated or not with ATO (1 μmol/L, 30 minutes). Mean value ± SD. NBs assessed PML-RARAWT (n = 20), PML-RARAWT+ATO (n = 37), PML-RARAC213V (n = 42), PML-RARAC213V+ATO (n = 25), from at least five independent experiments. RFI, relative fluorescence intensity. D, FRAP analysis of GFP-PMLWT dynamics at NBs in MEFs treated or not with H2O2 (30 minutes). Mean value ± SD. NBs assessed PML (n = 35), H2O2 100 μmol/L (n = 27), H2O2 500 μmol/L (n = 32), from at least five independent experiments. Ctrl, control. E, Same as D with GFP-PMLC213V. Mean value ± SD. NBs assessed PMLC213V (n = 32), H2O2 100 μmol/L (n = 24), H2O2 500 μmol/L (n = 22), from at least five independent experiments. F, Box plot representing γH2AX dots counts assessed by immunofluorescence on liver tissues from three untreated mice. PmlWT (n = 633), PmlKO (n = 527), PmlA220V (n = 333). ***, P ≤ 0.001, unpaired t test. G, Gene-set enrichment analysis (GSEA) of differentially expressed genes from liver samples from untreated PmlWT or PmlA220V (equivalent of human PMLA216V) mice. Key pathways are boxed. Livers from n = 3 Pml or PmlA220V mice. H, GSEA of differentially expressed genes in liver samples from PmlKO or PmlA220V in comparison to PmlWT after an 18-hour CCl4 treatment. Key pathways are boxed. Livers from n = 3 mice of each genotype. I, Liver fibrosis following a 5-week CCl4 treatment detected by Picrosirius Red staining (left). Quantification of the fibrotic areas (right). Livers from n = 7 Pml, PmlKO, or PmlA220V mice. Scale bar, 400 μm. **, P ≤ 0.01, Mann–Whitney test. J, Model of PML NB liquid to gel-like transition controlled by the B2 α1 helix exposing C213 and hijacked by ATO. Hydrophobic-mediated trimerization of PML B2 (gray disk), regroups the three C213 in the center of the structure. The latter is impaired in α-helix mutants. In the physiologic states, this C213 triad behaves as a rheostat depending on their oxidation state (asterisks), fine-tuning the interactions within the trimer (light and dark gray disk). Arsenic binding crosslinks these cysteines, hijacking the ROS-rheostat to yield polymerization-induced gel-like transition.
Figure 7.
PML-RARA ATO sensitivity requires C213 and B2 controls in vivo responses to ROS. A, Confocal analysis of PmlWT MEFs stably expressing human GFP-PML-RARAWT or its B2 mutants treated or not with ATO (1 μmol/L, 6 hours). Scale bar, 5 μm. Different display settings for each genotype. B, Western blot analysis of PML-RARA sumoylation in Lin hematopoietic progenitors expressing PML-RARA or the indicated mutants, treated or not with ATO (1 μmol/L, 1 hour). Representative data from three independent experiments. C, FRAP analysis of GFP-PML-RARA dynamics at NBs in GFP-PML-RARAWT- or GFP-PML-RARAC213V–expressing PmlKO MEFs treated or not with ATO (1 μmol/L, 30 minutes). Mean value ± SD. NBs assessed PML-RARAWT (n = 20), PML-RARAWT+ATO (n = 37), PML-RARAC213V (n = 42), PML-RARAC213V+ATO (n = 25), from at least five independent experiments. RFI, relative fluorescence intensity. D, FRAP analysis of GFP-PMLWT dynamics at NBs in MEFs treated or not with H2O2 (30 minutes). Mean value ± SD. NBs assessed PML (n = 35), H2O2 100 μmol/L (n = 27), H2O2 500 μmol/L (n = 32), from at least five independent experiments. Ctrl, control. E, Same as D with GFP-PMLC213V. Mean value ± SD. NBs assessed PMLC213V (n = 32), H2O2 100 μmol/L (n = 24), H2O2 500 μmol/L (n = 22), from at least five independent experiments. F, Box plot representing γH2AX dots counts assessed by immunofluorescence on liver tissues from three untreated mice. PmlWT (n = 633), PmlKO (n = 527), PmlA220V (n = 333). ***, P ≤ 0.001, unpaired t test. G, Gene-set enrichment analysis (GSEA) of differentially expressed genes from liver samples from untreated PmlWT or PmlA220V (equivalent of human PMLA216V) mice. Key pathways are boxed. Livers from n = 3 Pml or PmlA220V mice. H, GSEA of differentially expressed genes in liver samples from PmlKO or PmlA220V in comparison to PmlWT after an 18-hour CCl4 treatment. Key pathways are boxed. Livers from n = 3 mice of each genotype. I, Liver fibrosis following a 5-week CCl4 treatment detected by Picrosirius Red staining (left). Quantification of the fibrotic areas (right). Livers from n = 7 Pml, PmlKO, or PmlA220V mice. Scale bar, 400 μm. **, P ≤ 0.01, Mann–Whitney test. J, Model of PML NB liquid to gel-like transition controlled by the B2 α1 helix exposing C213 and hijacked by ATO. Hydrophobic-mediated trimerization of PML B2 (gray disk), regroups the three C213 in the center of the structure. The latter is impaired in α-helix mutants. In the physiologic states, this C213 triad behaves as a rheostat depending on their oxidation state (asterisks), fine-tuning the interactions within the trimer (light and dark gray disk). Arsenic binding crosslinks these cysteines, hijacking the ROS-rheostat to yield polymerization-induced gel-like transition.

Comment in

References

    1. Lallemand-Breitenbach V, de The H. PML nuclear bodies: from architecture to function. Curr Opin Cell Biol 2018;52:154–61. - PubMed
    1. Hsu KS, Kao HY. PML: regulation and multifaceted function beyond tumor suppression. Cell Biosci 2018;8:5. - PMC - PubMed
    1. de The H, Pandolfi PP, Chen Z. Acute promyelocytic leukemia: a paradigm for oncoprotein-targeted cure. Cancer Cell 2017;32:552–60. - PubMed
    1. Gurrieri C, Nafa K, Merghoub T, Bernardi R, Capodieci P, Biondi A, et al. . Mutations of the PML tumor suppressor gene in acute promyelocytic leukemia. Blood 2004;103:2358–62. - PubMed
    1. Koken MHM, Linares-Cruz G, Quignon F, Viron A, Chelbi-Alix MK, Sobczak-Thépot J, et al. . The PML growth-suppressor has an altered expression in human oncogenesis. Oncogene 1995;10:1315–24. - PubMed

Publication types

MeSH terms