

Development, validation, and simplification of a scanner-specific CT simulator
- PMID: 37656009
- PMCID: PMC10904672
- DOI: 10.1002/mp.16679
Development, validation, and simplification of a scanner-specific CT simulator
Erratum in
-
Correction to "Development, validation, and simplification of a scanner-specific CT simulator".Med Phys. 2025 Jun;52(6):5125. doi: 10.1002/mp.17839. Epub 2025 May 20. Med Phys. 2025. PMID: 40390626 No abstract available.
Abstract
Background: Simulated computed tomography (CT) images allow for knowledge of the underlying ground truth and for easy variation of imaging conditions, making them ideal for testing and optimization of new applications or algorithms. However, simulating all processes that affect CT images can result in simulations that are demanding in terms of processing time and computer memory. Therefore, it is of interest to determine how much the simulation can be simplified while still achieving realistic results.
Purpose: To develop a scanner-specific CT simulation using physics-based simulations for the position-dependent effects and shift-invariant image corruption methods for the detector effects. And to investigate the impact on image realism of introducing simplifications in the simulation process that lead to faster and less memory-demanding simulations.
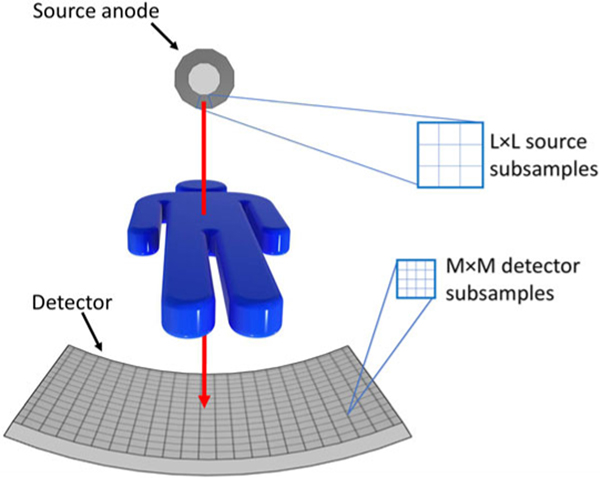
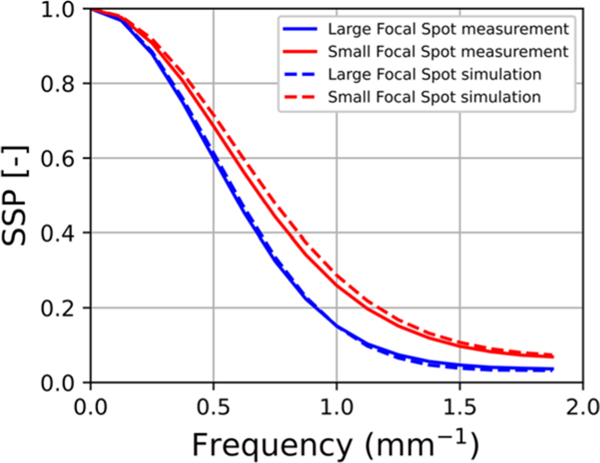
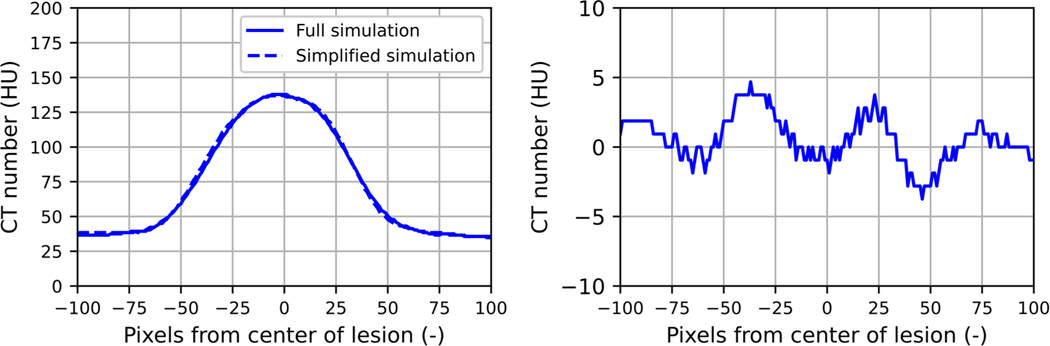
Methods: To make the simulator realistic and scanner-specific, the spatial resolution and noise characteristics, and the exposure-to-detector output relationship of a clinical CT system were determined. The simulator includes a finite focal spot size, raytracing of the digital phantom, gantry rotation during projection acquisition, and finite detector element size. Previously published spectral models were used to model the spectrum for the given tube voltage. The integrated energy at each element of the detector was calculated using the Beer-Lambert law. The resulting angular projections were subsequently corrupted by the detector modulation transfer function (MTF), and by addition of noise according to the noise power spectrum (NPS) and signal mean-variance relationship, which were measured for different scanner settings. The simulated sinograms were reconstructed on the clinical CT system and compared to real CT images in terms of CT numbers, noise magnitude using the standard deviation, noise frequency content using the NPS, and spatial resolution using the MTF throughout the field of view (FOV). The CT numbers were validated using a multi-energy CT phantom, the noise magnitude and frequency were validated with a water phantom, and the spatial resolution was validated with a tungsten wire. These metrics were compared at multiple scanner settings, and locations in the FOV. Once validated, the simulation was simplified by reducing the level of subsampling of the focal spot area, rotation and of detector pixel size, and the changes in MTFs were analyzed.
Results: The average relative errors for spatial resolution within and across image slices, noise magnitude, and noise frequency content within and across slices were 3.4%, 3.3%, 4.9%, 3.9%, and 6.2%, respectively. The average absolute difference in CT numbers was 10.2 HU and the maximum was 22.5 HU. The simulation simplification showed that all subsampling can be avoided, except for angular, while the error in frequency at 10% MTF would be maximum 16.3%.
Conclusion: The simulation of a scanner-specific CT allows for the generation of realistic CT images by combining physics-based simulations for the position-dependent effects and image-corruption methods for the shift-invariant ones. Together with the available ground truth of the digital phantom, it results in a useful tool to perform quantitative analysis of reconstruction or post-processing algorithms. Some simulation simplifications allow for reduced time and computer power requirements with minimal loss of realism.
Keywords: CT; computer simulations; system characterization.
© 2023 The Authors. Medical Physics published by Wiley Periodicals LLC on behalf of American Association of Physicists in Medicine.
Conflict of interest statement
CONFLICT OF INTEREST STATEMENT
The authors have the following conflicts of interest to disclose: Jonas Teuwen—shareholder Ellogon.AI; Ewoud J. Smit—speaker bureau of Canon Medical Systems and patent inventor 4D Similarity Filter; Ioannis Sechopoulos—research agreements with Siemens Healthcare, Canon Medical Systems, Screen-Point Medical, Sectra Benelux, Volpara Healthcare, Lunit and iCAD, and speaker agreement with Siemens Healthcare.
Figures


Similar articles
-
Physics-informed model-based generative neural network for synthesizing scanner- and algorithm-specific low-dose CT exams.Med Phys. 2025 Jun;52(6):3940-3958. doi: 10.1002/mp.17680. Epub 2025 Feb 13. Med Phys. 2025. PMID: 39945452
-
Validation of synthesized normal-resolution image data generated from high-resolution acquisitions on a commercial CT scanner.Med Phys. 2020 Oct;47(10):4775-4785. doi: 10.1002/mp.14395. Epub 2020 Aug 5. Med Phys. 2020. PMID: 32677085
-
Voxelwise characterization of noise for a clinical photon-counting CT scanner with a model-based iterative reconstruction algorithm.Eur Radiol Exp. 2025 Jan 2;9(1):2. doi: 10.1186/s41747-024-00541-2. Eur Radiol Exp. 2025. PMID: 39747757 Free PMC article.
-
DukeSim: A Realistic, Rapid, and Scanner-Specific Simulation Framework in Computed Tomography.IEEE Trans Med Imaging. 2019 Jun;38(6):1457-1465. doi: 10.1109/TMI.2018.2886530. Epub 2018 Dec 12. IEEE Trans Med Imaging. 2019. PMID: 30561344 Free PMC article.
-
Effects of ray profile modeling on resolution recovery in clinical CT.Med Phys. 2014 Feb;41(2):021907. doi: 10.1118/1.4862510. Med Phys. 2014. PMID: 24506628
Cited by
-
Physics-informed model-based generative neural network for synthesizing scanner- and algorithm-specific low-dose CT exams.Med Phys. 2025 Jun;52(6):3940-3958. doi: 10.1002/mp.17680. Epub 2025 Feb 13. Med Phys. 2025. PMID: 39945452
-
Performance evaluation of a 4D similarity filter for dynamic CT angiography imaging of the liver.Med Phys. 2024 Dec;51(12):8814-8827. doi: 10.1002/mp.17394. Epub 2024 Sep 12. Med Phys. 2024. PMID: 39264288 Free PMC article.
-
Simulating scanner-and algorithm-specific 3D CT noise texture using physics-informed 2D and 2.5D generative neural network models.Proc SPIE Int Soc Opt Eng. 2025 Feb;13405:134052J. doi: 10.1117/12.3047909. Epub 2025 Apr 8. Proc SPIE Int Soc Opt Eng. 2025. PMID: 40365117 Free PMC article.
References
MeSH terms
Grants and funding
LinkOut - more resources
Full Text Sources
Medical
Miscellaneous
