. 2023 Nov 6;155(11):e202313377.
doi: 10.1085/jgp.202313377. Epub 2023 Sep 1.

Myosin expression and contractile function are altered by replating stem cell-derived cardiomyocytes

Affiliations

Myosin expression and contractile function are altered by replating stem cell-derived cardiomyocytes

Felix Osten et al. J Gen Physiol. .

Abstract

Myosin heavy chain (MyHC) is the main determinant of contractile function. Human ventricular cardiomyocytes (CMs) predominantly express the β-isoform. We previously demonstrated that ∼80% of human embryonic stem cell-derived cardiomyocytes (hESC-CMs) express exclusively β-MyHC after long-term culture on laminin-coated glass coverslips. Here, we investigated the impact of enzymatically detaching hESC-CMs after long-term culture and subsequently replating them for characterization of cellular function. We observed that force-related kinetic parameters, as measured in a micromechanical setup, resembled α- rather than β-MyHC-expressing myofibrils, as well as changes in calcium transients. Single-cell immunofluorescence analysis revealed that replating hESC-CMs led to rapid upregulation of α-MyHC, as indicated by increases in exclusively α-MyHC- and in mixed α/β-MyHC-expressing hESC-CMs. A comparable increase in heterogeneity of MyHC isoform expression was also found among individual human induced pluripotent stem cell (hiPSC)-derived CMs after replating. Changes in MyHC isoform expression and cardiomyocyte function induced by replating were reversible in the course of the second week after replating. Gene enrichment analysis based on RNA-sequencing data revealed changes in the expression profile of mechanosensation/-transduction-related genes and pathways, especially integrin-associated signaling. Accordingly, the integrin downstream mediator focal adhesion kinase (FAK) promoted β-MyHC expression on a stiff matrix, further validating gene enrichment analysis. To conclude, detachment and replating induced substantial changes in gene expression, MyHC isoform composition, and function of long-term cultivated human stem cell-derived CMs, thus inducing alterations in mechanosensation/-transduction, that need to be considered, particularly for downstream in vitro assays.


Conflict of interest statement

Disclosures: T. Thum reported other from Cardior Pharmaceuticals outside the submitted work. No other disclosures were reported.

Figures

Figure 1.
Figure 1.
Outline of differentiation, enrichment, seeding, and replating of hPSC-CMs on laminin-coated glass coverslips, a stiff matrix. hPSC-CMs were differentiated, enriched, seeded, and replated on indicated days.
Figure 2.
Figure 2.
Analysis of force-related kinetic parameters of myofibrils from demembranated replated hESC-CMs. (A) Example of a force trace indicating the protocol (on top) of sarcomeric activation (+Ca2+) and relaxation (−Ca2+) and the force-related parameters: rate constant of Ca2+-induced force development (kact), amplitude of the isometric force generated by cycling crossbridges (Fact), rate constant of mechanically induced force redevelopment of Ca2+-activated myofibrils (ktr), rate constant of the linear force decay during the first, slow phase of relaxation (klin), and the rate constant of the monoexponential force decay during the second, fast phase of relaxation (krel). (B) Force traces during force redevelopment and relaxation for myofibrils of hESC-CMs replated for 2 (grey) or 9 (black) days. Small horizontal arrows indicate the duration of the first relaxation phase (tlin) on days 2 and 9. (C and D) ktr, reflecting crossbridge cycling kinetics (C), and klin (D), reflecting crossbridges leaving force-generating states in replated hESC-CMs on indicated days, and in 35 d old non-replated hESC-CMs (data imported from Iorga et al. [2018]). Mean ± SD; n = 2–20 myofibrillar bundles obtained from 12 coverslips derived from one differentiation. Insets: Diagrams representing the two states of cycling cross-bridges. fapp: rate constant or probability of cross-bridges entering force-generating states); gapp: rate constant or probability of cross-bridges leaving force-generating states.
Figure 3.
Figure 3.
Calcium transients from hESC-CMs replated for 1 to 4 d from day 35 onward without electrical pacing and then paced with 1 Hz. (A) Representative electrical stimulation protocol. Stimulation with 0.5 Hz for 1 min, followed by a stimulation break for registration of basal ratio (basal calcium). The basal ratio was measured at the end of the break where ratio reached a stable phase. Then, the frequency was increased from 0.5 to 1 Hz for ∼1 min. Calcium transients were analyzed during 1 Hz stimulation. (B) Representative averaged calcium transient with analyzed parameters of minimum (diastolic), maximum (systolic, peak ratio) 340/380 nm ratios, calcium amplitude (difference between maximum and minimum 340/380 nm ratios), time to peak, half decay time, and maximum calcium rise velocity (red). Parameters were calculated after fitting the averaged calcium transients using IonWizard software. (C–I) Baseline calcium level (C) without electrical stimulus (baseline ratio 340/380 nm), (D) diastolic (minimum) calcium level (diastolic ratio 340/380 nm), (E) calcium amplitude (ratio 340/380 nm), (F) peak ratio (peak ratio 340/380 nm, maximum calcium level), (G) time to peak (in s), (H) calcium rise velocity (R/s; R: ratio 340/380 nm), and (I) half-decay time of calcium transients (in s). Calcium transients were determined under electrical stimulation with 1 Hz using the ratiometric calcium indicator Fura-2 and compared with non-replated hESC-CMs. Ratio: emission at 510 nm measured after alternating excitation at 340 nm/380 nm. Mean ± SD; n = 28–71 cells from 5–20 individual coverslips derived from two differentiations. Cells are colored according to the hESC-CM differentiation they were derived from (dark grey: differentiation no. 1; light grey: differentiation no. 2). *, P < 0.05. (J) hESC-CMs grown for 35 d on laminin-coated glass coverslips were detached, replated, cultivated for two additional days, and compared with 37-d-old non-replated cells; n = 3. mRNA expression for indicated genes of calcium handling was analyzed by RNA-seq. Data are presented as log2 fold change. The dashed line at ±0.585 indicates a ±1.5-fold change.
Figure 4.
Figure 4.
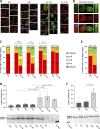
Analysis of myosin isoform expression in replated hPSC-CMs. hESC-CMs or hiPSC-CMs were cultivated for indicated days on laminin-coated glass coverslips or replated on day 35 or day 18, respectively, and further cultivated for indicated days. (A) Myosin isoform expression was analyzed in hESC-CMs by single-cell immunofluorescence (IF) using specific antibodies against α- (green) and β-MyHC (red). Nuclei were stained with DAPI (blue). Scale bars: 10 μm. (B) Single-cell IF analysis showing replated hESC-CMs from 35 + 4 d with mixed α- and β-MyHC expression with insets (white squares) demonstrating a detailed view of sarcomeric staining as relevant for classification (see below). Scale bars: 10 μm. (C) Single-cell IF analysis of myosin expression in hESC-CMs. The fractions of cells in the different categories (see Materials and methods) are shown as the percentage of the total number of cells analyzed (n, set to 100%) for each time point. Mean ± SD; indicated number of cells (n) were obtained from six individual coverslips derived from three differentiations; P values: exclusively β-MyHC expressing cells. (D) MyHC isoforms were separated by SDS-PAGE and the ratio of α-MyHC/β-MyHC expression in hESC-CMs was determined densitometrically. Mean ± SEM; n = 3 individual coverslips from three differentiations. Representative SDS-PAGE gel with samples from human right atrium (AD) as indicated; molecular weight marker: 200 kD. (E) Myosin isoform expression was analyzed in hiPSC-CMs by single-cell IF using specific antibodies against α- and β-MyHC. The fractions of cells in the different categories (see Materials and methods) are shown as a percentage of the total number of cells analyzed (n, set to 100%) for each time point. Mean; two coverslips derived from one differentiation. (F) MyHC isoforms were separated by SDS-PAGE and the ratio of α-MyHC/β-MyHC expression in hiPSC-CMs was determined densitometrically. Mean ± SEM; n = 3 or 4 individual coverslips from one differentiation. Representative SDS-PAGE gel, with samples from the human right atrium (AD) and left ventricle (LV) as indicated; molecular weight marker: 200 kD. Source data are available for this figure: SourceData F4.
Figure 5.
Figure 5.
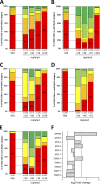
IF analysis of myosin isoform expression in single hESC-CMs replated at different times. (A–E) hESC-CMs grown for (A) 34, (B) 42, (C) 45, (D) 48, and (E) 55 d on laminin-coated glass coverslips were detached, replated on laminin-coated glass coverslips, grown for the indicated number of days (+d), and compared with non-replated controls (d). Myosin isoform expression was analyzed by single-cell IF using specific antibodies against α- and β-MyHC. The fractions of cells in the different categories are shown as a percentage of the total number of cells analyzed (n, set to 100%) for each time point (see Materials and methods). One coverslip from one differentiation each. (F) Changes in sarcomeric gene expression (log2 fold change) of hESC-CMs after replating compared with 37 d old non-replated controls. hESC-CMs grown for 35 d on laminin-coated glass coverslips were detached, replated on laminin-coated glass coverslips and cultivated for two more days. mRNA expression was analyzed using RNA-Seq data. Changes in mRNA expression of indicated myosin heavy chain (MYH), myosin light chain (MYL), and troponin (TNN) isoform genes are presented as log2 fold change. The dashed line at ±0.585 indicates a ±1.5-fold change; n = 3 culture dishes from three differentiations.
Figure 6.
Figure 6.
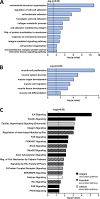
Gene enrichment analysis based on RNA-seq data of replated (35 + 2 d) vs. non-replated control (37 d) hESC-CMs. hESC-CMs grown for 35 d on laminin-coated glass coverslips were detached, replated on laminin-coated glass coverslips, and grown for an additional 2 d. Gene expression was compared with 37-d-old controls (fold change cutoff 1.5; n = 3). (A and B) Enriched biological process categories related to (A) ECM and cell adhesion, and (B) muscle development and function as demonstrated by GO analysis of upregulated genes using the functional enrichment analysis web tool WebGestalt. Sorted by −log P value ranking (Fisher’s exact test) with P < 0.05 set as the threshold. (C) IPA (Qiagen) revealed canonical pathways involved in mechanosensation/-transduction. Integrin-, G-protein- and calcium-associated pathways are indicated with a threshold of P < 0.05. Significance values (P value of overlap) for canonical pathways are calculated by the right-tailed Fisher’s exact test; n = 3 culture dishes from three differentiations. Combinations of black-, white-, or gray-striped bars refer to the involvement of signaling in two of the pathway categories as indicated by the legend.
Figure 7.
Figure 7.
β-MyHC expression is reduced by inhibition of FAK. (A) Western blot analysis of FAK and ERK1/2-MAPK expression and phosphorylation in hESC-CMs grown for indicated days on laminin-coated glass coverslips. Representative blot, with β-tubulin serving as a loading control. (B) Western blot analysis of ERK1/2-MAPK phosphorylation in 35 d hESC-CMs grown on Matrigel-coated PDMS treated with or without 5 μM FAK-inhibitor 14 (FAK-Inh) or 10 μM MEK1/2 inhibitor U0126 (MEK1/2-Inh) for 2 d. The ratio of phospho/total ERK1/2-MAPK expression was determined densitometrically. Mean ± SEM; n = 3 individual coverslips from one differentiation. Representative blot, with β-tubulin serving as a loading control. (C) Myosin isoform expression was analyzed by single-cell IF using specific antibodies against α-MyHC and β-MyHC in hESC-CMs grown on laminin-coated glass coverslips treated with or without 5 μM FAK-inhibitor 14 (FAK-Inh) or 10 μM MEK1/2 inhibitor U0126 (MEK1/2-Inh) from day 7 on for 2 or 4 d. The fractions of cells in the different indicated categories (see Materials and methods) are shown as a percentage of the total number of cells analyzed (n, set to 100%, from three coverslips derived from one differentiation; P values: exclusively β-MyHC expressing cells. (D) hESC-CMs were grown for 35 d on laminin-coated glass coverslips or on Matrigel-coated PDMS and treated with or without 5 µM FAK-inhibitor 14 (FAK-Inh) or 10 μM MEK1/2 inhibitor U0126 (MEK1/2-Inh) for 2 d as indicated. MLC2 isoform expression was analyzed by single-cell IF using specific antibodies against MLC2v and MLC2a. The fractions of cells in the different categories (see Materials and methods) are shown as a percentage of the total number of cells analyzed (n, set to 100%, from three coverslips derived from one differentiation; P values: exclusively MLC2v expressing cells). Source data are available for this figure: SourceData F7.

Comment in

  • Rethinking replating.
    Short B. Short B. J Gen Physiol. 2023 Nov 6;155(11):e202313491. doi: 10.1085/jgp.202313491. Epub 2023 Oct 17. J Gen Physiol. 2023. PMID: 37847309 Free PMC article.

References

    1. Brenner, B. 1988. Effect of Ca2+ on cross-bridge turnover kinetics in skinned single rabbit psoas fibers: Implications for regulation of muscle contraction. Proc. Natl. Acad. Sci. USA. 85:3265–3269. 10.1073/pnas.85.9.3265 - DOI - PMC - PubMed
    1. Castillo, E.A., Lane K.V., and Pruitt B.L.. 2020. Micromechanobiology: Focusing on the cardiac cell-substrate interface. Annu. Rev. Biomed. Eng. 22:257–284. 10.1146/annurev-bioeng-092019-034950 - DOI - PubMed
    1. Chatterjee, S., Hofer T., Costa A., Lu D., Batkai S., Gupta S.K., Bolesani E., Zweigerdt R., Megias D., Streckfuss-Bömeke K., et al. . 2021. Telomerase therapy attenuates cardiotoxic effects of doxorubicin. Mol. Ther. 29:1395–1410. 10.1016/j.ymthe.2020.12.035 - DOI - PMC - PubMed
    1. Clemente, C.F., Xavier-Neto J., Dalla Costa A.P., Consonni S.R., Antunes J.E., Rocco S.A., Pereira M.B., Judice C.C., Strauss B., Joazeiro P.P., et al. . 2012. Focal adhesion kinase governs cardiac concentric hypertrophic growth by activating the AKT and mTOR pathways. J. Mol. Cell. Cardiol. 52:493–501. 10.1016/j.yjmcc.2011.10.015 - DOI - PubMed
    1. Denning, C., Borgdorff V., Crutchley J., Firth K.S., George V., Kalra S., Kondrashov A., Hoang M.D., Mosqueira D., Patel A., et al. . 2016. Cardiomyocytes from human pluripotent stem cells: From laboratory curiosity to industrial biomedical platform. Biochim. Biophys. Acta. 1863:1728–1748. 10.1016/j.bbamcr.2015.10.014 - DOI - PMC - PubMed

Publication types