. 2023 Sep 26;42(9):113079.
doi: 10.1016/j.celrep.2023.113079. Epub 2023 Aug 31.

Irreversible cell cycle exit associated with senescence is mediated by constitutive MYC degradation

Affiliations

Irreversible cell cycle exit associated with senescence is mediated by constitutive MYC degradation

Marwa M Afifi et al. Cell Rep. .

Abstract

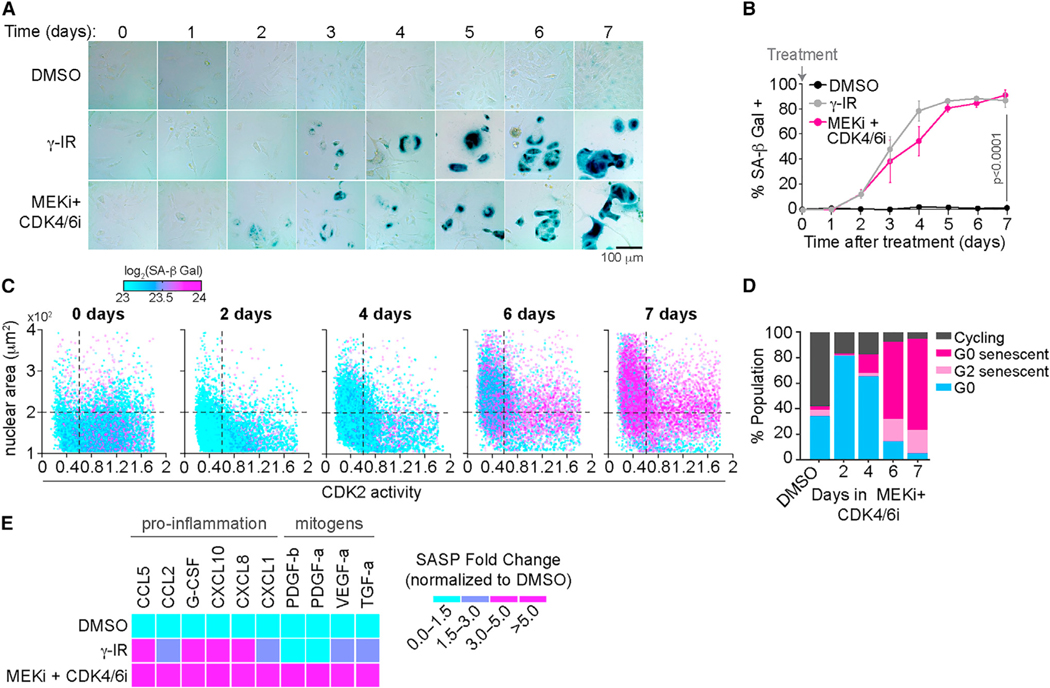
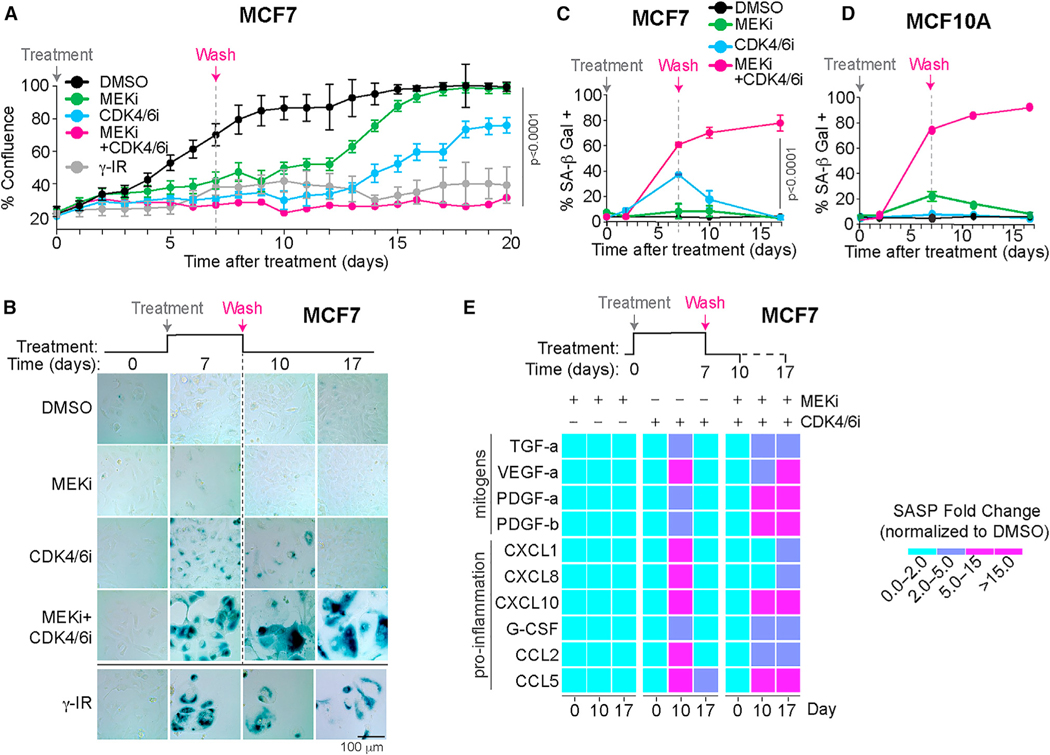
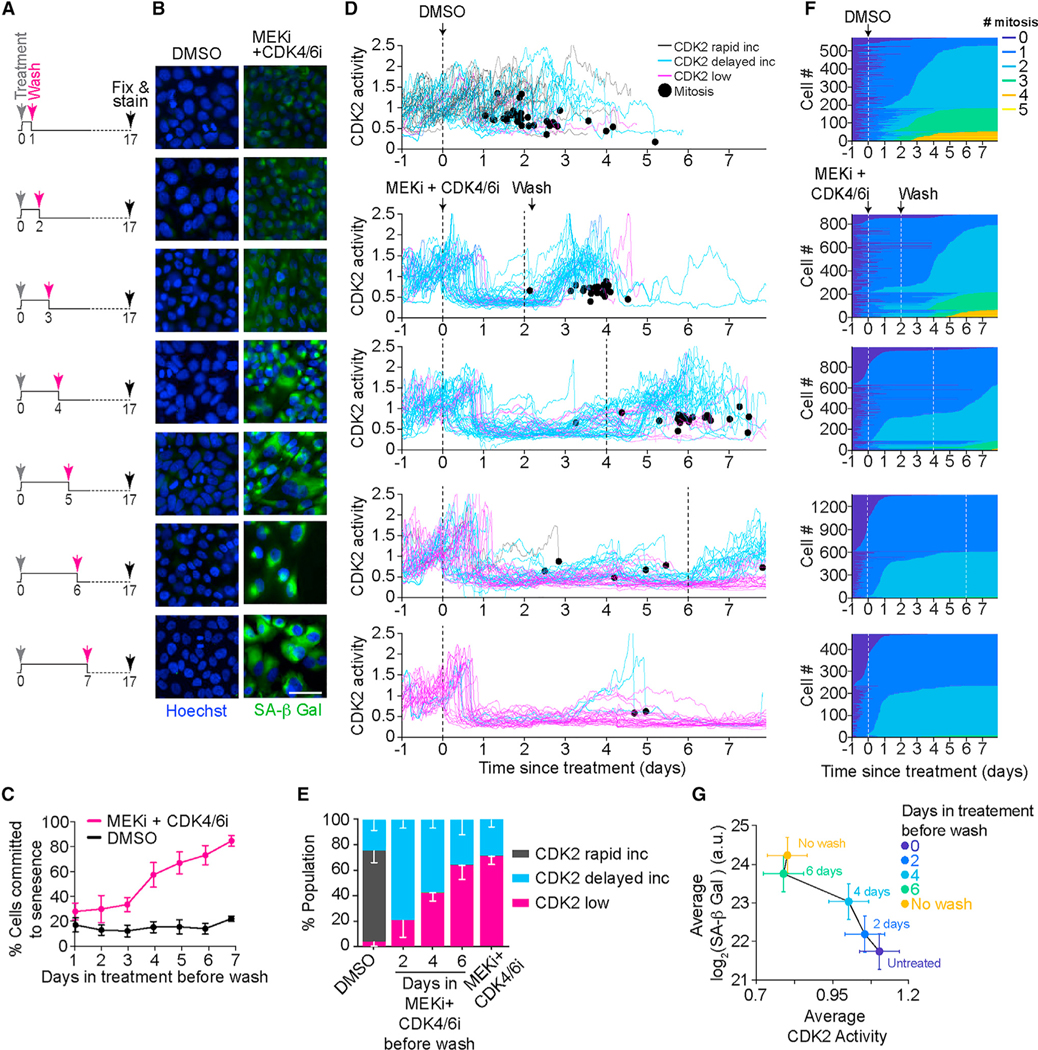
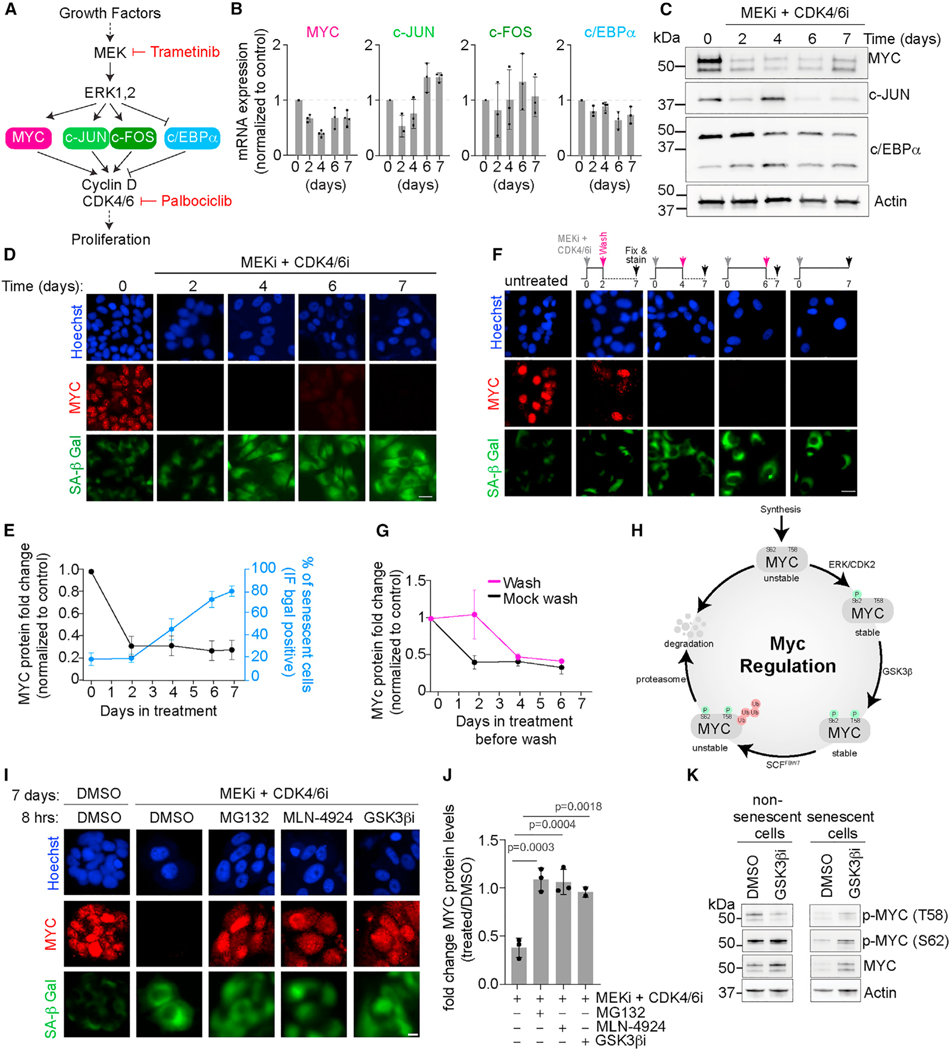
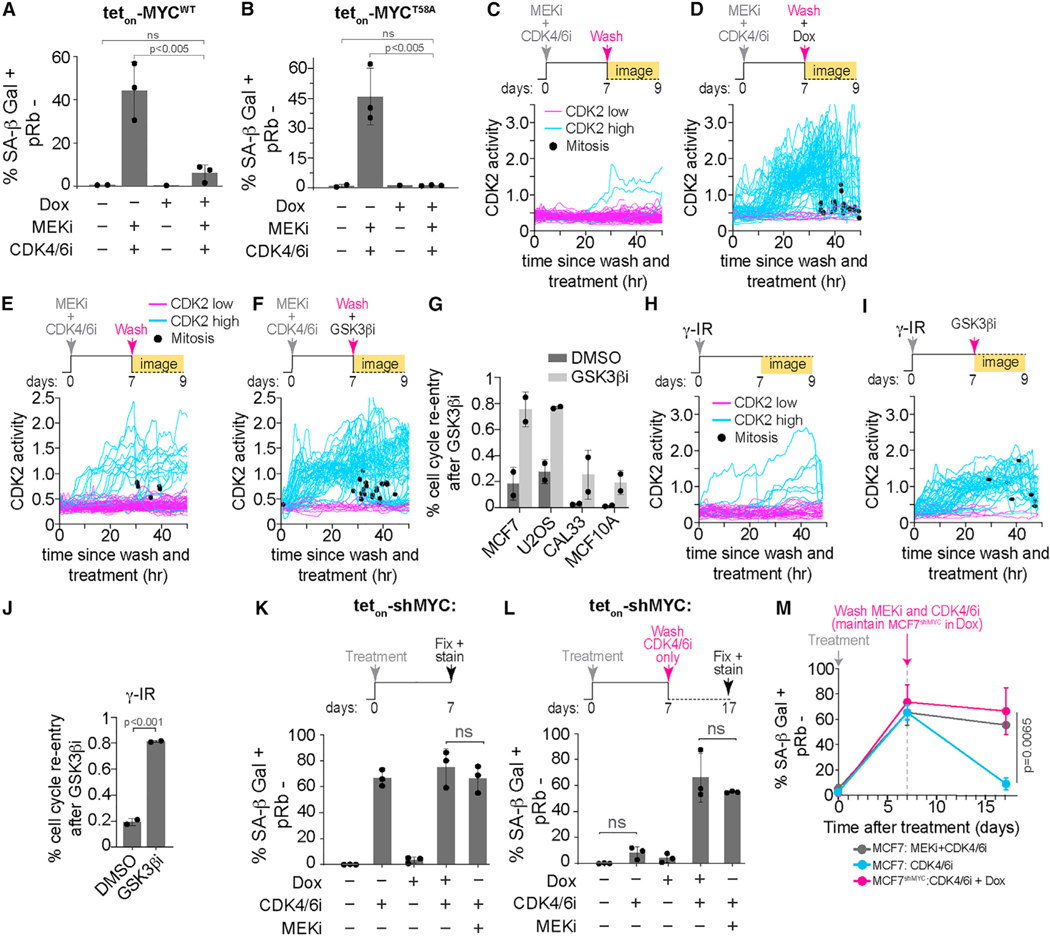
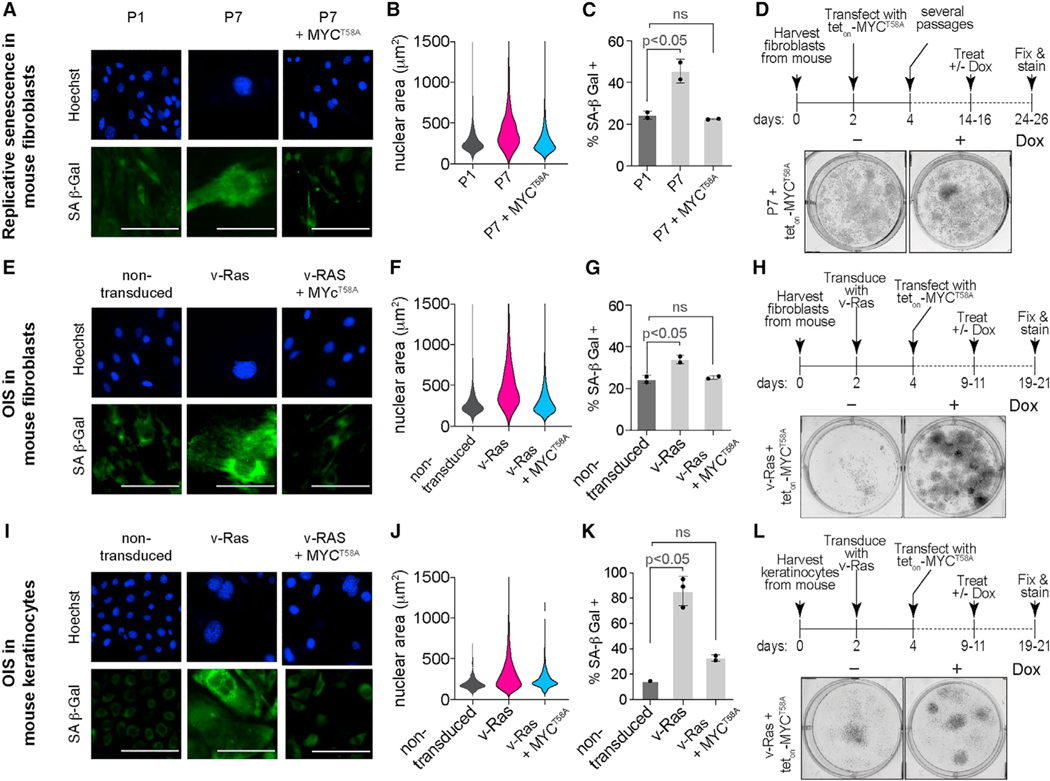
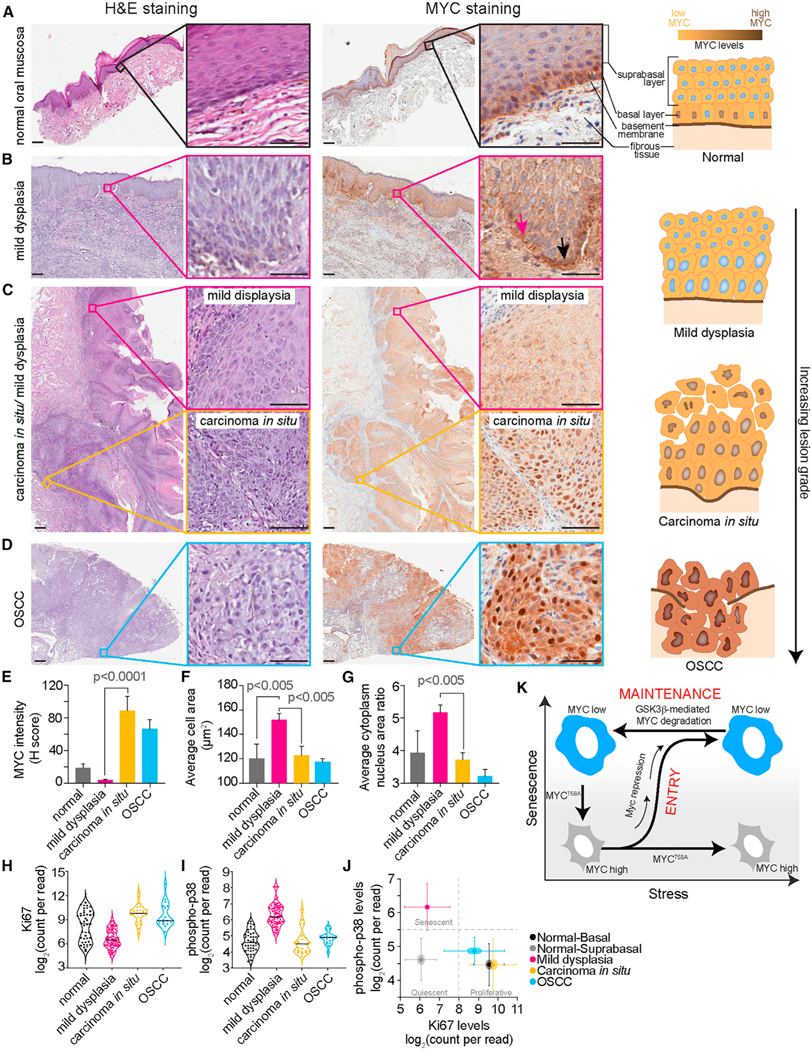
Cells can irreversibly exit the cell cycle and become senescent to safeguard against uncontrolled proliferation. While the p53-p21 and p16-Rb pathways are thought to mediate senescence, they also mediate reversible cell cycle arrest (quiescence), raising the question of whether senescence is actually reversible or whether alternative mechanisms underly the irreversibility associated with senescence. Here, we show that senescence is irreversible and that commitment to and maintenance of senescence are mediated by irreversible MYC degradation. Senescent cells start dividing when a non-degradable MYC mutant is expressed, and quiescent cells convert to senescence when MYC is knocked down. In early oral carcinogenesis, epithelial cells exhibit MYC loss and become senescent as a safeguard against malignant transformation. Later stages of oral premalignant lesions exhibit elevated MYC levels and cellular dysplasia. Thus, irreversible cell cycle exit associated with senescence is mediated by constitutive MYC degradation, but bypassing this degradation may allow tumor cells to escape during cancer initiation.

Keywords: CDK4/6; CP: Cell biology; MEK; MYC; cell cycle; palbociclib; pre-malignant lesions; senescence; time-lapse imaging; trametinib.


Conflict of interest statement

Declaration of interests The authors declare no competing interests.

Figures

Figure 1.
Figure 1.. A combination of MEKi and CDK4/6i induces senescence in transformed and non-transformed cells
(A) Representative images of MCF7 cells treated with DMSO, 10 Gy γ-IR, or 100 nM MEKi and 500 nM CDK4/6i and stained for SA-β Gal activity every day for 7 days. Scale bar, 100 μm. (B) Percentage of SA-β Gal-positive cells treated with the indicated conditions as a function of time after treatment. Data are represented as mean ± SD from three independent experiments. p values were obtained from one-way ANOVA with multiple-comparison test. ns, not significant. (C) Scatterplot of CDK2 activity versus nuclear area (NA) of single cells. Color represents SA-β Gal activity in each cell. MCF7 cells were treated with 100 nM MEKi and 500 nM CDK4/6i for 2, 4, 6, and 7 days. Vertical line represents the 0.6 threshold, below which cells were considered to have low CDK2 activity. Horizontal line indicates the 200 μm2 threshold above which nuclei were considered large. (D) Quantification of cells (from C) that were either cycling (CDK2 > 0.6, NA < 200 μm2, log2[SA-β Gal] < 23.5), G0 senescent (CDK2 < 0.6, NA > 200 μm2, log2[SA-β Gal] > 23.5), G2 senescent (CDK2 > 0.6, NA > 200 μm2, log2[SA-β Gal] > 23.5), or G0/quiescent cells (CDK2 < 0.6, NA < 200 μm2, log2[SA-β Gal] < 23.5). N > 1,500 cells per condition. (E) Heatmap of SASP released by cells treated with DMSO, 10 Gy γ-IR, or 100 nM MEKi and 500 nM CDK4/6i at day 7 of treatment. Conditioned media were collected at day 7 and analyzed by multiplex immunoassays. Data are fold change normalized to the DMSO-treated condition.
Figure 2.
Figure 2.. Cells maintain senescence after withdrawal of MEKi and CDK4/6i combination
(A) Percentage confluence of cells treated with the indicated conditions as a function of time after treatment. Data are represented as mean ± SD from three independent experiments. p values were obtained from one-way ANOVA with multiple-comparison test. Vertical line denotes time at which drugs were washed off. 10 Gy γ-IR-treated cells were used as a positive control. (B) Representative images of MCF7 cells treated with DMSO, 100 nM MEKi, 500 nM CDK4/6i, or a combination of MEKi and CDK4/6i for 7 days after which thetreatments were washed off and the cells were grown in complete culture medium until day 17. Cells were stained for SA-β Gal activity at days 10 and 17. Cells exposed to 10 Gy γ-IR at day 0 were used as a positive control. Scale bar, 100 μm. (C and D) Quantification of SA-β Gal-positive MCF7 (C) or MCF10A (D) cells treated with the indicated conditions as a function of time after treatment. Data are represented as mean ± SD from three independent experiments. p values were obtained from ANOVA with multiple-comparison test. (E) Heatmap of SASP factors released by cells treated with DMSO, 100 nM MEKi, 500 nM CDK4/6i, or a combination of MEKi and CDK4/6i. All treatments were washed off at day 7 and the cells were allowed to grow in complete medium until day 17. Conditioned media was collected at days 10 and 17 and analyzed by multiplex immunoassays. Data are SASP fold change normalized to DMSO-treated condition.
Figure 3.
Figure 3.. Probability of cells irreversibly committing to senescence increases with treatment duration
(A) Experimental scheme showing that MCF7 cells were treated with DMSO or a combination of 100 nM MEKi and 500 nM CDK4/6i for increasing durations 1, 2, 3, 4, 5, 6, and 7 days before washing off the drugs. Cells were then grown in complete medium until day 17, when cells were fixed and stained for SA-β Gal activity. (B) Representative images of MCF7 cells treated as described in (A). Cells were fixed and stained for SA-β Gal activity using SPIDR-IF-SA-β Gal assay (green). Nuclei were stained with Hoechst (blue). Scale bar, 10 μm. (C) Quantification of SA-β Gal-positive cells from (B) plotted as a function of time exposed to treatment before washing off the drugs. Data are represented as mean ± SD from three independent experiments. (D) Single-cell CDK2 activity traces from MCF7 cells treated with DMSO or 100 nM MEKi and 500 nM CDK4/6i while in S/G2 phase (defined as CDK2 activitygreater than 1 and APC/C activity less than 0.3 at the time of treatment). Vertical black lines indicate when drugs were added (solid) and washed off (dashed). Trace color denotes long-term fate of each cell: black, immediately built up CDK2 activity after mitosis (CDK2 rapid increase); cyan, variable time spent in a CDK2-low state following mitosis before eventually building up CDK2 activity (CDK2 delayed increase); pink, remained in CDK2-low state for the entire imaging period (CDK2 low). Black dot denotes when a cell went through mitosis. (E) Percentage of CDK2 rapid increase, CDK2 delayed increase, and CDK2-low cells from (D). Data are mean ± SD from three biological replicates. (F) Heatmaps indicating when each cell went through mitosis following the indicated treatment conditions. Vertical white lines denote times at which drugs were added (solid) and washed (dashed). (G) Phase plane diagram of the mean CDK2 activity versus the mean of SA-β Gal activity in cells treated as shown in (B). Data are mean ± SD from a representative experiment.
Figure 4.
Figure 4.. Senescence entry and maintenance are associated with irreversible MYC loss
(A) Signaling diagram showing major transcription factors as possible proteins mediating entry and commitment to cellular senescence. (B) Quantification of MYC, c-JUN, c-FOS, and c/EBPα mRNA levels normalized to control at different time points after adding MEKi + CDK4/6i. Data are represented as mean ± SD from three independent experiments. (C) Immunoblotting of MYC, c-Jun, and c/EBPα at days 0, 2, 4, 6, and 7 post-treatment. Actin was used as the loading control. Representative blot from three independent experiments. (D) Representative images of MCF7 cells treated with MEKi + CDK4/6i for the indicated number of days. Cells were fixed and stained for MYC protein (red) and SA-β Gal activity (green). Nuclei were stained with Hoechst (blue). Scale bar, 10 μm. (E) Quantification of MYC and SA-β Gal-positive cells from (D) plotted as a function of time exposed to treatment. Data are represented as mean ± SD from three independent experiments. (F) Representative images of MCF7 cells treated with DMSO, or MEKi + CDK4/6i for 2, 4, or 6 days before washing off the drugs. Cells were fixed and stained at day 7 for MYC protein (red) and SA-β Gal activity (green). Nuclei were stained with Hoechst (blue). (G) Quantification of MYC and SA-β Gal-positive cells from (F) plotted as a function of time exposed to treatment before wash. Data are represented as mean ± SD from three independent experiments. (H) Signaling diagram showing post-translational modifications mediating MYC stability and degradation. (I) Representative images of MCF7 cells treated with MEKi + CDK4/6i for 7 days, then treated with DMSO, MG132 (10 μM), MLN-4924 (3 μM), or GSK3β inhibitor (1 μM) for 8 h before fixation. Scale bar, 10 μm. (J) Quantification of the fold change in MYC protein levels after treatment with the indicated drugs (treated/DMSO) from (I). Data are represented as mean ± SD from three independent experiments. p values were obtained from one-way ANOVA with multiple comparison test. (K) Immunoblotting of MYC, p-MYC (T58), and p-MYC (S62) in control cells (left) and cells initially treated with MEKi + CDK4/6i for 4 days to induce senescence(right), followed by treatment with DMSO, MG132 (10 μM), MLN-4924 (3 μM), or GSK3β inhibitor (1 μM) for 8 h before collection of cell lysates. Actin was used as the loading control.
Figure 5.
Figure 5.. Cells enter and maintain senescence by irreversible degradation of MYC
(A and B) Quantification of SA-β Gal-positive and pRb-negative cells from Figures S5D and S5E treated with the indicated conditions. Data are represented as mean ± SD from three independent experiments. p values were obtained from one-way ANOVA with multiple-comparison test. ns, not significant. (C and D) Single-cell CDK2 activity traces from MCF7 cells transduced with teton-MYCT58A treated with 100 nM MEKi and 500 nM CDK4/6i for 7 days. At day 7, cells were washed to remove drugs and were treated with either DMSO (C) or 1 μM doxycycline (Dox) (D) when time-lapse imaging was started. Trace color denotes the long-term fate of each cell: cyan, started in the CDK2-low state before eventually building up CDK2 activity (CDK2 high); pink, remained in CDK2-low state for the entire imaging period (CDK2 low). Black dot denotes when a cell went through mitosis. (E and F) Single-cell CDK2 activity traces from MCF7 cells treated with 100 nM MEKi and 500 nM CDK4/6i for 7 days. At day 7, cells were washed to remove drugs and were treated with either DMSO (E) or 1 μM GSK3βi (F) when time-lapse imaging was started. (G) Bar graph depicting the percent of senescent cells that activated CDK2 activity and re-entered the cell cycle after treatment with a GSK3βi as described in (F). Data are represented as mean ± SD from two independent experiments. Example single-cell CDK2 traces can be found in Figure S5G. (H and I) Single-cell CDK2 activity traces from MCF7 cells exposed to 10 Gy γ-IR. At day 7, cells were treated with either DMSO (H) or 1 μM GSK3βi (I) when time-lapse imaging was started. (J) Bar graph depicting the percent of senescent cells that activated CDK2 activity and re-entered the cell cycle after treatment with a GSK3βi as described in (I). Data are mean ± SD from two biological replicates. p value was obtained from Student’s t test. Example single-cell CDK2 traces can be found in (H) and (I). (K) Quantification of SA-β Gal-positive and pRb-negative cells from Figure S6A treated with the indicated conditions. Data are represented as mean ± SD from three independent experiments. p values were obtained from one-way ANOVA with multiple-comparison test. ns, not statistically significant. (L) Quantification of SA-β Gal-positive and pRb-negative cells from Figure S6B treated with the indicated conditions. Data are represented as mean ± SD from three independent experiments. p values were obtained from one-way ANOVA with multiple-comparison test. ns, not significant. (M) Quantification of SA-β Gal-positive and pRb-negative cells from (K) and (L) treated with the indicated conditions as a function of time after treatment. Vertical line denotes time at which MEKi plus CDK4/6i or CDK4/6i alone were washed off. Cells continued to grow in media containing Dox (1 mM) for the shMYC+CDK4/6i treated cells until fixation. Data are represented as mean ± SD from three independent experiments. p values were obtained from one-way ANOVA with multiple-comparison test.
Figure 6.
Figure 6.. MYC loss is necessary to maintain replicative and oncogene-induced senescence
(A) Representative images of early-passage (P1) and late-passage (P7) primary mouse fibroblasts and late-passage fibroblasts treated with doxycycline (Dox) (2 μM) to induce MYCT58A (P7+MYCT58A). Cells were fixed and stained at the indicated times for SA-β Gal activity (green). Nuclei were stained with Hoechst (blue). Scale bar, 50 μm. (B) Violin plots of nuclear area (μm2) in the indicated conditions from (A). (C) Quantification of SA-β Gal-positive cells from (A). Data are represented as mean ± SD from two independent experiments. p values were obtained from one-way ANOVA with multiple-comparison test. ns, not significant. (D) Experimental setup (top) and representative images (bottom) of survival assay showing timeline starting with harvesting and culturing mouse fibroblasts fromC57 mice, then transfection with teton-MYCT58A construct, followed by several passages to induce replicative senescence (P7). Finally, doxycycline (Dox, 2 μM) was added to induce teton-MYCT58A expression. Cells were fixed and stained with crystal violet 10 days after Dox treatment. (E) Representative images of primary mouse fibroblasts, untreated (non-transduced), transduced with oncogenic RAS (v-RasHa), and oncogene-induced senescent fibroblasts treated with Dox (2 μM) to induce MYCT58A expression (v-RAS+ MYCT58A). Cells were fixed and stained at the indicated times for SA-β Gal activity (green). Nuclei were stained with Hoechst (blue). Scale bar, 50 μm. (F) Violin plots of nuclear area (μm2) in the indicated conditions from (E). (G) Quantification of SA-β Gal-positive cells from (E). Data are represented as mean ± SD from two independent experiments. p values were obtained from one-way ANOVA with multiple-comparison test. ns, not significant. (H) Experimental setup and representative images of survival assay showing timeline starting with harvesting and culturing mouse fibroblasts from C57 mice, then transduction with oncogenic RAS (v-RAS) to induce OIS and transfection with teton-MYCT58A construct. Finally, Dox (2 μM) was added to induce MYCT58A expression. Cells were fixed and stained with crystal violet 10 days after Dox treatment. (I) Representative images of primary mouse keratinocytes, untreated (non-transduced), transduced with oncogenic RAS (v-RAS), and oncogene-induced senescent keratinocytes treated with Dox (2 μM) to induce MYCT58A expression (v-RAS+ MYCT58A). Cells were fixed and stained at the indicated times for SA-β Gal activity (green). Nuclei were stained with Hoechst (blue). Scale bar, 50 μm. (J) Violin plots of nuclear area (μm2) in the indicated conditions from (I). (K) Quantification of SA-β Gal-positive cells from (I). Data are represented as mean ± SD from two independent experiments. p values were obtained from one-way ANOVA with multiple-comparison test. ns, not significant. (L) Experimental setup and representative images of a survival assay showing timeline starting with harvesting and culturing mouse keratinocytes from C57 mice, then transduction with oncogenic RAS (v-RAS) to induce OIS and transfection with teton-MYCT58A construct. Finally, Dox (2 μM) was added to induce MYCT58A expression. Cells were fixed and stained with crystal violet 10 days after Dox treatment.
Figure 7.
Figure 7.. MYC loss is associated with senescent cells in human oral dysplastic lesions
(A–D) Representative images of human oral tissue sections stained with H&E (left; scale bar, 100 μm; inset is 40× magnification) and immunohistochemical staining of MYC (right; scale bar, 100 μm; inset is 40× magnification). (A) Tissue section of a normal oral mucosa showing a fibrous tissue stroma covered by keratinized stratified squamous epithelium. The inset shows normal stratification of epithelial cells with no evidence of cellular atypia, and sporadic nuclear MYC expression in the basal cells while the suprabasal cell layer show negative MYC immunostaining. (B) Tissue section of a mild oral dysplasia showing fibrous tissue covered by keratinized, hyperplastic, stratified squamous epithelium. Basilar hyperplasia with loss of polarization is observed as shown in the inset. Immunohistochemical staining of the same tissue section shows negative MYC staining in the basal and suprabasal cell layer (pink arrow) compared with adjacent, normally behaving basal cells maintaining their proliferative phenotype as depicted by baseline MYC staining (black arrow). (C) Tissue section showing fibrous tissue covered by keratinized, hyperplastic, stratified squamous epithelium. The epithelium shows foci of mild dysplasia (pink inset). Basilar hyperplasia, loss of polarization, and loss of cell-to-cell adhesion are limited to the basal cell layer. MYC immunostaining of the same tissue section shows negative MYC staining in the basal and parabasal cell layer. Other foci show dysplastic malignant changes throughout the whole thickness of the epithelium (black inset) including nuclear hyperchromatism, cellular pleomorphism, and abnormal mitosis. (Right) Immunohistochemical staining of the same tissue section showing intense nuclear MYC staining. (D) Tissue section of oral squamous cell carcinoma (OSCC) showing fibrous tissue covered by severely dysplastic keratinized, squamous epithelium with multiple points of invasions of malignant epithelial cell strands infiltrating the underlying stroma. Inset is a higher magnification showing malignant epithelial cells exhibiting malignant criteria. (Right) Immunohistochemical staining of the same tissue section showing strong nuclear and cytoplasmic MYC staining in the malignant epithelial cells infiltrating the underlying fibrous tissue stroma. (E–G) Quantification of various parameters from tissue sections shown in (A)–(D) including MYC intensity (H-score) (E), average cell area (μm2) (F), and average cytoplasmic-to-nuclear area ratio (G). Data are represented as mean ± SD. p values were obtained from one-way ANOVA with multiple-comparison test. (H and I) Violin plot of Ki67 (H) and phospho-p38 (I) levels using GeoMx digital spatial profiling. Each dot represents a region of interest (ROI) from the indicated tissue type. (J) Scatterplot of Ki67 and phospho-p38 levels from the same ROI. Center point is the mean Ki67 and phospho-p38 levels for all the ROIs of the indicated tissue type. Center circle represents SEM and lines represent SD. (K) Schematic diagram of our model of cellular senescence entry and maintenance. In response to various stresses, cells enter senescence via MYC transcriptional repression but maintain their senescence state by constitutively degrading MYC.

References

    1. Di Leonardo A, Linke SP, Clarkin K, and Wahl GM (1994). DNA damage triggers a prolonged p53-dependent G1 arrest and long-term induction of Cip1 in normal human fibroblasts. Genes Dev. 8, 2540–2551. 10.1101/gad.8.21.2540. - DOI - PubMed
    1. Sedelnikova OA, Horikawa I, Zimonjic DB, Popescu NC, Bonner WM, and Barrett JC (2004). Senescing human cells and ageing mice accumulate DNA lesions with unrepairable double-strand breaks. Nat. Cell Biol 6, 168–170. 10.1038/ncb1095. - DOI - PubMed
    1. Hayflick L, and Moorhead PS (1961). The serial cultivation of human diploid cell strains. Exp. Cell Res 25, 585–621. 10.1016/0014-4827(61)90192-6. - DOI - PubMed
    1. Bodnar AG, Ouellette M, Frolkis M, Holt SE, Chiu CP, Morin GB, Harley CB, Shay JW, Lichtsteiner S, and Wright WE (1998). Extension of life-span by introduction of telomerase into normal human cells. Science 279, 349–352. 10.1126/science.279.5349.349. - DOI - PubMed
    1. Collado M, Blasco MA, and Serrano M. (2007). Cellular senescence in cancer and aging. Cell 130, 223–233. 10.1016/j.cell.2007.07.003. - DOI - PubMed

Publication types

Substances