. 2023 Sep;9(35):eadh1168.
doi: 10.1126/sciadv.adh1168. Epub 2023 Sep 1.

The cellular response to extracellular vesicles is dependent on their cell source and dose

Affiliations

The cellular response to extracellular vesicles is dependent on their cell source and dose

Daniel W Hagey et al. Sci Adv. 2023 Sep.

Abstract

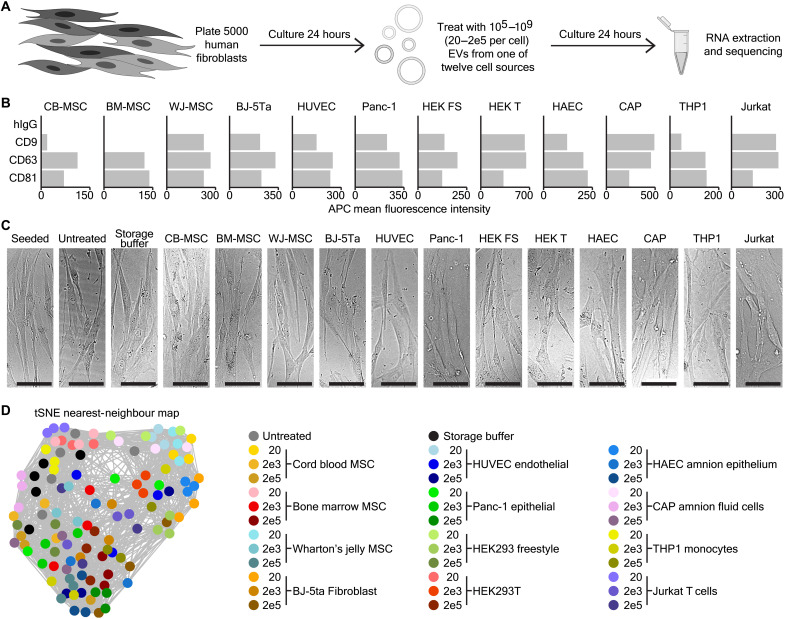
Extracellular vesicles (EVs) have been established to play important roles in cell-cell communication and shown promise as therapeutic agents. However, we still lack a basic understanding of how cells respond upon exposure to EVs from different cell sources at various doses. Thus, we treated fibroblasts with EVs from 12 different cell sources at doses between 20 and 200,000 per cell, analyzed their transcriptional effects, and functionally confirmed the findings in various cell types in vitro, and in vivo using single-cell RNA sequencing. Unbiased global analysis revealed EV dose to have a more significant effect than cell source, such that high doses down-regulated exocytosis and up-regulated lysosomal activity. However, EV cell source-specific responses were observed at low doses, and these reflected the activities of the EV's source cells. Last, we assessed EV-derived transcript abundance and found that immune cell-derived EVs were most associated with recipient cells. Together, this study provides important insights into the cellular response to EVs.


Figures

Fig. 1.
Fig. 1.. RNA sequencing of fibroblasts treated with 12 EV types at three doses.
(A) Schematic depicting the experimental design of EV treatment and RNA sequencing. (B) Multiplex bead–based flow cytometry analysis of control [immunoglobulin G (IgG)] and common EV tetraspanin markers (CD9, CD63, and CD81) capture beads using a pan-tetraspanin antibody mix for detection. (C) Bright-field images showing representative fibroblasts after seeding and untreated, or treated with storage buffer or 20,000 EVs derived from one of 12 different cell types, after 24 hours in culture. Scale bars, 100 μm. (D) tSNE-NN map of the fibroblast RNA sequencing data. This includes five untreated and five storage buffer–treated samples as controls, as well as triplicates from all EV treatment experiments at doses of 20, 2000, or 200,000 particles per cell.
Fig. 2.
Fig. 2.. EV treatment dose determines fibroblast transcriptomic responses.
(A and C) tSNE-NN map from Fig. 1C with samples colored by Infomap cluster identity (A), EV cell type group (B), or EV dose per cell (C) fibroblast samples were treated with. (D) Overlap enrichment scores between samples’ Infomap cluster identity and EV cell type group (left) or treatment dose (right). (E) Gene ontology term fold enrichment for genes up-regulated in control over cells treated with 200,000 EVs (white), 20 over 200,000 EV-treated cells (light gray), 200,000 over 20 EV-treated cells (dark gray), or 200,000 EV treated over control cells (darkest gray). P values for statistically significant terms are inset and negative values without fold change listed show no enrichment. (F) Schematic depicting the experimental design of exocytosis assays. (G) Violin plots of luciferase signals from CD63:ThermoLuc HEK cell EVs in media of untreated cells or those treated with 200, 2000, or 20,000 wild-type HEK EVs per cell (n = 4). Sample mean is shown as a large solid dot, SE as a horizontal line, and individual data points as rings, with statistics performed as two-tailed, unpaired t tests and P values displayed.
Fig. 3.
Fig. 3.. Low doses of EVs produce unique transcriptional responses, while high doses induce lysosomal activity.
(A) Violin plots of the raw number of significantly up- and down-regulated genes between control fibroblasts and those treated with each EV type at doses of 20, 2000, or 200,000 EVs per cell. Sample mean is shown as a large solid dot, SE as a horizontal line, and individual data points as rings. (B) Overlap enrichment scores of genes up- and down-regulated by the different EV types at doses of 20, 2000, or 200,000 EVs per cell. (C) Gene ontology term fold enrichment for genes up- or down-regulated by ≥5 EV types when treated with 20 (white and light gray) or 200,000 (dark gray and darkest gray) EVs per cell. P values for statistically significant terms are inset in bars. Values beside bars with hash marks show their fold enrichment beyond the graph scale, while negative bars with hash marks and no value represent no enrichment. (D) Representative microscopy images of LAMP1 immunostaining in HEK and CAP EV–treated fibroblasts at 24 hours. The diffraction-limited image of each spot is depicted, followed by the STORM image of the corresponding area and a zoom-in to the area indicated with the white rectangle. LAMP1 is shown in orange and green fluorescent protein (GFP)–EVs (only visualized in diffraction-limited mode) in green. Scale bars, 5 μm in diffraction-limited and full-view STORM images and 1 μm in STORM zoom-in images. (E) Violin plots of the LAMP1-labeled lysosomal area, as measured by STORM microscopy, in untreated fibroblasts (n = 6), or those treated with HEK or CAP (n = 3) cell–derived EVs at doses of 20, 2000, or 200,000 per cell. Statistics were performed by Wilcoxon signed-rank tests with Bonferroni correction for multiple comparisons, with significant values above control shown in (E).
Fig. 4.
Fig. 4.. High doses of EVs activate lysosomal and repress membrane trafficking genes in vivo.
(A) Schematic depicting CD63-mNG HEK293 freestyle EV injection, liver dissection, and single-cell RNA-sequencing experiment. (B) FACS dot plots and gating of single-cell mNeonGreen levels generated during cell sorting of control and EV-injected mouse liver (n = 2). (C) Single-cell RNA-sequencing tSNE-NN maps colored on the basis of the expression of a hepatocyte (ASGR1), Kuppfer (CD14), or endothelial cell (EDNRB) marker. (D) Histogram showing cell’s ratios of human to mouse mapped reads and the cutoffs (red lines) used to separate populations of cells having taken up low, medium low, medium high, and high numbers of EVs. (E and F) tSNE-NN maps colored on the basis of cell’s human to mouse mapped reads group (E) or Infomap cluster identity (F). (G) Overlap enrichment scores between cells’ Infomap cluster identity and human to mouse mapped reads group. (H) Gene ontology term fold enrichment for genes up-regulated in high (dark gray) or low (light gray) human to mouse mapped reads cells.
Fig. 5.
Fig. 5.. EVs produce transcriptional responses reflective of their cell source.
(A) tSNE-NN map of control and 20 EV per cell treated fibroblast transcriptomes colored by the cell source group of the EVs they were treated with or by their Infomap cluster. (B) Overlap enrichment scores between samples’ Infomap cluster identity and the EV cell type group they were treated with. (C) Numbers of genes significantly up- or down-regulated by each type of EV at more than one dose and their cell source group. (D) Gene ontology term fold enrichment for genes robustly up-regulated in fibroblasts by each of the EV types, colored on the basis of their cell source group and ordered according to (C). P values for statistically significant terms are inset and negative values without fold change listed show no enrichment. (E) Bright-field images of HUVEC cells during the invasion assay. Scale bars, 100 μm. (F) Quantification of the number of branches formed by HUVEC cells exposed to EVs from different cell sources (n = 14 to 17). (G) Quantification of cell proliferation in HUVEC cells exposed the EVs from different cell sources (n = 8). Sample mean is shown as a large solid dot, SE as a horizontal line, and individual data points as rings, with statistics performed as two-tailed, unpaired t tests.
Fig. 6.
Fig. 6.. EV-derived transcripts from different source cells vary in their associations with recipient cells.
(A) tSNE-NN map of EV transcriptomes colored by their cell source group or Infomap cluster. (B) Overlap enrichment scores between EV’s Infomap clusters and cell source group. (C) Numbers of genes repeatedly enriched or depleted in each EV type when compared with at least three other EV types. (D) Violin plots of the fold difference in fibroblast expression of transcripts highly abundant in each type of EV over their basal levels in control fibroblasts, when treated with 20, 2000, or 200,000 EVs per cell. Sample mean is shown as a large solid dot, SE as a horizontal line, and individual data points as rings. Best fit line is overlaid in red, with the slope of each line displayed below.

References

    1. Valadi H., Ekström K., Bossios A., Sjöstrand M., Lee J. J., Lötvall J. O., Exosome-mediated transfer of mRNAs and microRNAs is a novel mechanism of genetic exchange between cells. Nat. Cell Biol. 9, 654–659 (2007). - PubMed
    1. Skog J., Würdinger T., van Rijn S., Meijer D. H., Gainche L., Sena-Esteves M., Curry W. T. Jr., Carter B. S., Krichevsky A. M., Breakefield X. O., Glioblastoma microvesicles transport RNA and proteins that promote tumour growth and provide diagnostic biomarkers. Nat. Cell Biol. 10, 1470–1476 (2008). - PMC - PubMed
    1. Hagey D. W., Kordes M., Görgens A., Mowoe M. O., Nordin J. Z., Moro C. F., Löhr J.-M., El Andaloussi S., Extracellular vesicles are the primary source of blood-borne tumour-derived mutant KRAS DNA early in pancreatic cancer. J. Extracell. Vesicles 10, e12142 (2021). - PMC - PubMed
    1. Gupta D., Wiklander O. P. B., Görgens A., Conceição M., Corso G., Liang X., Seow Y., Balusu S., Feldin U., Bostancioglu B., Jawad R., Mamand D. R., Lee Y. X. F., Hean J., Mäger I., Roberts T. C., Gustafsson M., Mohammad D. K., Sork H., Backlund A., Lundin P., de Fougerolles A., Smith C. I. E., Wood M. J. A., Vandenbroucke R. E., Nordin J. Z., El-Andaloussi S., Amelioration of systemic inflammation via the display of two different decoy protein receptors on extracellular vesicles. Nat. Biomed. Eng. 5, 1084–1098 (2021). - PubMed
    1. Hurwitz S. N., Rider M. A., Bundy J. L., Liu X., Singh R. K., Meckes D. G. Jr., Proteomic profiling of NCI-60 extracellular vesicles uncovers common protein cargo and cancer type-specific biomarkers. Oncotarget 7, 86999–87015 (2016). - PMC - PubMed

LinkOut - more resources