. 2024 Jan 4;147(1):186-200.
doi: 10.1093/brain/awad293.

Inhibiting metabotropic glutamate receptor 5 after stroke restores brain function and connectivity

Affiliations

Inhibiting metabotropic glutamate receptor 5 after stroke restores brain function and connectivity

Jakob Hakon et al. Brain. .

Abstract

Stroke results in local neural disconnection and brain-wide neuronal network dysfunction leading to neurological deficits. Beyond the hyper-acute phase of ischaemic stroke, there is no clinically-approved pharmacological treatment that alleviates sensorimotor impairments. Functional recovery after stroke involves the formation of new or alternative neuronal circuits including existing neural connections. The type-5 metabotropic glutamate receptor (mGluR5) has been shown to modulate brain plasticity and function and is a therapeutic target in neurological diseases outside of stroke. We investigated whether mGluR5 influences functional recovery and network reorganization rodent models of focal ischaemia. Using multiple behavioural tests, we observed that treatment with negative allosteric modulators (NAMs) of mGluR5 (MTEP, fenobam and AFQ056) for 12 days, starting 2 or 10 days after stroke, restored lost sensorimotor functions, without diminishing infarct size. Recovery was evident within hours after initiation of treatment and progressed over the subsequent 12 days. Recovery was prevented by activation of mGluR5 with the positive allosteric modulator VU0360172 and accelerated in mGluR5 knock-out mice compared with wild-type mice. After stroke, multisensory stimulation by enriched environments enhanced recovery, a result prevented by VU0360172, implying a role of mGluR5 in enriched environment-mediated recovery. Additionally, MTEP treatment in conjunction with enriched environment housing provided an additive recovery enhancement compared to either MTEP or enriched environment alone. Using optical intrinsic signal imaging, we observed brain-wide disruptions in resting-state functional connectivity after stroke that were prevented by mGluR5 inhibition in distinct areas of contralesional sensorimotor and bilateral visual cortices. The levels of mGluR5 protein in mice and in tissue samples of stroke patients were unchanged after stroke. We conclude that neuronal circuitry subserving sensorimotor function after stroke is depressed by a mGluR5-dependent maladaptive plasticity mechanism that can be restored by mGluR5 inhibition. Post-acute stroke treatment with mGluR5 NAMs combined with rehabilitative training may represent a novel post-acute stroke therapy.

Keywords: long term depression; pharmacological therapy; plasticity; resting-state functional connectivity; stroke recovery.


Conflict of interest statement

T.W., R.O., K.R. and C.S. are co-inventors on a patent related to the content of this article. The other authors report no competing interests.

Figures

Figure 1
Figure 1
Inhibition of mGluR5 improves lost sensorimotor function after photothrombotic stroke in rats. (A) The study design. (B) Serial coronal NeuN stained sections of representative brains from Vehicle- (left) and MTEP- (right) treated rats subjected to photothrombotic (PT)-stroke. Cortical infarct is indicated by an asterisk. (C) Paw placement score at 2 days after PT-stroke and 1, 2 and 3 h and 3 days after the first injection (Vehicle, n = 9; MTEP, n = 11) [Kruskal–Wallis test with a post hoc Dunn’s multiple comparison (MC) test; **P < 0.01; bar denotes median]. (D) Paw placement at 2, 7 and 14 days after PT-stroke (Kruskal–Wallis test with a post hoc Dunn’s MC test; *P < 0.01, **P < 0.01, ***P < 0.001; bar denotes median). (E) Mean volume of infarct (mm3) assessed 14 days after stroke in Vehicle- (n = 9) or MTEP- (5 mg/kg, i.p., n = 11) treated rats (unpaired two-tailed t-test; bar denotes mean). (F) Paw placement in MTEP-treated animals 7 days and after an additional 7 days without (off) treatment compared to Vehicle (Kruskal–Wallis test with a post hoc Dunn’s MC test; *P < 0.05; bar denotes median). (G and H) Adhesive removal test. (G) Mean time (s) to mark and (H) mean time (s) to remove an adhesive on the left forepaw of Vehicle- (n = 7) or MTEP- (n = 8) treated rats; one-way ANOVA with a post hoc Sidak’s MC test; *P < 0.05, **P < 0.01; bar denotes mean. (I) Grip test. Mean grip force of right paw in % of pre-stroke force levels (Vehicle, n = 7; MTEP, n = 8); one-way ANOVA with a post hoc Sidak’s MC test; **P < 0.01; bar denotes mean. d = days.
Figure 2
Figure 2
Inhibition of mGluR5 enhances recovery of sensorimotor function in the endothelin-1 middle cerebral artery occlusion model of stroke in rats. (A) Nissl-stained coronal sections of rat brains displaying brain infarcts (asterisk) caused by endothelin-1 (ET-1) injected onto the middle cerebral artery in Vehicle- or MTEP-treated rats. (B) Mean volume of infarct (mm3) (t-test; bar denotes mean) and (C) paw placement score at 11 days after stroke (Vehicle, n = 9; MTEP, n = 8; Kruskal–Wallis test with a post hoc Dunn’s multiple comparison test; *P < 0.05; bar denotes median). (D and E) Foot faults (% of total number of steps) on an elevated beam after daily (D) Vehicle- (n = 9) or (E) MTEP- (5 mg/kg, i.p., n = 8) treatment (paired t-test; *P < 0.05). The laterality index obtained from the postural hang reflex test after daily treatment with (F) Vehicle (n = 7) or (G) MTEP (5 mg/kg, i.p., n = 6) (Wilcoxon’s matched-paired signed test; *P < 0.05). d = days.
Figure 3
Figure 3
Inhibition of mGluR5 improves lost sensorimotor function after photothrombotic stroke in mice. (A) Serial coronal mouse brain slices from Vehicle- and MTEP-treated stroke groups at 14 days after photothrombotic (PT)-stroke. Asterisk indicates infarct. (B) Mean volume of infarct (mm3) (unpaired two-tailed t-test; bar denotes mean) and (C) paw placement score in Vehicle- (n = 9) or MTEP- (5 mg/kg, i.p., n = 9) treated mice at 7 and 14 days after stroke [Kruskal–Wallis test with a post hoc Dunn’s multiple comparison (MC) test; **P < 0.01, ***P < 0.001; bar denotes median]. (D) Paw placement score of female mice at 7 days after stroke treated with Vehicle (n = 5) or MTEP (5 mg/kg, i.p., n = 5) (Mann–Whitney test; ***P < 0.001; bar denotes median). (E) Paw placement score at 10 and 16 days after stroke in mice treated daily with Vehicle (n = 5) or MTEP (5 mg/kg, i.p., n = 5) starting on Day 10 after stroke. All mice had a score of 2 before stroke induction. (Kruskal–Wallis test with a post hoc Dunn’s MC test; ***P < 0.001; bar denotes median). (F) Foot fault test. Percentage of faults by Vehicle- (n = 8) or MTEP-treated mice (5 mg/kg, i.p. daily, n = 8) at 2 and 14 days after stroke (one-way ANOVA with a post hoc Sidak’s MC test; *P < 0.05, **P < 0.01, ***P < 0.001; bar denotes mean). (G) Paw placement score of animals in F (Kruskal–Wallis test with a post hoc Dunn’s MC test; ***P < 0.001; bar denotes median). (H) Paw placement score at 7 days after PT-stroke of mice treated daily with Vehicle (n = 4), AFQ056 (n = 5; 30 mg/kg, p.o., n = 5) or fenobam (30 mg/kg p.o.; n = 6; Kruskal–Wallis test with a post hoc Dunn’s MC test; *P < 0.05; bar denotes median). (I) Mean volume of infarct (mm3) of animals reported in H. No difference between groups was found (one-way ANOVA; bar denotes mean). d = days.
Figure 4
Figure 4
mGluR5 is involved in multisensory assisted recovery of sensorimotor function after stroke in mice. (A) Daily pretreatment with the mGluR5 positive allosteric modulator VU360172 (30 mg/kg p.o. daily, n = 5) 1 h prior to MTEP (5 mg/kg, i.p.) prevents the recovery enhancing effect of MTEP (n = 5) compared to Vehicle (n = 6) at 7 days post stroke. [Kruskal–Wallis test with a post hoc Dunn’s multiple comparison (MC) test; *P < 0.05, **P < 0.01; bar denotes median]. (B) Mean volume of infarct (mm3) of animals in A. No difference between groups was found (one-way ANOVA; bar denotes mean). (C) Genetic deletion of mGluR5 mimics treatment with MTEP. Wild-type (WT) mice were treated with Vehicle (n = 5) or MTEP (n = 7) and mGluR5 knock-out (KO) mice treated with Vehicle (n = 4) or MTEP (n = 5) from 2 to 7 days post-stroke (Kruskal–Wallis test with a post hoc Dunn’s MC test; *P < 0.05, **P < 0.01; bar denote median). (D) Mean volume of infarct (mm3) of animals in C. No difference between groups was found (one-way ANOVA; bar denotes mean). (E) The recovery enhancing effect of enriched environment (EE) at 7 days post-stroke (n = 8) is prevented by concomitant treatment with VU360172 (30 mg/kg p.o., n = 7) for 5 days (Kruskal–Wallis test with a post hoc Dunn’s MC test *P < 0.05, ***P < 0.001; bar denotes median). (F) Volume of infarct (mm3) of animals in E. No difference between groups was found (one-way ANOVA; bar denotes mean). (G) Paw placement score of mice subjected to photothrombotic (PT) stroke and treated daily with MTEP (1 mg/kg i.p., n = 5) and concomitantly housed in either standard cages (STD) or in an enriched environment (EE) (n = 5) from 2 to 7 days post-stroke display an additive recovery effect of the combination treatment (MTEP + EE, n = 5) (Kruskal–Wallis test with a post hoc Dunn’s MC test; *P < 0.05, **P < 0.01; bar denotes median).
Figure 5
Figure 5
Inhibition of mGluR5 improves functional brain organization following stroke. (A) Field of view of optical intrinsic signal imaging system used for mapping functional connectivity in the mouse with and without stroke. Coloured parcels indicate assignments according to the Paxinos mouse brain atlas. The infarct is indicated in the left hemisphere. (BD) Group-averaged, whole-cortex correlation matrices for (B) control mice (i.e. sham mice treated with Vehicle, n = 5) and 14 days after photothrombotic (PT)-stroke for (C) mice treated with Vehicle (n = 10) or (D) mice treated with MTEP (n = 10). Group level correlation matrices show all pairwise resting state functional connectivity (RSFC) within our field of view. Matrices are grouped by functional assignment and organized by hemisphere (left, ipsilesional; right contralesional). Difference correlation matrix (MTEP minus Vehicle) shows the group-averaged correlation differences between the MTEP- and Vehicle-treated groups. (E) After PT-stroke, MTEP-treated mice exhibit higher intrahemispheric RSFC within contralesional somatosensory, motor and surrounding cortices (box 1), ipsilesional (box 2) and contralesional (box 3) visual cortices, and stronger homotopic RSFC in visual regions (box 4). Further, larger anticorrelations between anterior-posterior brain regions were also more pronounced in MTEP-treated mice compared with Vehicle-treated mice (box 5). All matrices are reported as Fisher z-scores. (F) Eigenspectrum following spatial principal component analysis (PCA) of the group-level correlation difference matrix in E. Blue dots represent the variance explained by the first 10 PCs, plotted in descending order according to their contribution to the overall eigenspectrum. Extensive permutation resampling (3000 iterations) of all mice between groups was used to determine the amount of variance explained by the first eigenvalue in the null case. The orange dots represent the average variance explained by individual PCs across all 3000 iterations, while the shaded orange region represents the 95th percentile of the null distribution for each PC. In the true eigenspectrum (i.e. RSFC differences between MTEP PT and Vehicle PT mice), the variance explained by PC1 was in the 97.45th percentile (i.e. P = 0.0255) and was considered statistically significant. (G) Topography of PC1 reveals increased, positive, contralateral functional connectivity in motor and sensory regions, as well as increased anticorrelations between anterior-posterior brain regions.
Figure 6
Figure 6
MTEP treatment results in functional brain topology comparable to pre-stroke organization. (A) Map of principal component 1 (PC1) from Fig. 5G with overlays of the photothrombotic (PT) infarct (black oval) and functional network nodes in our field of view. Node locations (all circles) were determined by the centre of mass of each functional region as per the Paxinos atlas in Fig. 5A. Larger white filled circles indicate brain nodes used for graph analysis, and determined by being outside of direct injury and within the top 30th percentile of all pixels in PC1 (i.e. to select for only those nodes associated with the largest group-wise differences). (B) Local and global functional network topology was assessed through graph measures of the weighted, undirected clustering coefficient and shortest path length across nodes. Functional network properties were averaged across nodes to get a local and global measure of brain organization for each mouse in each group. Following stroke, Vehicle-treated mice exhibited significant disruption in clustering coefficient (P < 0.01) and average path length (P < 0.001) compared with controls. Conversely, MTEP-treated mice exhibited higher clustering coefficient (P < 0.05) and lower path length (P < 0.05) compared to Vehicle-treated mice and had a clustering coefficient (P > 0.05) and path length (P > 0.05) indistinguishable from sham mice (one-way ANOVA, followed by false discovery rate correction). d = days.
Figure 7
Figure 7
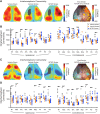
Inhibition of mGluR5 increases intra- and interhemispheric functional connection density. Intrahemispheric node degree was quantified for each pixel as the number of functional connections within the ipsilateral hemisphere having a positive correlation coefficient [z(r) > 0] (see text). (A) Group-averaged maps of weighted intrahemispheric node degree in the Vehicle sham and stroke groups (Vehicle stroke and MTEP stroke) 14 days after photothrombotic (PT)-stroke. Prior to stroke high node degree is observed over both hemispheres, with higher intrahemispheric connectivity (reds) within somatosensory and motor cortices, and parts of visual cortex. Following stroke, large reductions in ipsilateral node degree are clearly observed around the infarct core in regions surrounding the infarct in both groups. Difference maps reveals that MTEP treatment after PT-stroke resulted in significantly increased node degree over large portions of contralateral motor and sensory regions compared to sham and Vehicle. (B) Quantification of node degree in regions defined by atlas assignments in the Vehicle sham and stroke groups. Compared to Vehicle-treated sham, stroke Vehicle mice exhibited reduced intrahemispheric node degree in peri-lesional regions [primary motor (M1); anterior posterior secondary motor (M2a); somatosensory forelimb (SFL); somatosensory hindlimb (SHL); posterior secondary motor (M2p)]. Treatment with MTEP after stroke significantly increased intrahemispheric node degree in contralesional primary motor and somatosensory regions compared with Vehicle. Horizontal lines above bars indicate significant differences, P < 0.05 (two-way ANOVA, followed by false discovery rate correction). Data are available in Supplementary Table 1. (C) Intrahemispheric node degree was quantified for each pixel as the number of functional connections within the contralateral hemisphere having a positive correlation coefficient [z(r) > 0] (see text). Cortical disruptions in interhemispheric node degree were largely similar across treatment groups. However, Vehicle-treated mice exhibited higher interhemispheric node degree in right parietal and posterior somatosensory regions, while in the left visual cortex, significantly higher node-degree was observed in the MTEP group statistically indistinguishable from sham animals. (D) Quantification of node degree in regions defined by atlas assignments in the Vehicle sham and stroke groups. Compared with Vehicle-treated sham, stroke Vehicle mice exhibited reduced interhemispheric node degree across both hemispheres. There was no difference in interhemispheric node degree between the stroke groups. Horizontal bars indicate significant differences, P < 0.05; two-way ANOVA, followed by false discovery rate correction. Data are available in Supplementary Table 2. M1 = primary motor; M2a = anterior posterior secondary motor; SFL = somatosensory forelimb; SHL = somatosensory hindlimb; SBA = somatosensory barrel; M2p = posterior secondary motor; PP = posterior parietal; RS = retrosplenial; VIS = visual cortex.
Figure 8
Figure 8
Increased functional connectivity in contralateral sensorimotor cortex after inhibition of mGluR5 is not associated with changes in tissue levels of mGluR5. (A) Levels of mGluR5 in sensorimotor cortex analysed by western blotting in (B) Sham group (n = 4) and mice subjected to photothrombotic (PT)-stroke and 14 days of recovery and treated with Vehicle (n = 5) and MTEP (n = 5). No significant differences were found among groups [one-way analysis of variance (ANOVA); bar denotes mean]. (C) Paw placement score of mice used in B [Kruskal–Wallis test with a post hoc Dunn’s multiple comparison (MC) test; *P < 0.05; bar denotes median]. (D) Homogenates were generated from cortex of the contralateral hemisphere from deceased stroke patients and non-stroke subjects (for details see Supplementary Table 3). There is no difference in the levels of mGluR5 between the groups (one-way ANOVA; bar denotes mean). (E) Formation of mGluR5-mediated inositol phosphate [3H]InsP in brain slices prepared from the contralateral sensorimotor cortex in control mice (n = 9) and mice after PT-stroke and 14 days of recovery and treated with Vehicle (n = 9) or MTEP (n = 9). No significant differences were found among groups (one-way ANOVA; bar denotes mean). (F) Paw placement score of mice used in E (Kruskal–Wallis test with a post hoc Dunn’s MC test; ***P < 0.001; bar denotes median). d = days; M = MTEP; Sh = Sham; Vh = Vehicle.

References

    1. Feigin VL, Stark BA, Johnson CO, et al. . Global, regional, and national burden of stroke and its risk factors, 1990–2019: A systematic analysis for the global burden of disease study 2019. Lancet Neurol. 2021;20:795–820. - PMC - PubMed
    1. van der Vliet R, Selles RW, Andrinopoulou ER, et al. . Predicting upper limb motor impairment recovery after stroke: A mixture model. Ann Neurol. 2020;87:383–393. - PMC - PubMed
    1. Carey LM, Matyas TA. Frequency of discriminative sensory loss in the hand after stroke in a rehabilitation setting. J Rehabil Med. 2011;43:257–263. - PubMed
    1. Winstein CJ, Stein J, Arena R, et al. . Guidelines for adult stroke rehabilitation and recovery: A guideline for healthcare professionals from the American Heart Association/American Stroke Association. Stroke. 2016;47:e98–e169. - PubMed
    1. Lin DJ, Finklestein SP, Cramer SC. New directions in treatments targeting stroke recovery. Stroke. 2018;49:3107–3114. - PMC - PubMed

Publication types

Substances