. 2023 Sep:95:104778.
doi: 10.1016/j.ebiom.2023.104778. Epub 2023 Aug 30.

Dysregulated anti-oxidant signalling and compromised mitochondrial integrity negatively influence regulatory T cell function and viability in liver disease

Affiliations

Dysregulated anti-oxidant signalling and compromised mitochondrial integrity negatively influence regulatory T cell function and viability in liver disease

Trishan Vaikunthanathan et al. EBioMedicine. 2023 Sep.

Abstract

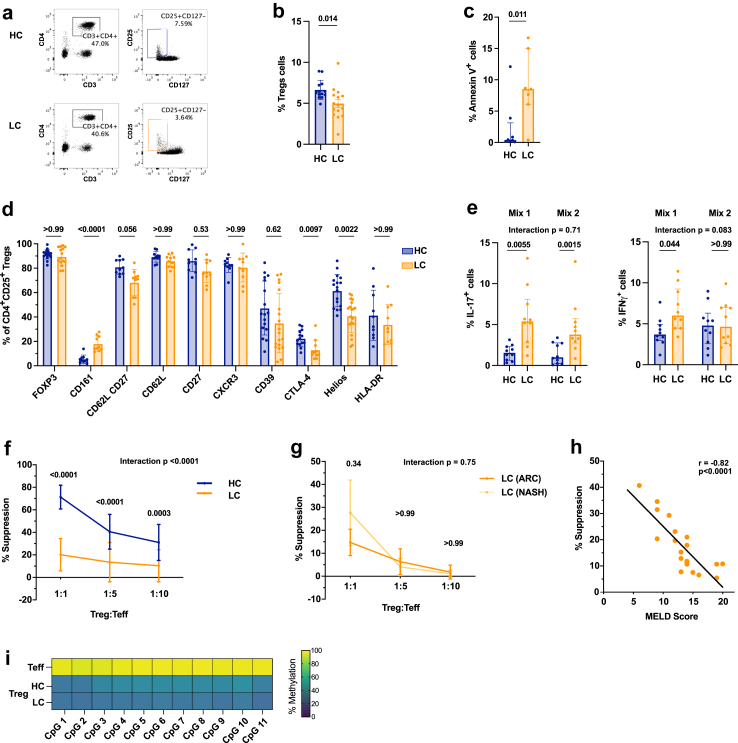
Background: Dysregulated inflammatory responses and oxidative stress are key pathogenic drivers of chronic inflammatory diseases such as liver cirrhosis (LC). Regulatory T cells (Tregs) are essential to prevent excessive immune activation and maintain tissue homeostasis. While inflammatory cues are well known to modulate the function and stability of Tregs, the extent to which Tregs are influenced by oxidative stress has not been fully explored.

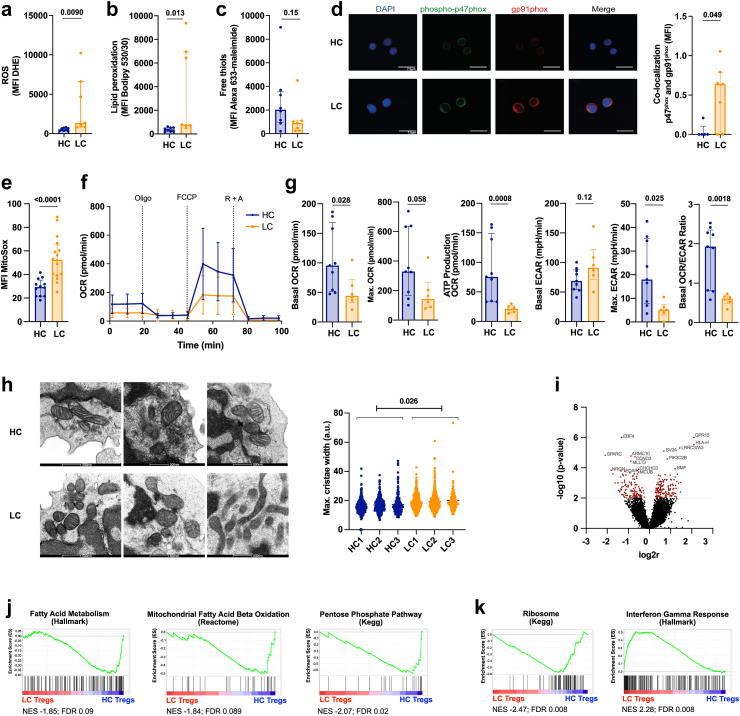
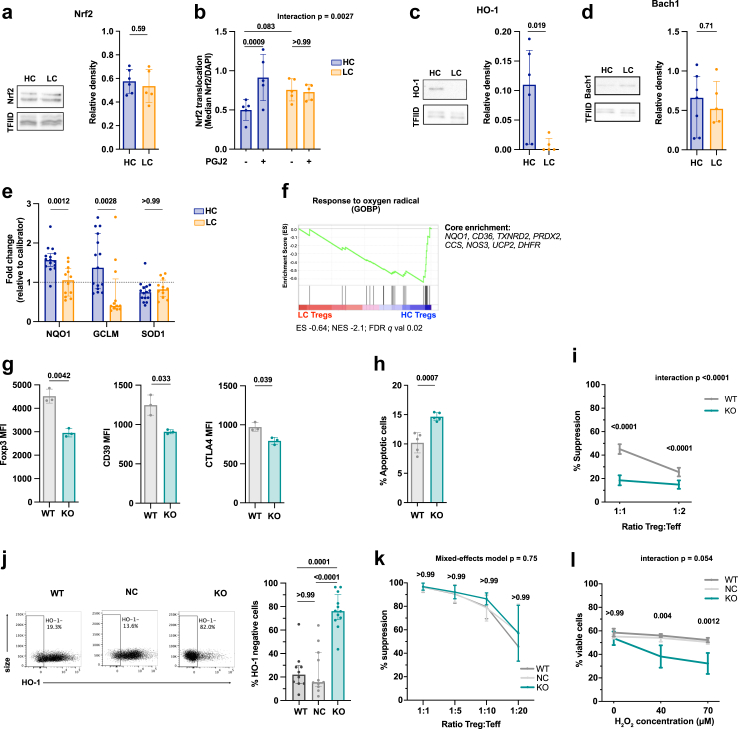
Methods: The phenotypic and functional properties of CD4+CD25+CD127lo/- Tregs isolated from patients with LC were compared to healthy controls (HC). Treg redox state was investigated by characterizing intracellular reactive oxygen species (ROS), NADPH oxidase-2 (Nox2) activity, mitochondrial function, morphology, and nuclear factor-erythroid 2-related factor (Nrf2) antioxidant signalling. The relevance of Nrf2 and its downstream target, Heme-oxygenase-1 (HO-1), in Treg function, stability, and survival, was further assessed using mouse models and CRISPR/Cas9-mediated HO-1 knock-out.

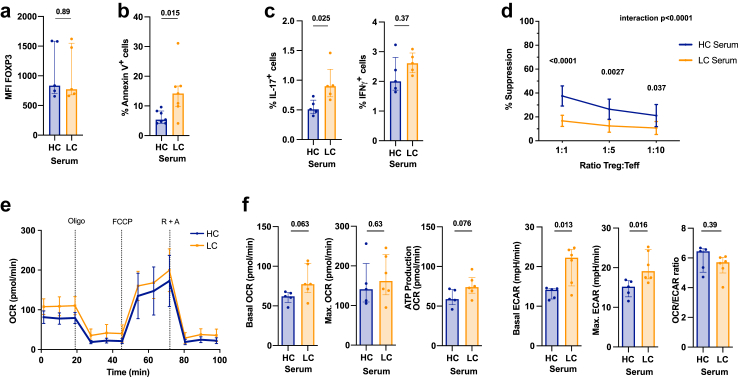
Findings: Circulating Tregs from LC patients displayed a reduced suppressive function, correlating with liver disease severity, associated with phenotypic abnormalities and increased apoptosis. Mechanistically, this was linked to a dysregulated Nrf2 signalling with resultant lower levels of HO-1, enhanced Nox2 activation, and impaired mitochondrial respiration and integrity. The functional deficit in LC Tregs could be partially recapitulated by culturing control Tregs in patient sera.

Interpretation: Our findings reveal that Tregs rely on functional redox homeostasis for their function, stability, and survival. Targeting Treg specific anti-oxidant pathways may have therapeutic potential to reverse the Treg impairment in conditions of oxidative damage such as advanced liver disease.

Funding: This study was funded by the Wellcome Trust (211113/A/18/Z).

Keywords: Liver cirrhosis; Mitochondria; Nrf2/heme oxygenase-1; Oxidative stress; Redox homeostasis; Regulatory T cells.


Conflict of interest statement

Declaration of interests TV is currently employed by Janssen-Cilag Ltd (a subsidiary of Johnson & Johnson) and owns Johnson & Johnson stock/stock options. GL, ASF and MML are Founders of Quell Therapeutics Ltd. MR and MML are employed by Quell Therapeutics Ltd. PN received funding from Novo Nordisk; is advisory board member and received consulting fees from Novo Nordisk, Boehringer Ingelheim, Gilead, Intercept, Poxel Pharmaceuticals, BMS, Pfizer, Sun Pharma, Madrigal, GSK; speakers fees from Novo Nordisk, AiCME; and travel support from Novo Nordisk. The authors declare that the research in this manuscript was conducted in the absence of any commercial or financial relationships that could be construed as a potential conflict of interest.

Figures

Fig. 1
Fig. 1
Circulating Tregs from LC patients are reduced in number and show phenotypic instability and functional impairment. a. Representative flow cytometry plots and b. summary (%) of CD3+CD4+CD25+CD127lo/- Tregs in PBMCs of healthy controls (HC) and stable liver cirrhosis (LC) patients. HC n = 13, LC n = 15; unpaired t-test. Mean (SD). c. Proportion of Annexin V+ Tregs in HC and LC patients. HC n = 8, LC n = 7; unpaired t-test following log10 transformation. Median (IQR). d. Proportion (%) of CD4+CD25+CD127lo/- Tregs in HC and LC PBMCs expressing different phenotypic markers. HC n = 10–17, LC n = 10–19; multiple unpaired t-tests with Bonferroni adjustment following log10 transformation. Median (IQR). e. Percentage of IL-17+FoxP3+ Tregs (left) and IFNγ+FoxP3+ Tregs (right) of HC and LC following a 5-day culture in pro-inflammatory cytokines (Mix 1: IL-2, IL-1β, IL-6, TGF-β. Mix 2: IL-2, IL-21, IL-23, TGF-β). HC/LC n = 10; Two-way repeated measures ANOVA with Bonferroni's correction for multiple pairwise comparison tests following log10 transformation. Median (IQR). f. Suppressive function of freshly isolated HC and LC Tregs to inhibit third party CD4+CD25- effector T cell (Teff) proliferation at different Treg:Teff ratios. n = 20 in each group; Two-way repeated measures ANOVA with Bonferroni's correction for multiple pairwise comparison tests. Mean (SD). g. Suppressive function of HC and LC Tregs of different LC aetiologies (ARC or NASH). n = 5 in each group. Two-way repeated measures ANOVA with Bonferroni's correction for multiple pairwise comparison tests following log10 transformation. Values shown as SD. h. Linear regression of Treg suppression (from f) and disease severity as calculated by MELD score in LC patients. n = 20. Pearson's correlation coefficient. i. TSDR Methylation of freshly isolated healthy CD4+CD25- Teff and CD4+CD25+CD127lo/- Tregs of HC and LC patients. Mean percentage of methylation shown for each of the 11 analysed CpG islands. HC n = 7, LC n = 6. Abbreviations: Healthy control (HC), liver cirrhosis (LC), peripheral blood mononuclear cells (PBMCs), Model of end stage liver disease score (MELD), Alcohol-related cirrhosis (ARC), non-alcoholic steatohepatitis (NASH).
Fig. 2
Fig. 2
Circulating Tregs from LC patients exhibit increased intracellular ROS and changes in mitochondria morphology. a–c. Measurement of oxidative stress in freshly isolated HC and LC CD4+CD25+ Tregs. HC n = 8, LC n = 7; unpaired t-test with Welch's correction (a,b) following log10 transformation (a–c). Median (IQR). a. ROS shown by the MFI of dihydroethidium (DHE). b. Analysis of lipid peroxidation using the MFI of Bodipy C11 581/591. c. Free thiols on the cell surface indicated by the MFI of Alexa 633-maleimide. d. Representative confocal microscopy pictures (left) and summary (right) indicating co-localisation of the NADPH oxidase 2 (Nox2) subunits p47phox (green) and gp91phox (red) measured as MFI of co-localised points (white). Cell nuclei stained with DAPI (blue). Scale bar 7.5 μm. HC n = 5, LC n = 7. Mann–Whitney test. Median (IQR). e. Mitochondrial ROS measured by Mitosox (MFI) in HC and LC Tregs. HC n = 12, LC n = 16. Unpaired t-test following log10 transformation. Median (IQR). f. Metabolic profile of CD4+ CD25+ Tregs of HC and LC patients. Oxygen Consumption Rate (OCR) and extracellular acidification rate (ECAR) was measured following the exposure to Oligomycin (Oligo), FCCP and Rotenone + Antimycin A (R + A). SD. g. Basal and maximal OCR and ATP production (measured after Oligomycin treatment) in HC and LC Tregs. Basal ECAR, glycolytic capacity (max. ECAR) and basal OCR/ECAR ratio in HC and LC Tregs. HC n = 9, LC n = 6. Unpaired t-tests following log10 transformation. Median (IQR). h. Quantification of mitochondrial cristae width of HC and LC Tregs by electron microscopy. Scale bar 500 nm. HC/LC n = 3. Mean mitochondrial cristae width, HC; 16.65 (95% Confidence Interval 15.48–17.81) vs LC; 19.27 (95% Confidence Interval 18.08–20.45; p = 0.013), from linear mixed effect model (dependent variable, cristae width; fixed-effects variable, disease state; random effects variable, patient ID. Sensitivity analysis with log10 transformed cristae width p = 0.026). i. Volcano plot indicating the 15 top differentially expressed genes in LC Tregs. Genes with a p-value <0.01 were considered differentially expressed between LC and HC Tregs and marked in red. n = 7. j. Gene set enrichment analysis (GSEA) of fatty acid metabolism, fatty acid beta oxidation, and Pentose Phosphate Pathway underrepresented in LC Tregs. n = 7. k. GSEA of Ribosome and Interferon Gamma Response pathway genes in LC Tregs. n = 7. Abbreviations: Reactive oxygen species (ROS), Healthy control (HC), liver cirrhosis (LC), dihydroethidium (DHE), 4.6-diamino-2-phenylin-dole (DAPI), NADPH oxidase 2 (Nox2), Oxygen consumption rate (OCR), Extracellular acidification rate (ECAR), Oligomycin (Oligo), Carbonyl cyanide-4 (trifluoromethoxy) phenylhydrazone (FCCP), Rotenone + Antimycin A (R + A).
Fig. 3
Fig. 3
The Nrf2/HO-1 redox pathway is dysregulated in Tregs from LC patients. a. Nrf2 abundance in freshly isolated CD4+CD25+ Tregs of healthy controls (HC) and liver cirrhotic (LC) patients relative to the loading control TFIID measured by Western Blot. HC n = 6, LC n = 5; unpaired t test. Mean (SD). b. Nuclear Nrf2 translocation following 12-h prostaglandin J2 (PGJ2) stimulation in freshly isolated HC and LC Tregs measured by ImageStream. HC/LC n = 5. Two-way repeated measures ANOVA with Bonferroni's correction for multiple pairwise comparison tests. Mean (SD). c–d. Relative abundance of HO-1 (c.) and Bach1 (d.) in freshly isolated HC and LC Tregs relative to the loading control TFIID measured by Western Blot. HO1: HC n = 6, LC n = 5; Bach1: HC n = 7, LC n = 5; unpaired t-test following log10 transformation. Median (IQR). e. Relative gene expression of Nrf2 targets NQO1, GCLM and SOD1 in freshly isolated HC and LC Tregs (normalised to a HC calibrator sample). HC n = 15, LC n = 12. Multiple unpaired t-tests with Bonferroni's adjustment following log10 transformation. Median (IQR). f. GSEA of oxygen radical response in HC and LC patients. Top enriched genes are listed to the right. n = 7. g–i. Phenotype and function of murine Nrf2−/− Tregs. g. Expression (MFI) of phenotypic markers (FoxP3 left, CD39 middle, CTLA-4 right) in freshly isolated Tregs of WT and Nrf2−/− mice. n = 3, multiple unpaired t-tests with Bonferroni's adjustment. Mean (SD). h. Proportion of Annexin V+ CD4+CD25+ Tregs from WT and Nrf2−/− mice following 3-days of CD3/CD28 stimulation. n = 5, unpaired t-test. Mean (SD). i. Suppressive function of Nrf2−/− Tregs at different Treg:Teff ratios. n = 7, Two-way repeated measures ANOVA with Bonferroni's correction for multiple pairwise comparison. Mean (SD). j–l. CRISPR/Cas9 mediated HO-1 knock-out in human Tregs. j. Representative flow cytometry plot (left) and summary (right) of CRISPR/Cas9-mediated human HO-1 knock-out Tregs. Control conditions are wild-type (WT) Tregs and negative control (NC) Tregs (i.e. electroporated with a CRISPR/Cas9 complex not targeting the human genome). WT n = 10, NC n = 11, KO n = 12. Ordinary one-way ANOVA with Bonferroni's correction for multiple pairwise comparison tests following log10 transformation. Median (IQR). k. Suppressive capacity of modified Tregs (KO) and its controls (WT, NC) to inhibit Teff proliferation at various Treg:Teff ratios. n = 3 (NC) n = 4 (WT, KO). Linear mixed effect model with Bonferroni's correction for multiple pairwise comparison. (SD). p-values indicate comparison between NC and KO. l. Percentage of viable WT, NC and HO-1 KO Tregs following 18-h incubation at different concentrations of Hydrogen Peroxide (H2O2). WT/NC/KO n = 3. Two-way repeated measures ANOVA with Bonferroni's correction for multiple pairwise comparison (SD). p-values indicate comparison between NC and KO. Abbreviations: Healthy control (HC), liver cirrhosis (LC), Nuclear factor erythroid 2-related factor 2 (Nrf2). Heme-oxygenase 1 (HO-1). NAD(P)H quinone dehydrogenase 1 (NQO1). Glutamate-cysteine ligase modifier subunit (GCLM). Superoxide dismutase 1 (SOD1). Prostaglandin J2 (PGJ2). Gene Set enrichment analysis (GSEA), Wild-type (WT), negative control (NC), knock-out (KO).
Fig. 4
Fig. 4
Exposure to LC serum recapitulates some of the Treg functional abnormalities observed in LC patients. a.-e. Healthy CD4+CD25+ Tregs were incubated with 25% HC or LC Serum for 24 h. a. FoxP3 expression (MFI). HC/LC serum n = 5. Unpaired t-test following log10 transformation. Median (IQR). b. Percentage of Annexin V+ Tregs. HC/LC serum n = 7. Unpaired t-test following log10 transformation. Median (IQR). c. Proportion of IL-17 (left) and IFNγ (right) expressing Tregs. HC/LC serum n = 5. Multiple unpaired t-tests with Bonferroni adjustment following log10 transformation. Median (IQR). d. Suppressive capacity of healthy Tregs after pre-incubating in 25% serum of HC or LC patients for 24 h. HC/LC serum n = 9. Two-way repeated measures ANOVA with Bonferroni's correction for multiple pairwise comparison. Values shown as SD. e. Metabolic profiling using Seahorse of CD4+CD25+ Tregs following incubation in 25% HC and LC Serum together with anti-CD3/CD28 beads (1:5 = bead to cell ratio) for 24 h. Oxygen Consumption Rate (OCR) and extracellular acidification rate (ECAR) was measured following the exposure to Oligomycin (Oligo), FCCP and Rotenone + Antimycin A (R + A). f. Left: basal and maximal OCR; and ATP production (measured after Oligomycin treatment) in HC and LC Tregs. Right: basal ECAR, glycolytic capacity (max. ECAR) and basal OCR/ECAR ratio in HC and LC Tregs. HC n = 9, LC n = 6. Unpaired t-tests following log10 transformation. Median (IQR). Abbreviations: Healthy control (HC), liver cirrhosis (LC), Oxygen consumption rate (OCR), Extracellular acidification rate (ECAR), Oligomycin (Oligo), Carbonyl cyanide-4 (trifluoromethoxy) phenylhydrazone (FCCP), Rotenone + Antimycin A (R + A).

References

    1. Vignali D.A., Collison L.W., Workman C.J. How regulatory T cells work. Nat Rev Immunol. 2008;8(7):523–532. - PMC - PubMed
    1. Sakaguchi S., Mikami N., Wing J.B., Tanaka A., Ichiyama K., Ohkura N. Regulatory T cells and human disease. Annu Rev Immunol. 2020;38:541–566. - PubMed
    1. Zheng S.G., Wang J., Horwitz D.A. Cutting edge: Foxp3+CD4+CD25+ regulatory T cells induced by IL-2 and TGF-beta are resistant to Th17 conversion by IL-6. J Immunol. 2008;180(11):7112–7116. - PubMed
    1. Yang X.O., Nurieva R., Martinez G.J., et al. Molecular antagonism and plasticity of regulatory and inflammatory T cell programs. Immunity. 2008;29(1):44–56. - PMC - PubMed
    1. Valencia X., Stephens G., Goldbach-Mansky R., Wilson M., Shevach E.M., Lipsky P.E. TNF downmodulates the function of human CD4+CD25hi T-regulatory cells. Blood. 2006;108(1):253–261. - PMC - PubMed