. 2023 Sep:91:102801.
doi: 10.1016/j.jhealeco.2023.102801. Epub 2023 Aug 6.

Private equity and healthcare firm behavior: Evidence from ambulatory surgery centers

Affiliations

Private equity and healthcare firm behavior: Evidence from ambulatory surgery centers

Haizhen Lin et al. J Health Econ. 2023 Sep.

Abstract

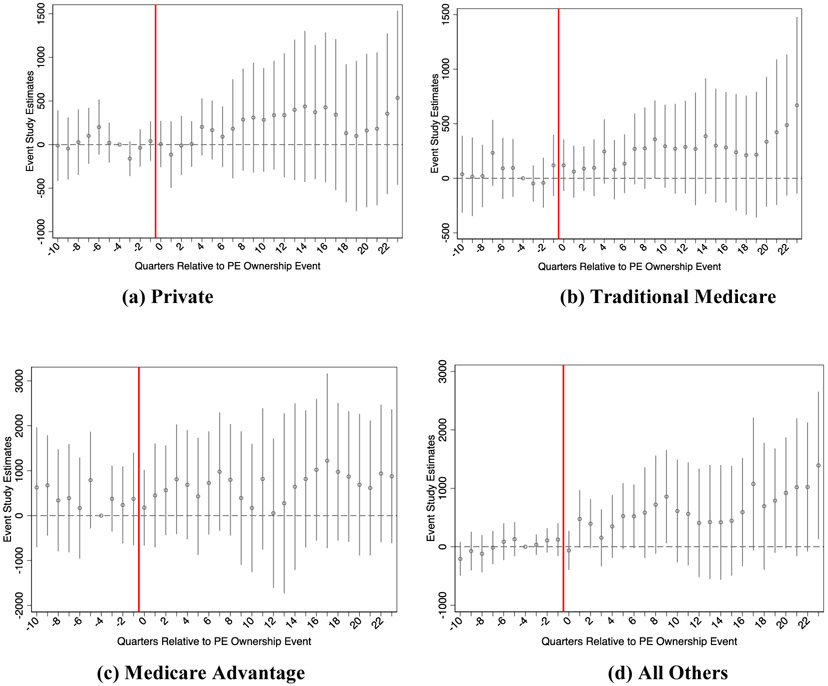
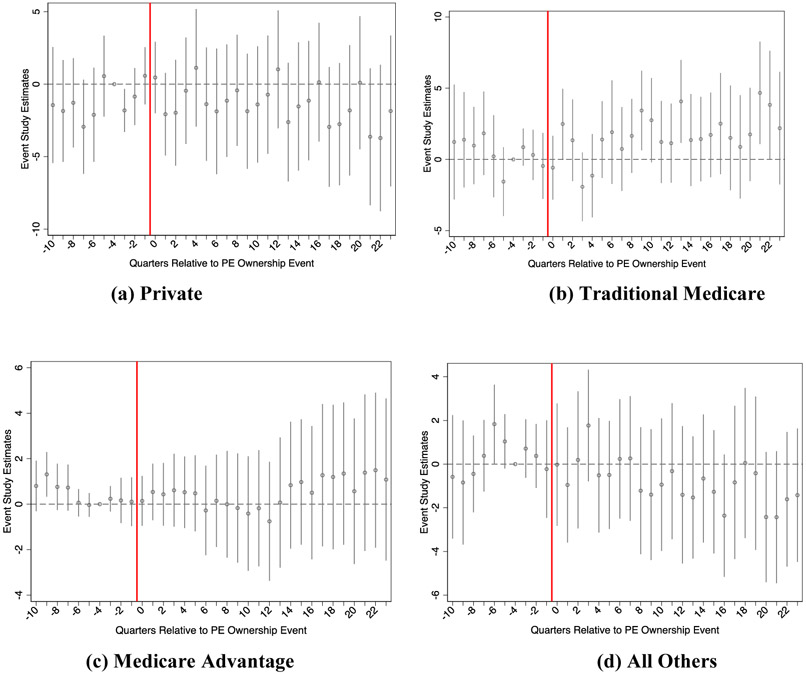
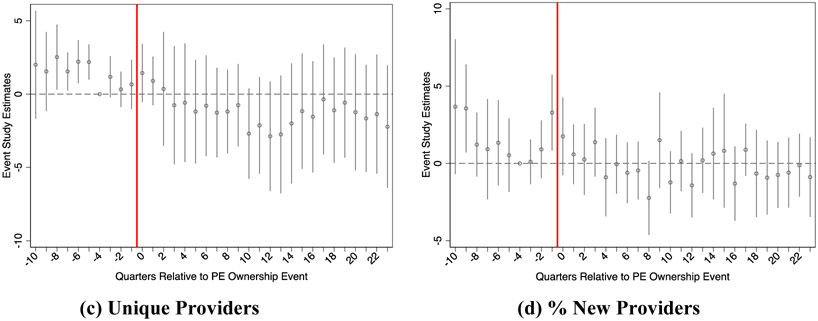
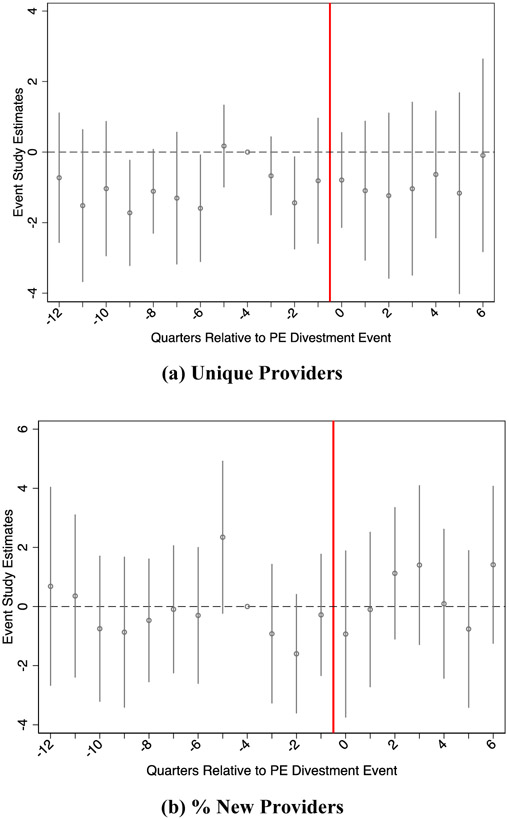
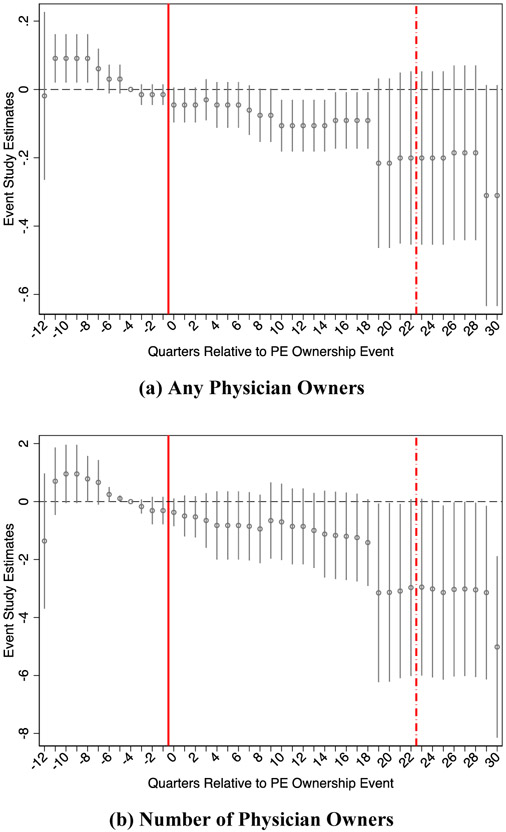
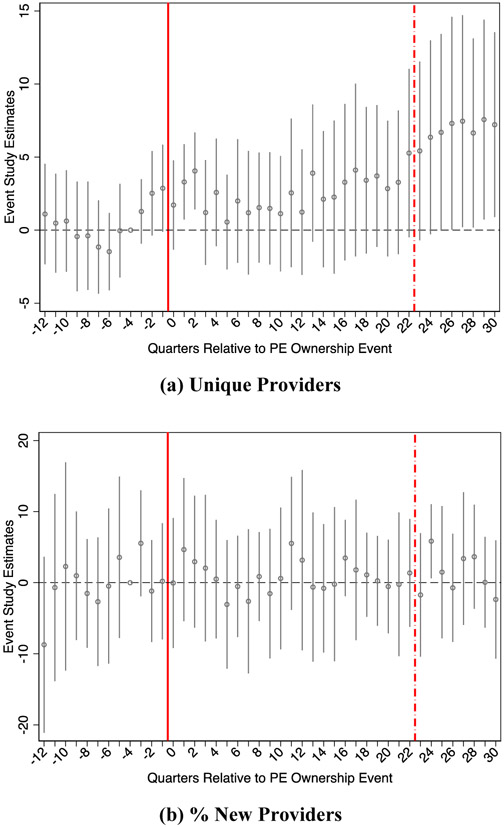
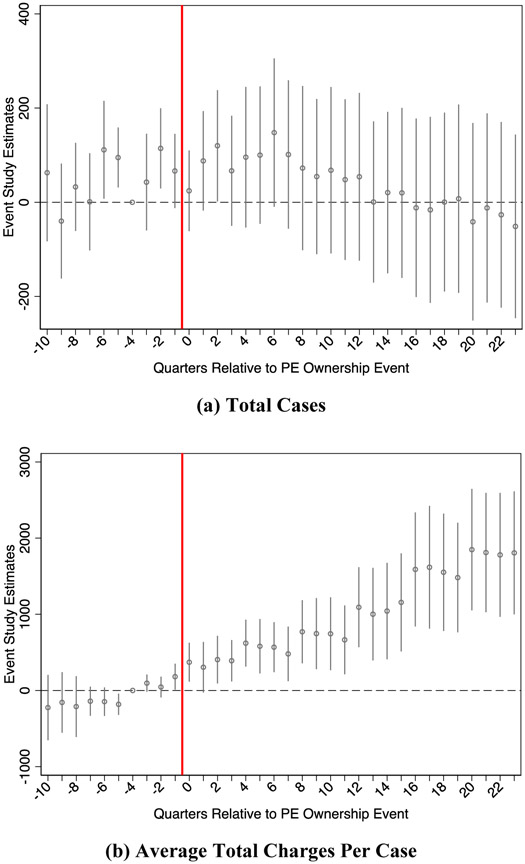
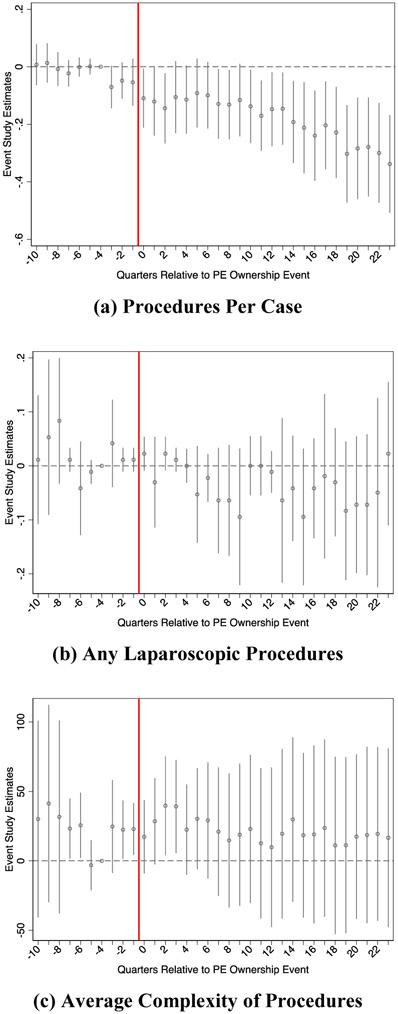
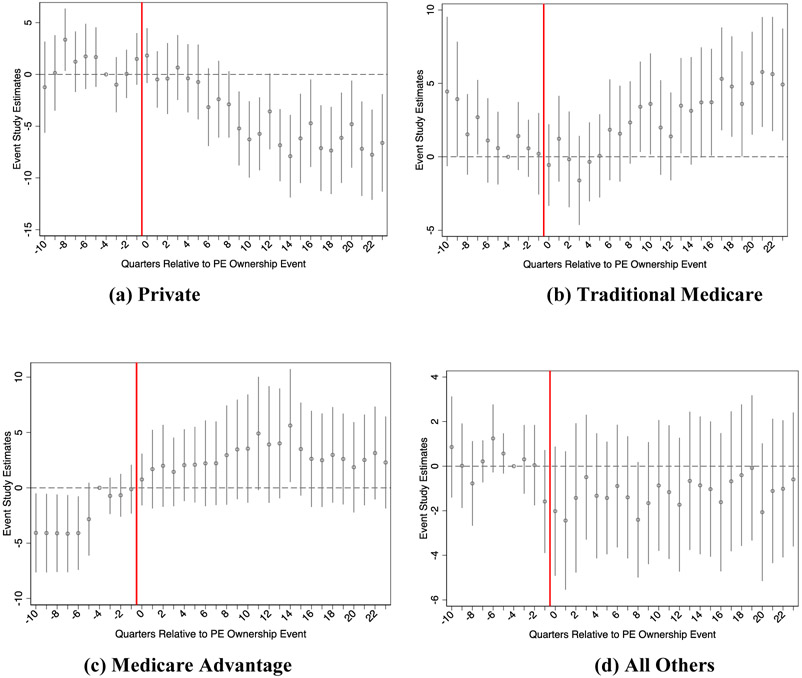
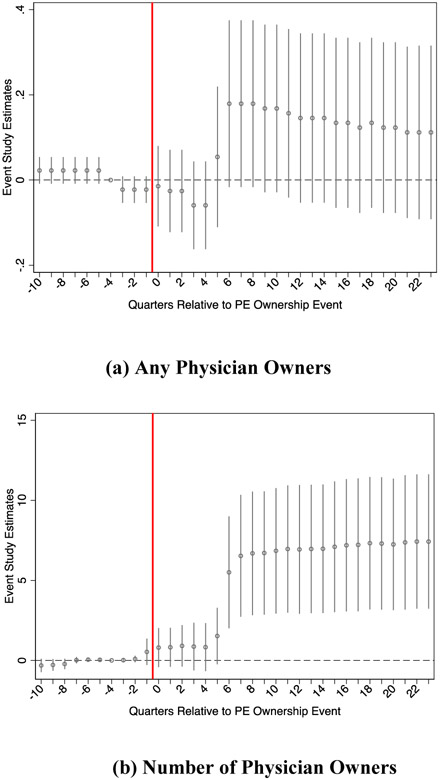
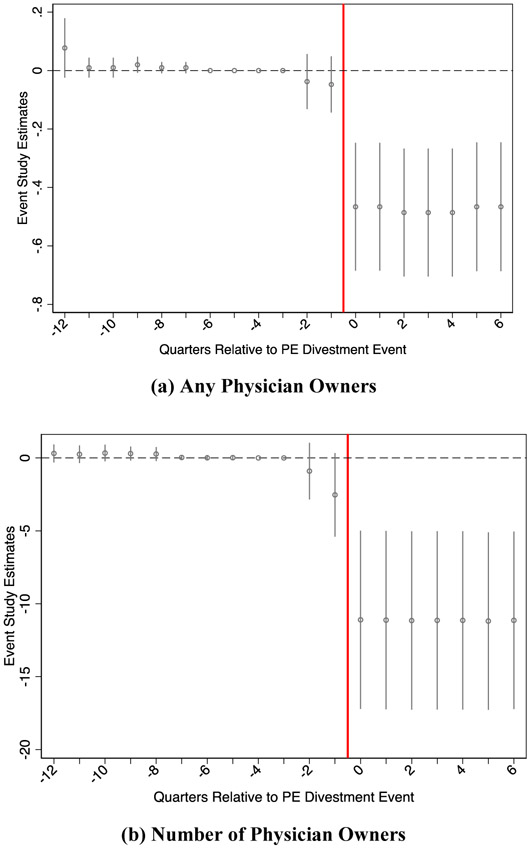
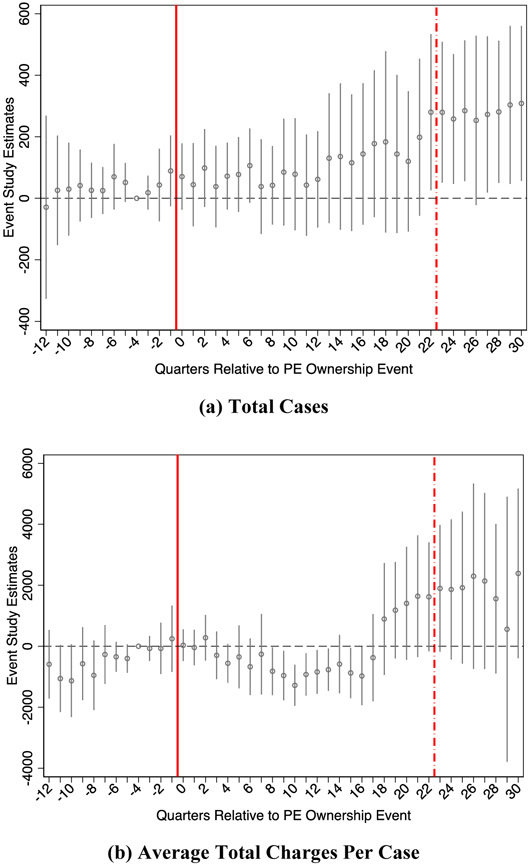
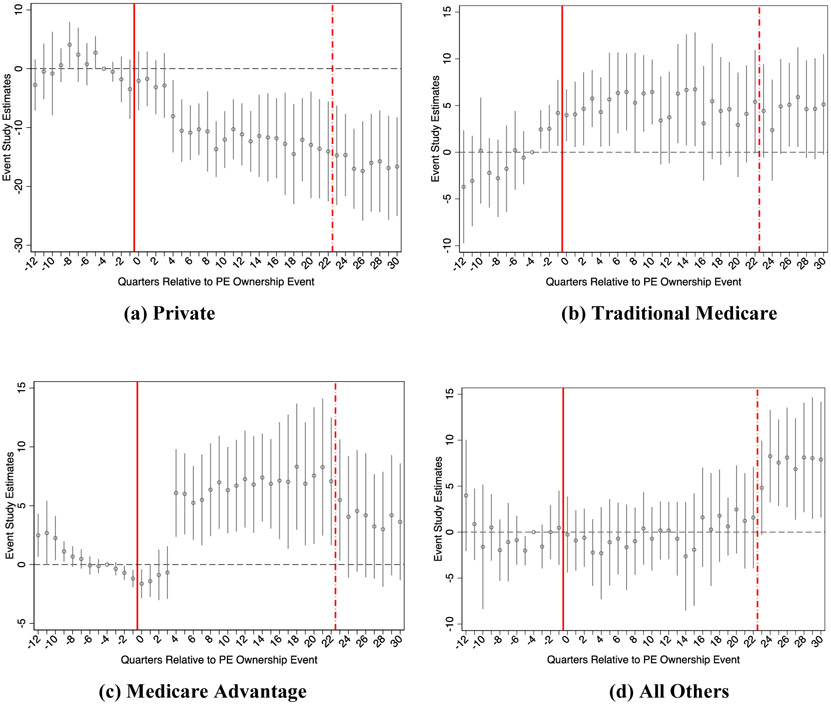
Healthcare firms regularly seek outside capital; yet, we have an incomplete understanding of external investor influence on provider behavior. We investigate the effects of private equity investment, divestment, and an initial public offering (IPO) on ambulatory surgery centers (ASCs). Throughput is unchanged while charges grow by up to 50% for the same service mix. Affected ASCs witness declines in privately insured cases and rely more on Medicare business. Private equity increases physician ASC ownership stakes, and both simultaneously divest when the ASC is sold. Our findings appear more consistent with private equity influencing the financing of ASCs, rather than treatment approaches.

Keywords: Ambulatory surgery centers; Outpatient surgery; Physician ownership; Private equity.


Figures

Appendix Figure A1:
Appendix Figure A1:. Sensitivity Analysis of Private Equity Investment Effects on Average Charges per Case
Notes: Authors’ calculations using the Florida AHCA universe of ambulatory discharge records and subset to our ASCs of interest described in Section 4. Sensitivity analysis based on Rambachan and Roth (2023).
Appendix Figure A2:
Appendix Figure A2:. Private Equity Investment Effects on Charges Per Case by Payer
Notes: Authors’ calculations using the Florida AHCA universe of ambulatory discharge records and subset to our ASCs of interest described in Section 4. When restricting to specific payers, some ASC-quarter combinations will have missing data if no such cases are performed for the specific payer. This is mostly an issue with Medicare Advantage, which had only modest market penetration during the early years of the analytic data.
Appendix Figure A3:
Appendix Figure A3:. Private Equity Investment Effects on ASC Rates of Routine Discharge to Home and Transfer to Acute Care Hospital
Notes: Authors’ calculations using the Florida AHCA universe of ambulatory discharge records and subset to our ASCs of interest described in Section 4. 99.9% of ASC cases in the analytic data have a routine discharge to home.
Appendix Figure A4:
Appendix Figure A4:. Private Equity Investment Effects on ASC Procedures per Case by Payer
Notes: Authors’ calculations using the Florida AHCA universe of ambulatory discharge records and subset to our ASCs of interest described in Section 4. The outcome is the average number of procedures performed per case. When restricting to specific payers, some ASC-quarter combinations will have missing data if no such cases are performed for the specific payer. This is mostly an issue with Medicare Advantage, which had only modest market penetration during the early years of the analytic data.
Appendix Figure A5:
Appendix Figure A5:. Within-Market Competitor ASCs’ Average Charges Per Case by Payer
Notes: Authors’ calculations using the Florida AHCA universe of ambulatory discharge records and subset to our ASCs of interest described in Section 4. When restricting to specific payers, some ASC-quarter combinations will have missing data if no such cases are performed for the specific payer. This is mostly an issue with Medicare Advantage, which had only modest market penetration during the early years of the analytic data.
Appendix Figure A6:
Appendix Figure A6:. Within-Market Competitor ASCs’ Payer Mix Changes
Notes: Authors’ calculations using the Florida AHCA universe of ambulatory discharge records and subset to our ASCs of interest described in Section 4. When restricting to specific payers, some ASC-quarter combinations will have missing data if no such cases are performed for the specific payer. This is mostly an issue with Medicare Advantage, which had only modest market penetration during the early years of the analytic data.
Appendix Figure A7:
Appendix Figure A7:. Private Equity Investment Effects on Provider Counts and Share of New Providers Using the ASC
Notes: Authors’ calculations using the Florida AHCA universe of ambulatory discharge records and subset to our ASCs of interest described in Section 4.
Appendix Figure A8:
Appendix Figure A8:. Private Equity Divestment Effects on Provider Counts and Likelihood of New Provider-ASC Pairing
Notes: Authors’ calculations using the Florida AHCA universe of ambulatory discharge records and subset to our ASCs of interest described in Section 4.
Appendix Figure A9:
Appendix Figure A9:. Post-Private Equity Divesture Remaining Corporate Ownership Breakdown
Notes: Restricts to treatment group ASCs described in Table 1, with the exception of three ASCs that have an ongoing private equity (PE) investment by the conclusion of our analytic data (i.e., a divestment time point has not been reached). Examination of remaining corporate ownership mix at the conclusion of our analytic data.
Appendix Figure A10:
Appendix Figure A10:. Private Equity Ownership and IPO Effects on ASC Chain Charges per Case among Key Payers
Notes: Authors’ calculations using the Florida AHCA universe of ambulatory discharge records and subset to our ASCs of interest described in Section 5. Solid line demarcates the introduction of private equity ownership for the Surgery Partners chain, and the dashed line represents its IPO
Appendix Figure A11:
Appendix Figure A11:. Private Equity Ownership and IPO Effects on ASC Case Intensity and Complexity
Notes: Authors’ calculations using the Florida AHCA universe of ambulatory discharge records and subset to our ASCs of interest described in Section 5. Solid line demarcates the introduction of private equity ownership for the Surgery Partners chain, and the dashed line represents its IPO.
Appendix Figure A12:
Appendix Figure A12:. Private Equity Ownership and IPO Effects on Avg. Number of Procedures Per Case by Payer
Notes: Authors’ calculations using the Florida AHCA universe of ambulatory discharge records and subset to our ASCs of interest described in Section 5. Solid line demarcates the introduction of private equity ownership for the Surgery Partners chain, and the dashed line represents its IPO. When restricting to specific payers, some ASC-quarter combinations will have missing data if no such cases are performed for the specific payer. This is mostly an issue with Medicare Advantage, which had only modest market penetration during the early years of the analytic data.
Appendix Figure A13:
Appendix Figure A13:. Private Equity Ownership and IPO Effects on Physician ASC Equity Holdings
Notes: Authors’ calculations using the Florida AHCA universe of ambulatory discharge records and subset to our ASCs of interest described in Section 5. Solid line demarcates the introduction of private equity ownership for the Surgery Partners chain, and the dashed line represents its IPO.
Appendix Figure A14:
Appendix Figure A14:. Private Equity Ownership and IPO Effects on Provider Counts and Likelihood of New Provider-ASC Pairing
Notes: Authors’ calculations using the Florida AHCA universe of ambulatory discharge records and subset to our ASCs of interest described in Section 5. Solid line demarcates the introduction of private equity ownership for the Surgery Partners chain, and the dashed line represents its IPO.
Fig. 1.
Fig. 1.. ASC to HOPD Ratio for Florida Counties in 2005 and 2015
Notes: “HOPD” stands for hospital outpatient department. There are 67 Florida counties in total. Scatter plot excludes the few counties where no facilities are present in one or both years or that the number of HOPDS is zero in either year—making the ratio undefined.
Fig. 2.
Fig. 2.. Geographic Incidence of Private Equity ASC Ownership Events in Florida
Notes: Private equity events restricted to those germane to our analytic sample.
Fig. 3.
Fig. 3.. Distribution of Private Equity ASC Ownership Stake Duration
Notes: Restricts to ASCs belonging the analytic sample for our stacked differences-in-differences event study estimations. Three treatment group ASCs have an ongoing private equity (PE) investment by the conclusion of our analytic data (i.e., a divestment time point has not been reached) and are consequently not included in this figure since their total PE duration is not yet known.
Fig. 4.
Fig. 4.. Private Equity Investment Effects on ASC Case Volumes and Avg. Charges per Case
Notes: Authors’ calculations using the Florida AHCA universe of ambulatory discharge records and subset to our ASCs of interest described in Section 4. Stacked difference-in-differences event study estimation using Equation 1.
Fig. 5.
Fig. 5.. Private Equity Investment Effects on ASC Case Intensity and Complexity
Notes: Authors’ calculations using the Florida AHCA universe of ambulatory discharge records and subset to our ASCs of interest described in Section 4. The Medicare facility fee for the main procedure performed in a given case is used as a proxy for case complexity in panel (c). Stacked difference-in-differences event study estimation using Equation 1.
Fig. 6.
Fig. 6.. Private Equity Investment Effects on ASC Payer Mix
Notes: Authors’ calculations using the Florida AHCA universe of ambulatory discharge records and subset to our ASCs of interest described in Section 4. The outcome is the percentage of cases covered by the specified insurance type. Stacked difference-in-differences event study estimation using Equation 1.
Fig. 7.
Fig. 7.. Private Equity Investment Effects on ASC Physician Equity Holdings
Notes: Authors’ calculations using the Florida AHCA universe of ambulatory discharge records and subset to our ASCs of interest described in Section 4. Stacked difference-in-differences event study estimation using Equation 1.
Fig. 8.
Fig. 8.. Private Equity Divestment Effects on Physician ASC Equity Holdings
Notes: Authors’ calculations using the Florida AHCA universe of ambulatory discharge records and subset to our ASCs of interest described in Section 4. Stacked difference-in-differences event study estimation using Equation 3.
Fig. 9.
Fig. 9.. Private Equity and IPO Effects on ASC Chain Case Volumes and Average Charges per Case
Notes: Authors’ calculations using the Florida AHCA universe of ambulatory discharge records and subset to our ASCs of interest described in Section 5. Solid line demarcates the introduction of private equity ownership for the Surgery Partners chain, and the dashed line represents its IPO.
Fig. 10.
Fig. 10.. Private Equity Ownership and IPO Effects on ASC Chain Payer Mix
Notes: Authors’ calculations using the Florida AHCA universe of ambulatory discharge records and subset to our ASCs of interest described in Section 5. The outcome is the percentage of cases covered by the specified insurance type. Solid line demarcates the introduction of private equity ownership for the Surgery Partners chain, and the dashed line represents its IPO.

Similar articles

Cited by

References

    1. Agrawal Ashwini, and Tambe Prasanna. 2016. “Private Equity and Workers’ Career Paths: The Role of Technological Change.” Review of Financial Studies, 29 (9): 2455–2489.
    1. American Hospital Association. 2020. TrendWatch Chartbook. Available at https://www.aha.org/system/files/media/file/2020/10/TrendwatchChartbook-....
    1. Antoni Manfred, Maug Ernst, and Obernberger Stefan. 2019. “Private Equity and Human Capital Risk Journal of Financial Economics, 133 (3): 634–657.
    1. Aouad Marion, Brown Timothy T., and Whaley Christopher M.. 2019. “Reference Pricing: The Case of Screening Colonoscopies.” Journal of Health Economics, 65, 246–259. - PMC - PubMed
    1. Achleitner Ann-Kristin, Braun Reiner, Engel Nico, Figge Christian, and Tappeiner Florian. 2010. “Value Creation Drivers in Private Equity Buyouts: Empirical Evidence from Europe.” Journal of Private Equity, 13 (2): 17–27.

Publication types

LinkOut - more resources