. 2023 Oct:166:115399.
doi: 10.1016/j.biopha.2023.115399. Epub 2023 Aug 31.

CFTR potentiator ivacaftor protects against noise-induced hair cell loss by increasing Nrf2 and reducing oxidative stress

Affiliations

CFTR potentiator ivacaftor protects against noise-induced hair cell loss by increasing Nrf2 and reducing oxidative stress

Fan Wu et al. Biomed Pharmacother. 2023 Oct.

Abstract

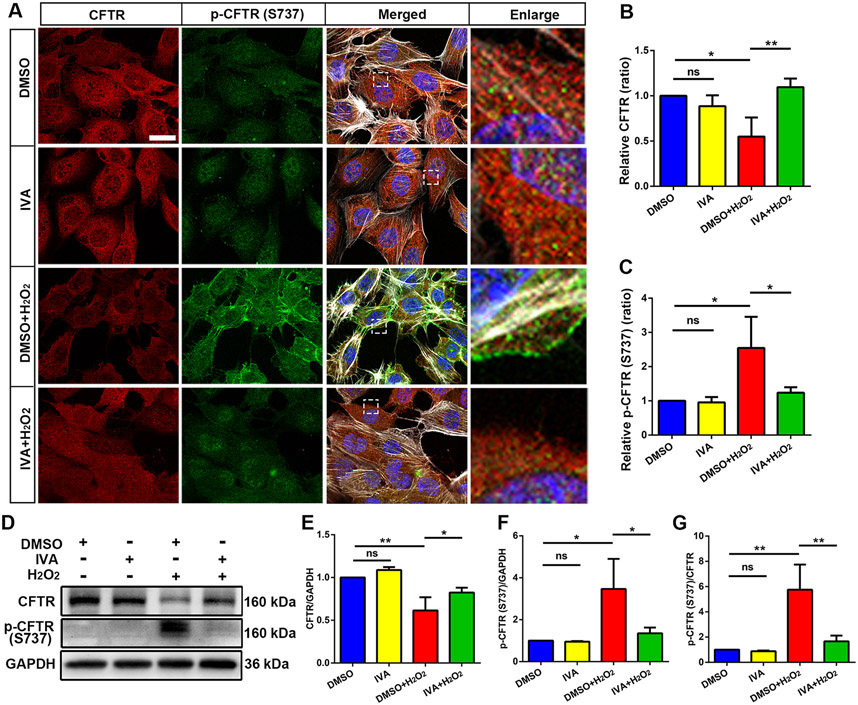
Over-production of reactive oxygen species (ROS) in the inner ear can be triggered by a variety of pathological events identified in animal models after traumatic noise exposure. Our previous research found that inhibition of the AMP-activated protein kinase alpha subunit (AMPKα) protects against noise-induced cochlear hair cell loss and hearing loss by reducing ROS accumulation. However, the molecular pathway through which AMPKα exerts its antioxidative effect is still unclear. In this study, we have investigated a potential target of AMPKα and ROS, cystic fibrosis transmembrane conductance regulator (CFTR), and the protective effect against noise-induced hair cell loss of an FDA-approved CFTR potentiator, ivacaftor, in FVB/NJ mice, mouse explant cultures, and HEI-OC1 cells. We found that noise exposure increases phosphorylation of CFTR at serine 737 (p-CFTR, S737), which reduces wildtype CFTR function, resulting in oxidative stress in cochlear sensory hair cells. Pretreatment with a single dose of ivacaftor maintains CFTR function by preventing noise-increased p-CFTR (S737). Furthermore, ivacaftor treatment increases nuclear factor E2-related factor 2 (Nrf2) expression, diminishes ROS formation, and attenuates noise-induced hair cell loss and hearing loss. Additionally, inhibition of noise-induced AMPKα activation by compound C also diminishes p-CFTR (S737) expression. In line with these in-vivo results, administration of hydrogen peroxide to cochlear explants or HEI-OC1 cells increases p-CFTR (S737) expression and induces sensory hair cell or HEI-OC1 cell damage, while application of ivacaftor halts these effects. Although ivacaftor increases Nrf2 expression and reduces ROS accumulation, cotreatment with ML385, an Nrf2 inhibitor, abolishes the protective effects of ivacaftor against hydrogen-peroxide-induced HEI-OC1 cell death. Our results indicate that noise-induced sensory hair cell damage is associated with p-CFTR. Ivacaftor has potential for treatment of noise-induced hearing loss by maintaining CFTR function and increasing Nrf2 expression for support of redox homeostasis in sensory hair cells.

Keywords: Activation of AMPKα; Cystic fibrosis transmembrane conductance regulator ivacaftor; Noise-induced hearing loss; Nuclear factor E2-related factor 2; Reactive oxygen species.


Conflict of interest statement

Declaration of Competing Interest The authors declare that they have no competing interests.

Figures

Fig. 1.
Fig. 1.
Treatment with AMPKα inhibitor compound C prevents noise-increased phosphorylation of CFTR (S737) in OHCs. (A) Representative images show that treatment with compound C (CC) prevents noise-increased immunolabeling for p-CFTR (S737) in both the cytosol and nuclei of OHCs. The enlarged images of the OHCs allow for better visualization of punctate immunolabeling. Compound C alone shows p-CFTR (S737) labeling intensity similar to solvent controls (DMSO). Phalloidin (white) and DAPI (blue) were used as counterstaining for visualization of OHC structure and nuclei. PTSN: permanent threshold shift noise; Scale bar = 10 μm. (B–C) Semi-quantification of immunolabeling for p-CFTR (S737) in the cytosol (B) and nuclei (C) of OHCs confirms a significant increase 3 h after noise exposure, while treatment with compound C prevents such effects. Data are presented as means + SD, n = 3 mice in each group. One cochlea was used per mouse, ns: non-significant, *p < 0.05, ***p < 0.001. (D) Timeline of the in-vivo experiments: FVB/NJ mice were weaned at 21 days (3 weeks) and had baseline ABRs at 25 days. At the age of 4 weeks, one day before noise exposure (D1), mice received the first dose of compound C (CC). On day 2 (D2), mice received a second dose of CC 2 h before noise exposure, followed by noise exposure for 2 h. Mice received a third dose of CC 1 h after noise exposure. For experiments using ivacaftor, mice only received one dose of ivacaftor 2 h before noise exposure. Some mice were euthanized 3 h after the exposure for immunolabeling and others had final ABR measurements 2 weeks after the noise exposure (at the age of 6 weeks) and were euthanized for surface preparations for hair cell counts.
Fig. 2.
Fig. 2.
Treatment with ivacaftor prevents the decrease of CFTR and the increase of p-CFTR (S737) after noise exposure in OHCs. (A) Representative images show immunolabeling for CFTR (red) and p-CFTR (S737, green) in OHC cytosol and nuclei in the upper basal turn measured 3 h after noise exposure. The enlarged OHCs allow for better visualization of the punctate labeling for CFTR and p-CFTR (S373). These images are representative of 3 mice in each group. Phalloidin (white) and DAPI (blue) were used as counterstaining for visualization of OHC cytoskeletal structure and nuclei, respectively. DMSO (control, solvent of ivacaftor); IVA (ivacaftor). Scale bar = 10 μm. (B–E) Semi-quantification of immunolabeling in grayscale of CFTR and p-CFTR (S737) in the OHC cytosol and nuclei shows that treatment with ivacaftor significantly prevents noise-decreased CFTR and increased p-CFTR (S737). Data are presented as means + SD, n = 3, *p < 0.05, **p < 0.01. (F) Representative immunoblots reveal a decrease in total CFTR expression and increase in p-CFTR (S737) in whole cochlear homogenates 3 h after noise exposure. These blots are representative of 3 repetitions with two cochleae per sample. GADPH serves as loading control. (G–I) Quantification of CFTR and p-CFTR (S737) band densities shows a significant decrease in CFTR levels (G), an increase in p-CFTR (S737) levels (H), and an increase in the ratio of p-CFTR (S737) to CFTR (I) in the PTS noise group compared to controls. Data are presented as means + SD, n = 3, **p < 0.01.
Fig. 3.
Fig. 3.
Treatment with ivacaftor increases Nrf2 expression in OHCs. (A) Representative images show that Nrf2 (green) in OHCs mildly increases in both the cytosol and nuclei 3 h after noise exposure in the presence of DMSO, whereas ivacaftor pretreatment strongly increases Nrf2 immunolabeling. Phalloidin (white) and DAPI (blue) were used as counterstaining for visualization of OHCs. Scale bar = 10 μm. (B–C) Semi-quantitative analysis of immunolabeling in grayscale of Nrf2 in the OHC cytosol (B) and nuclei (C) confirms a mild increase with DMSO and 2-fold increase with ivacaftor 3 h after noise exposure. All bar graph data are presented as means + SD, n = 3 in each group. One cochlea was used per mouse, ns: non-significant, *p < 0.05, **p < 0.01.
Fig. 4.
Fig. 4.
Treatment with ivacaftor reduces noise-enhanced formation of 4-HNE in OHCs. (A) Immunolabeling for 4-HNE (4-hydroxynonenal) in both the cytosol and nuclei of OHCs shows an increase 3 h after exposure to noise and this increase is abolished by ivacaftor pretreatment. Scale bar = 10 μm. (B–C) Semi-quantitative analysis of 4-HNE in the OHC cytosol (F) and nuclei (G) confirms a significant increase 3 h after noise exposure. This effect is blocked by ivacaftor treatment. All data in the bar graphs are presented as means + SD, n = 3 in each group, ns: non-significant, *p < 0.05, **p < 0.01.
Fig. 5.
Fig. 5.
Treatment with ivacaftor attenuates noise-induced hair cell loss and auditory threshold shifts in vivo. ABR waveforms at 32 kHz show auditory thresholds at 70 dB SPL in noise-exposed mice and at 40 dB SPL in noise-exposed mice pre-treated with ivacaftor when measured 14 d after the PTS-causing exposure. DMSO: vehicle control, IVA: ivacaftor. Treatment with ivacaftor prevents noise-induced auditory threshold shifts at all tested frequencies (8, 16, and 32 kHz). Data are presented as individual points with means ± SD, ***p < 0.001. (C) Representative images (taken 5 mm from the apex of the cochlear spiral) display phalloidin- (green) and myosin-7a- (red) labeled sensory hair cells in DMSO + noise and ivacaftor + noise groups 14 d after noise exposure. Missing OHCs are marked with stars. Scale bar = 10 μm. (D) Hair cells were counted along the entire length of the cochlear spiral. Treatment with ivacaftor reduces noise-induced OHC loss. Data are presented as means ± SD, n = 5 in the DMSO + noise group, n = 4 in the IVA + noise group. One cochlea was used per mouse. *p < 0.05, **p < 0.01, ***p < 0.001.
Fig. 6.
Fig. 6.
Increased p-CFTR (S737) and OHC death in organotypic explants after hydrogen peroxide treatment are diminished by application of ivacaftor. (A) Images of cochlear organotypic explant cultures (p3 mice) reveal strong p-CFTR (S737, green) immunolabeling in OHCs after hydrogen peroxide exposure for 30 min (panel: DMSO + H2O2). Additional treatment with ivacaftor reduces the hydrogen-peroxide-enhanced p-CFTR (S737) in OHCs (panel: IVA + H2O2). There are no obvious changes in p-CFTR (S737) labeling in the DMSO or IVA-only groups without exposure to hydrogen peroxide (panel: DMSO or IVA). Red: myosin-7a-labeled hair cells, IVA: ivacaftor. Scale bar = 10 μm. (B) Semi-quantification of the p-CFTR (S737) labeling in grayscale in OHCs confirms a significant increase after hydrogen peroxide exposure. This effect is attenuated by pretreatment with ivacaftor. (C) TUNEL staining shows hydrogen-peroxide-induced apoptotic cell death (green). Red: myosin-7a-labeled hair cells. Scale bar = 10 μm. (D–E) Counts of TUNEL-positive cells (D) and myosin-7a-positive cells (E) show a significant increase in TUNEL-positive cells accompanied by a reduction in myosin-7a-positive cells after hydrogen peroxide exposure. Pretreatment with ivacaftor significantly diminishes such effects. All data in the bar graphs are presented as means + SD, n = 3 in each group, ns: non-significant, ***p < 0.001.
Fig. 7.
Fig. 7.
Application of compound C diminishes hydrogen-peroxide-increased p-CFTR (S737) expression in HEI-OC1 cells. (A) Representative immunoblots show p-CFTR (S737) expression with or without hydrogen peroxide or compound C treatment versus DMSO alone (vehicle control). HEI-OC1 cells were pretreated with 5 μM compound C or an equal concentration of DMSO for 12 h. The groups were then treated with 10 mM hydrogen peroxide for 15 min. GAPDH serves as the sample loading control. (B) Densitometric analysis of the p-CFTR (S737) band normalized to GAPDH shows that the hydrogen-peroxide-induced increase in p-CFTR (S737) levels is mitigated by compound C pretreatment. Data are presented as the means + SD, n = 4 in each group; ns: non-significant, *p < 0.05, **p < 0.01.
Fig. 8.
Fig. 8.
Exposure of HEI-OC1 cells to hydrogen peroxide decreases CFTR and increases p-CFTR (S737) expression, while administration of ivacaftor diminishes such effects. (A) Immunolabeling of CFTR (red) and p-CFTR (S737) (green) in HEI-OC1 cells shows a decrease in CFTR and increase in p-CFTR (S737) labeling after exposure to hydrogen peroxide. These changes are attenuated by ivacaftor pretreatment. Phalloidin (white) and DAPI (blue) were used for counterstaining to visualize the cell structure and nuclei. The enlarged HEI-OC1 cells allow for better visualization of the punctate CFTR labeling localized to the cytosol and p-CFTR (S737) localized at the cell membrane. Scale bar = 10 μm. (B–C) Semi-quantification of immunolabeling for CFTR and p-CFTR (S737) confirms a significant decrease in CFTR (B) and an increase in p-CFTR (S737) (C) after hydrogen peroxide exposure, while treatment with ivacaftor prevents these effects. Data are presented as the means + SD, n = 3 in each group. ns: non-significant, *p < 0.05, **p < 0.01. (D) Representative immunoblots show CFTR and p-CFTR (S737) with or without hydrogen peroxide or ivacaftor treatment versus DMSO alone (control). HEI-OC1 cells were pretreated with 5 μM ivacaftor or equal concentration of DMSO for 12 h then treated with or without exposure to 10 mM hydrogen peroxide for 15 min. GAPDH serves as the sample loading control. (E–G) Densitometric analysis of the total CFTR or p-CFTR (S737) bands normalized to GAPDH confirms a significant decrease in CFTR and an increase in p-CFTR (S737) after exposure to hydrogen peroxide. The ratio of p-CFTR (S737) to CFTR also shows a significant increase (G). These effects are attenuated by ivacaftor pretreatment. Data are presented as the means + SD, n = 3 in each group, ns: non-significant, *p < 0.05, **p < 0.01.
Fig. 9.
Fig. 9.
Ivacaftor increases Nrf2 expression and reduces 4-HNE accumulation in hydrogen-peroxide-treated HEI-OC1 cells. (A) Representative immunolabeling for 4-HNE (red) and Nrf2 (green) in HEI-OC1 cells show a strong labeling for 4-HNE and a mild increase in Nrf2 after exposure to hydrogen peroxide. Administration of ivacaftor reduces hydrogen-peroxide-increased 4-HNE and further increases Nrf2 labeling. The enlarged HEI-OC1 cells are for better visualization of the labeling. Phalloidin (white) and DAPI (blue) were used for counterstaining to visualize the cell cytoskeletal structure and nuclei. Scale bar = 10 μm. (B–C) Semi-quantification of immunolabeling for Nrf2 and 4-HNE in HEI-OC1 cells. DMSO is used as the solvent for ivacaftor. Application of ivacaftor or DMSO + hydrogen peroxide mildly increases Nrf2, but the amount of Nrf2 after hydrogen peroxide treatment is doubled by pretreatment with ivacaftor (B). Semi-quantification confirms a significant increase in 4-HNE after hydrogen peroxide application, while pretreatment with ivacaftor mitigates such an increase (C). Data are presented as means + SD, n = 4 in each group, ns: non-significant, *p < 0.05, **p < 0.01. (D–E) Immunoblots show high Nrf2 band densities after ivacaftor alone or hydrogen peroxide administration and even higher band densities after ivacaftor and hydrogen peroxide co-treatment. GAPDH serves as the sample loading control (D). Semi-quantified band densities confirm a significant increase in Nrf2 protein levels (E). Data are presented as means + SD, n = 3 in each group, *p < 0.05, **p < 0.01. (F–G) ROS detection by DCFH-DA flow cytometry shows an increase in ROS accumulation after hydrogen peroxide stimulation of HEI-OC1 cells, while pretreatment with ivacaftor blocks this effect (F). Quantification of ROS levels confirms a significant increase after hydrogen peroxide exposure and decrease after ivacaftor administration (G). Flow cytometry data were averaged over 3–5 independent runs. Data are presented as means + SD, DMSO group: n = 3, DMSO + H2O2 group: n = 5, IVA + H2O2 group: n = 4, ***p < 0.001.
Fig. 10.
Fig. 10.
Inhibition of Nrf2 by ML385 counteracts the protective effect of ivacaftor in hydrogen-peroxide-treated HEI-OC1 cells. (A–B) Immunoblots show dose-dependent suppression of Nrf2 by ML385 treatment (24 h) in HEI-OC1 cells. GAPDH serves as a loading control (A). Semi-quantitative analysis of Nrf2 protein expression confirms a significant decrease with 5-μM or 10-μM ML385 treatment but not with 2.5-μM treatment (B). (C) Cell viability analysis with the Cell Counting Kit-8 (CCK-8) shows no effect on cell viability at the tested doses of ML385 from 2.5 to 10 μM. (D–F) Immunoblots show that pretreatment with ML385 blocks ivacaftor-increased Nrf2, but the cleaved caspase-3 band remains intense (D). Semi-quantification of Nrf2 and cleaved caspase-3 band densities confirms that ivacaftor-enhanced Nrf2 levels are reversed by pretreatment with 5 μM ML385, (E), while the levels of cleaved caspase 3 remain similar to the hydrogen-peroxide-treated group (F). (G) An annexin V/PI flow cytometry assay shows that the ivacaftor-inhibited, hydrogen-peroxide-induced cell death is reversed by pretreatment with ML385. (H) Quantitative analysis of total cell death in the Annexin V/PI assay shows hydrogen-peroxide-induced cell death is prevented by ivacaftor pretreatment, but such a protective effect is abolished by pretreatment with ML385. Flow cytometry data were averaged over 3 independent runs. Data are presented as the means + SD, n = 3, *p < 0.05, **p < 0.01.
Fig. 11.
Fig. 11.
A schematic illustration of a working hypothesis in noise-induced hearing loss. Our results from in-vivo and in-vitro experiments suggest that noise exposure activates AMPKα and increases ROS formation. These sequelae in turn inhibit CFTR by increasing p-CFTR (S737) in OHCs. Treatment with ivacaftor diminishes noise-increased p-CFTR (S737) and increases Nrf2 expression, thus protects against noise-induced outer hair cell loss and hearing loss via inhibition of ROS damage. Additionally, our in-vitro data using ML385, a specific Nrf2 inhibitor, further suggest that the protective effects of ivacaftor against oxidative stress involve Nrf2.

Similar articles

Cited by

References

    1. Varela-Nieto I, Murillo-Cuesta S, Calvino M, Cediel R, Lassaletta L, Drug development for noise-induced hearing loss, Expert Opin. Drug Discov. 15 (12) (2020) 1457–1471. - PubMed
    1. Hudspeth AJ, Integrating the active process of hair cells with cochlear function, Nat. Rev. Neurosci 15 (9) (2014) 600–614. - PubMed
    1. Sha SH, Schacht J, Emerging therapeutic interventions against noise-induced hearing loss, Expert Opin. Investig. Drugs 26 (1) (2017) 85–96, 5527323. - PMC - PubMed
    1. Wagner EL, Shin JB, Mechanisms of hair cell damage and repair, Trends Neurosci. 42 (6) (2019) 6556399, 414–24. - PMC - PubMed
    1. Dieter A, Keppeler D, Moser T, Towards the optical cochlear implant: optogenetic approaches for hearing restoration, EMBO Mol. Med 12 (4) (2020) 7136966, e11618. - PMC - PubMed