Spontaneous baroreflex sensitivity is attenuated in male UCD-type 2 diabetes mellitus rats: A link between metabolic and autonomic dysfunction
- PMID: 37657371
- PMCID: PMC11613953
- DOI: 10.1016/j.autneu.2023.103117
Spontaneous baroreflex sensitivity is attenuated in male UCD-type 2 diabetes mellitus rats: A link between metabolic and autonomic dysfunction
Abstract
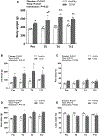
Patients with type 2 diabetes mellitus (T2DM) have impaired arterial baroreflex function, which may be linked to the co-existence of obesity. However, the role of obesity and its related metabolic impairments on baroreflex dysfunction in T2DM is unknown. This study aimed to investigate the role of visceral fat and adiponectin, the most abundant cytokine produced by adipocytes, on baroreflex dysfunction in T2DM rats. Experiments were performed in adult male UCD-T2DM rats assigned to the following experimental groups (n = 6 in each): prediabetic (Pre), diabetes-onset (T0), 4 weeks after onset (T4), and 12 weeks after onset (T12). Age-matched healthy Sprague-Dawley rats were used as controls. Rats were anesthetized and blood pressure was directly measured on a beat-to-beat basis to assess spontaneous baroreflex sensitivity (BRS) using the sequence technique. Dual-energy X-ray absorptiometry (DEXA) was used to assess body composition. Data are presented as mean ± SD. BRS was significantly lower in T2DM rats compared with controls at T0 (T2D: 3.7 ± 3.2 ms/mmHg vs Healthy: 16.1 ± 8.4 ms/mmHg; P = 0.01), but not at T12 (T2D: 13.4 ± 8.1 ms/mmHg vs Healthy: 9.2 ± 6.0 ms/mmHg; P = 0.16). T2DM rats had higher visceral fat mass, adiponectin, and insulin concentrations compared with control rats (all P < 0.01). Changes in adiponectin and insulin concentrations over the measured time-points mirrored one another and were opposite those of the BRS in T2DM rats. These findings demonstrate that obesity-related metabolic impairments may contribute to an attenuated spontaneous BRS in T2DM, suggesting a link between metabolic and autonomic dysfunction.
Keywords: Adiponectin; Baroreflex function; Insulin; Obesity; UCD-T2DM.
Published by Elsevier B.V.
Conflict of interest statement
Declaration of competing interest The authors declared no potential conflicts of interest with respect to the research, authorship, and/or publication of this article.
Figures


References
-
- Abdel-Rahman AR, Merrill RH, Wooles WR, 1994. Gender-related differences in the baroreceptor reflex control of heart rate in normotensive humans. J Appl Physiol 77, 606–13. - PubMed
-
- Al-Assi O, Ghali R, Mroueh A, Kaplan A, Mougharbil N, Eid AH, Zouein FA, El-Yazbi AF, 2018. Cardiac Autonomic Neuropathy as a Result of Mild Hypercaloric Challenge in Absence of Signs of Diabetes: Modulation by Antidiabetic Drugs. Oxidative Medicine and Cellular Longevity 2018, e9389784. 10.1155/2018/9389784 - DOI - PMC - PubMed
-
- Arita Y, Kihara S, Ouchi N, Takahashi M, Maeda K, Miyagawa J, Hotta K, Shimomura I, Nakamura T, Miyaoka K, Kuriyama H, Nishida M, Yamashita S, Okubo K, Matsubara K, Muraguchi M, Ohmoto Y, Funahashi T, Matsuzawa Y, 1999. Paradoxical decrease of an adipose-specific protein, adiponectin, in obesity. Biochem Biophys Res Commun 257, 79–83. 10.1006/bbrc.1999.0255 - DOI - PubMed
-
- Bahceci M, Gokalp D, Bahceci S, Tuzcu A, Atmaca S, Arikan S, 2007. The correlation between adiposity and adiponectin, tumor necrosis factor alpha, interleukin-6 and high sensitivity C-reactive protein levels. Is adipocyte size associated with inflammation in adults? J Endocrinol Invest 30, 210–214. 10.1007/BF03347427 - DOI - PubMed

