. 2023 Aug 31;186(18):3983-4002.e26.
doi: 10.1016/j.cell.2023.07.039.

Phage-assisted evolution and protein engineering yield compact, efficient prime editors

Affiliations

Phage-assisted evolution and protein engineering yield compact, efficient prime editors

Jordan L Doman et al. Cell. .

Abstract

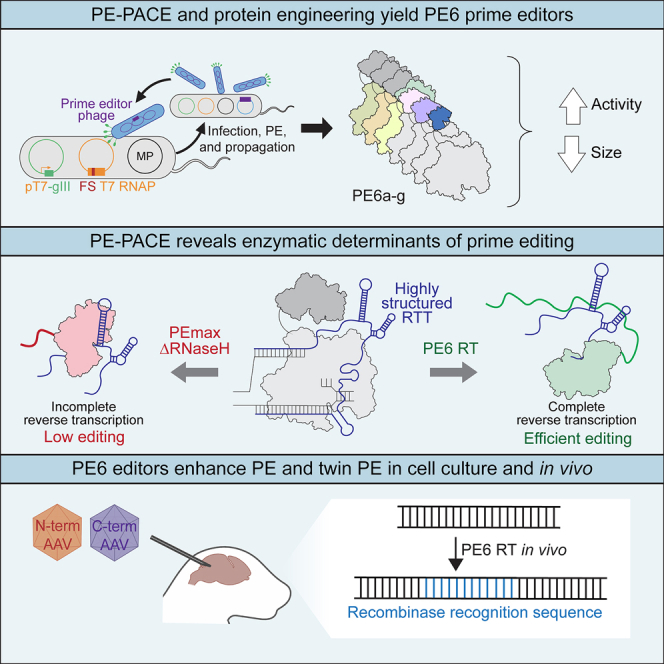
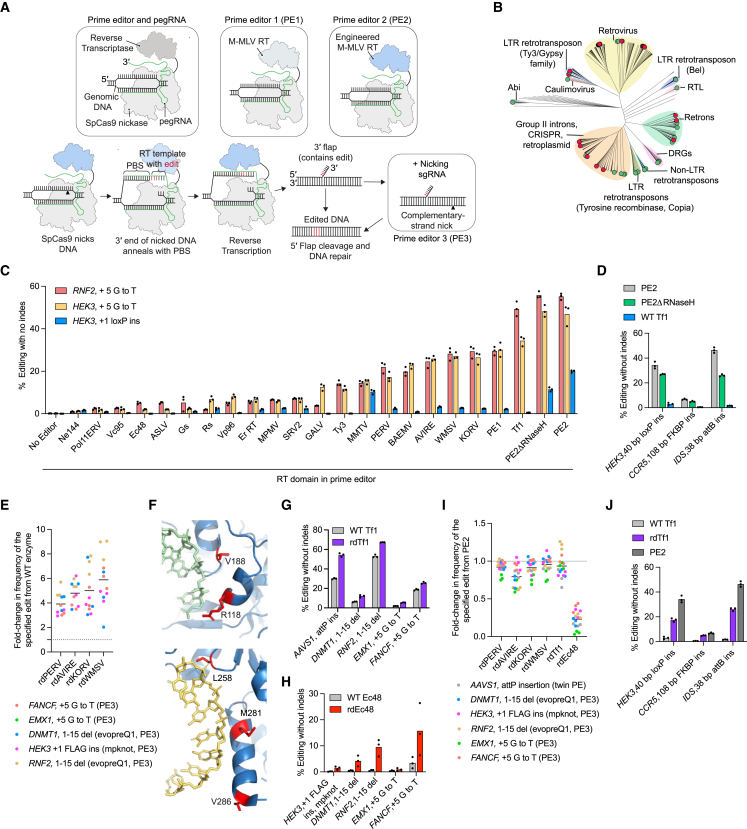
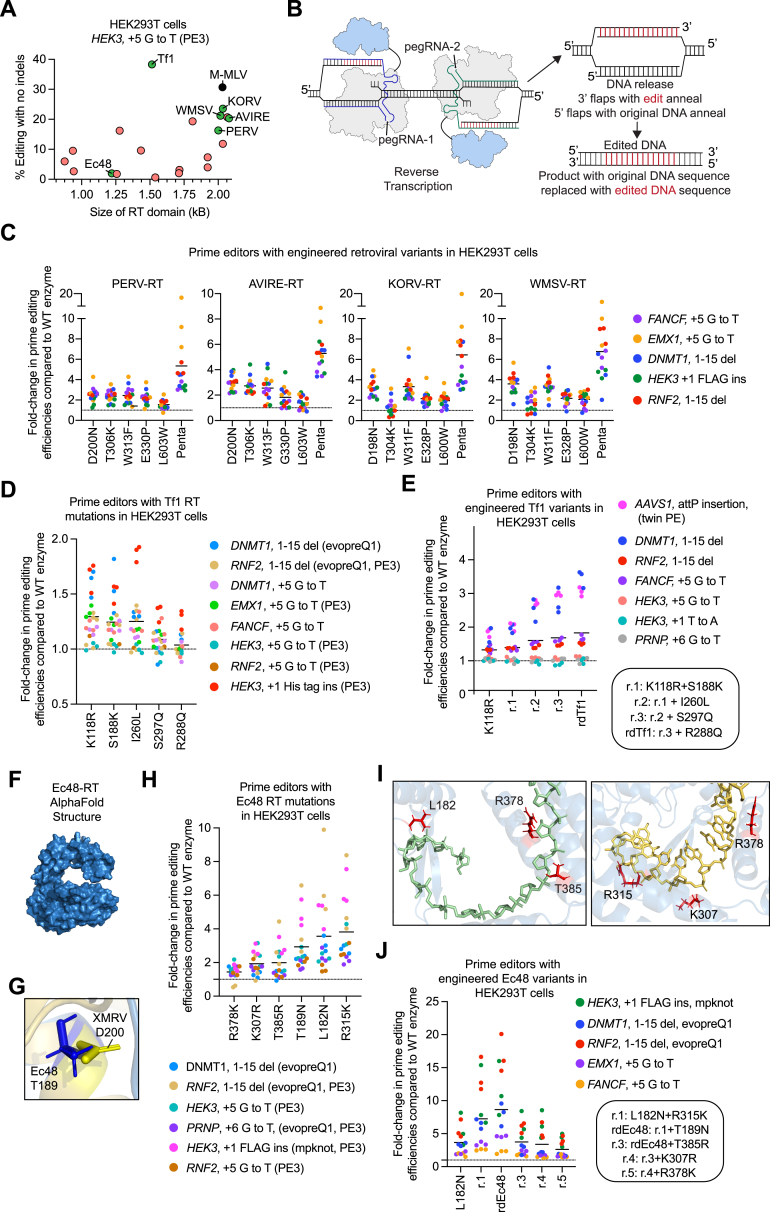
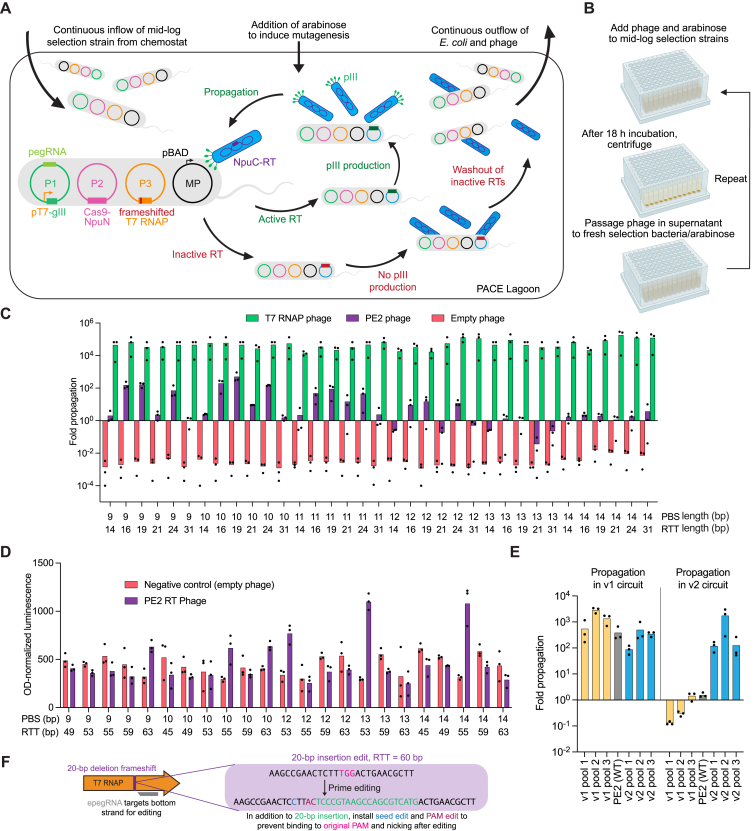
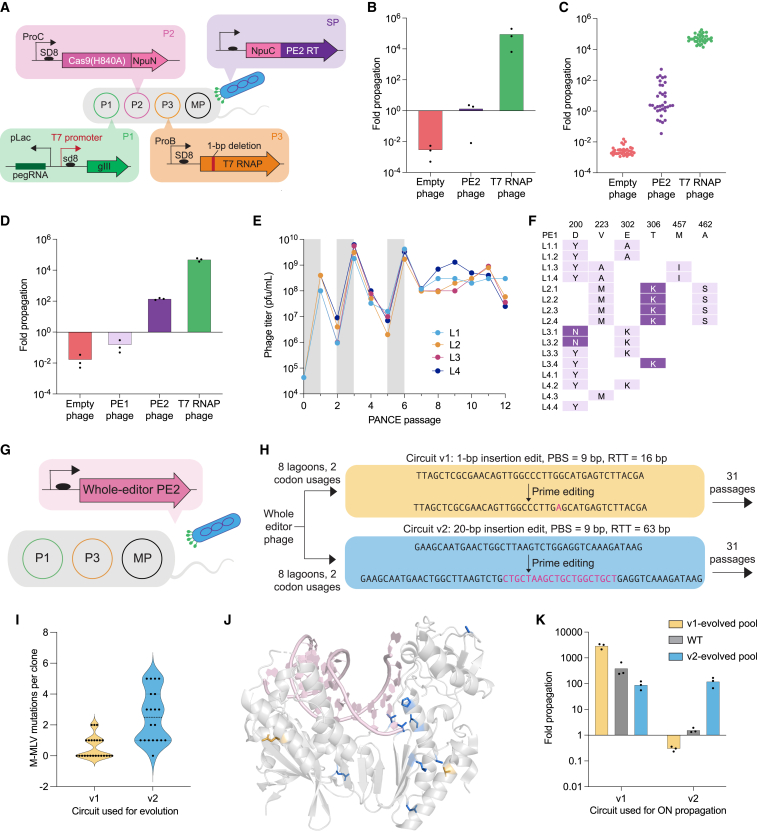
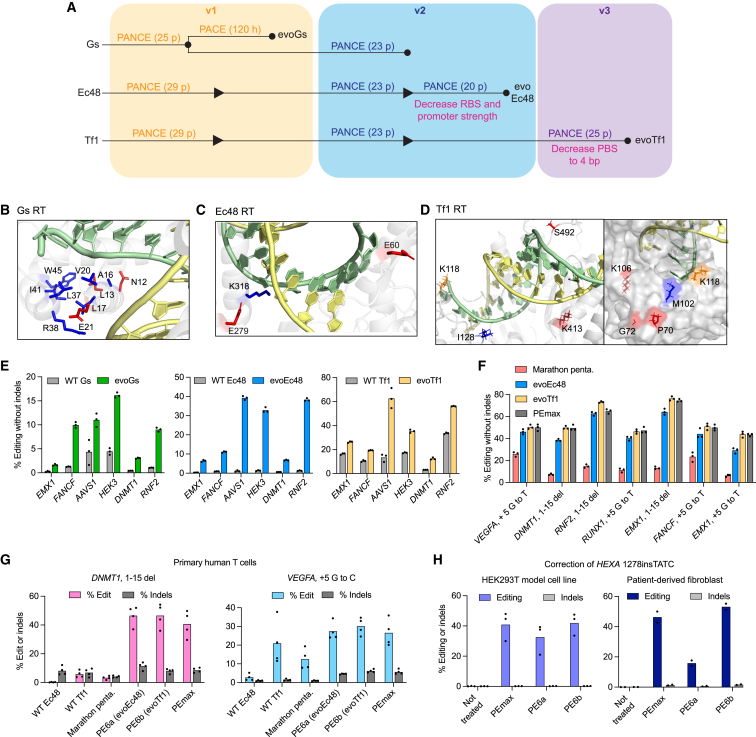
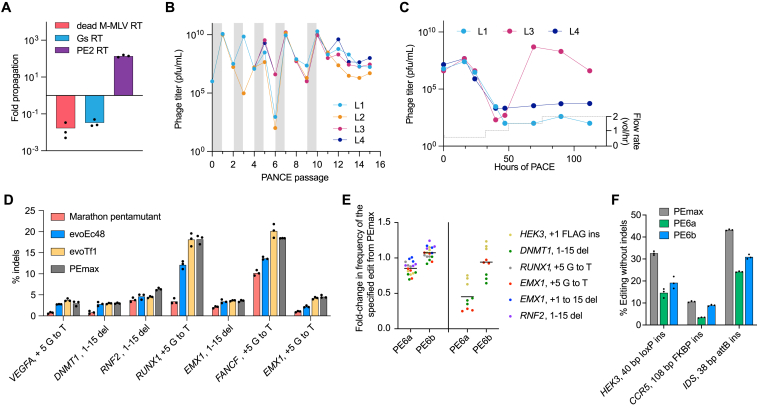
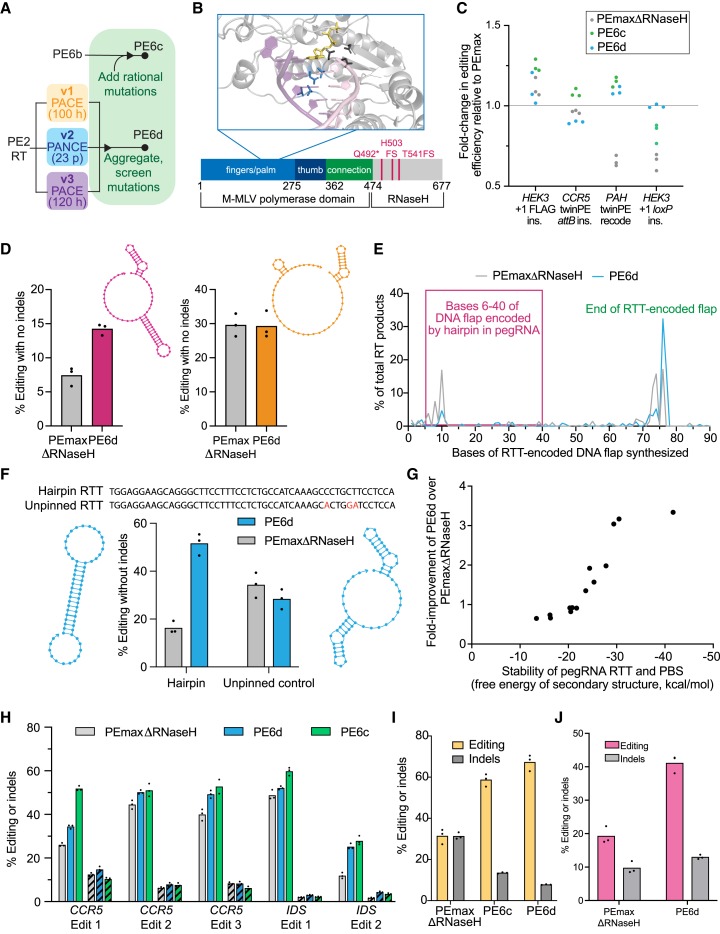
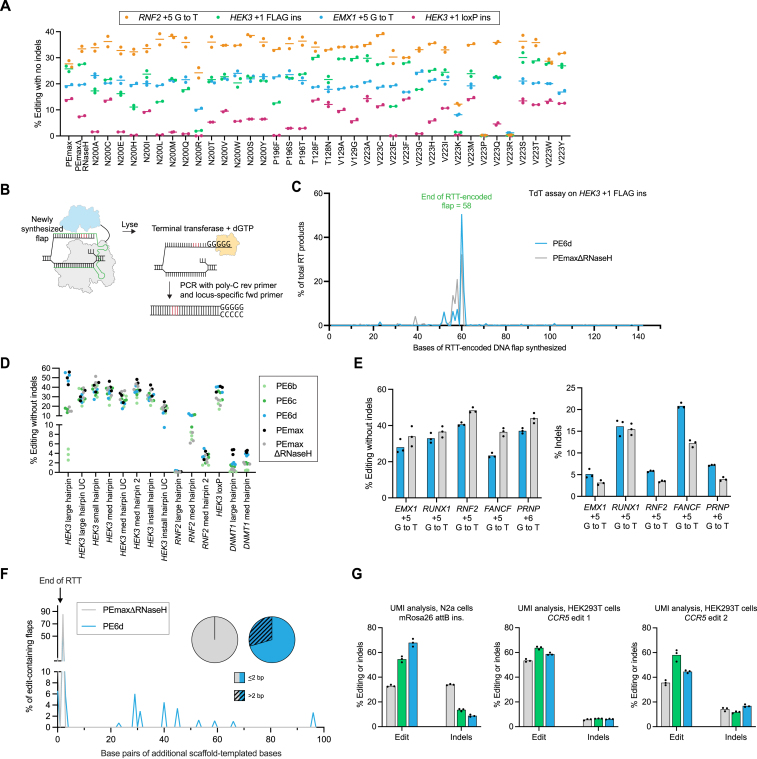
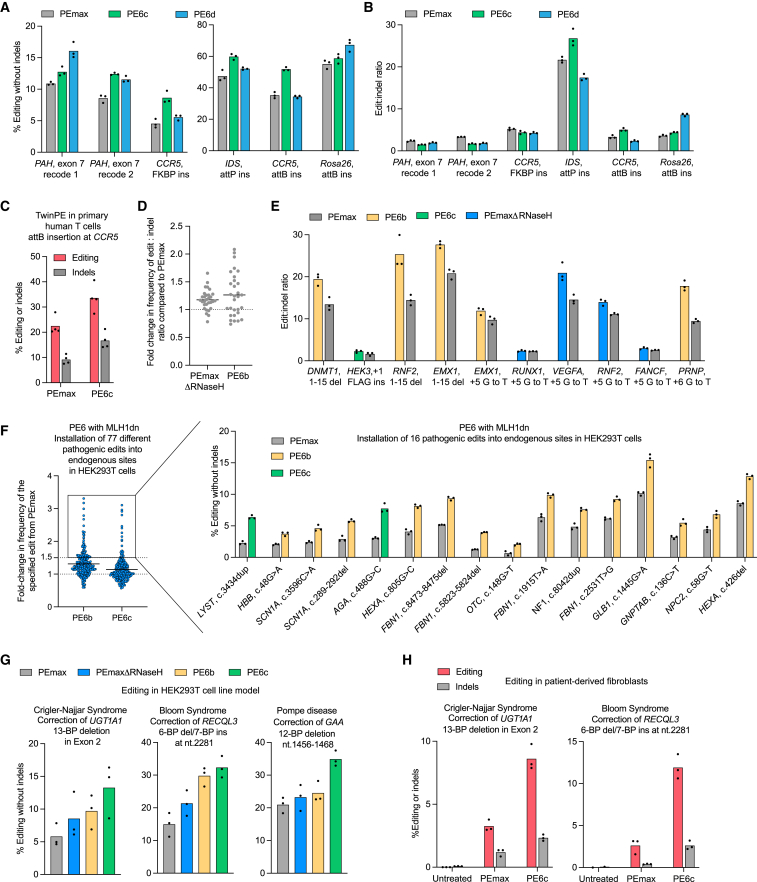
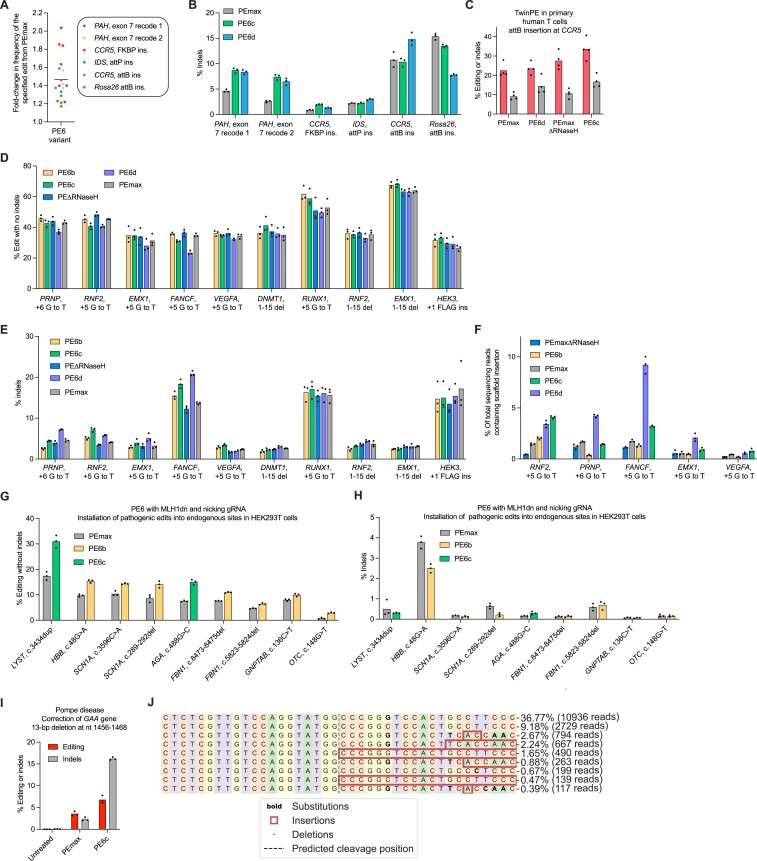
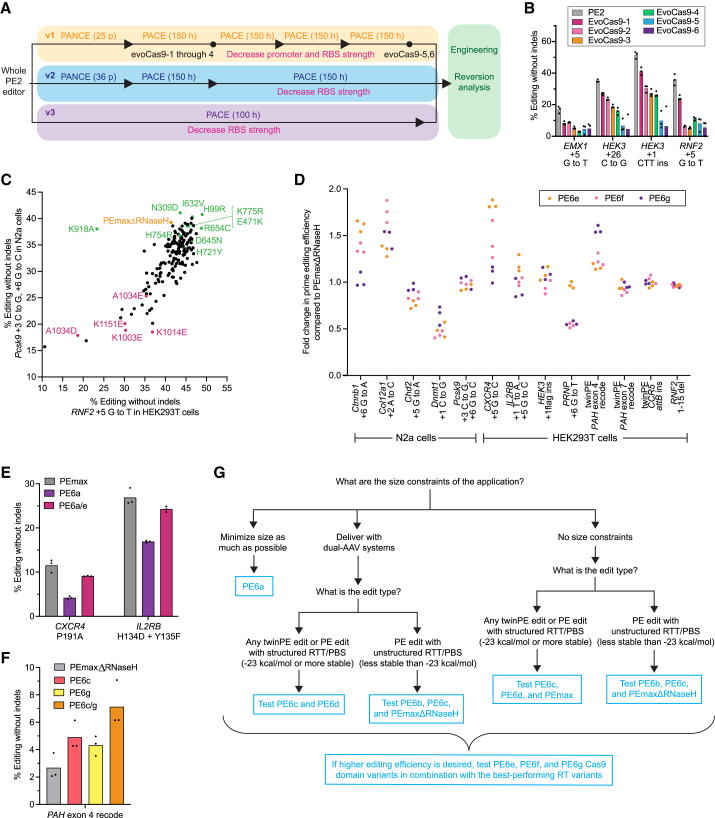
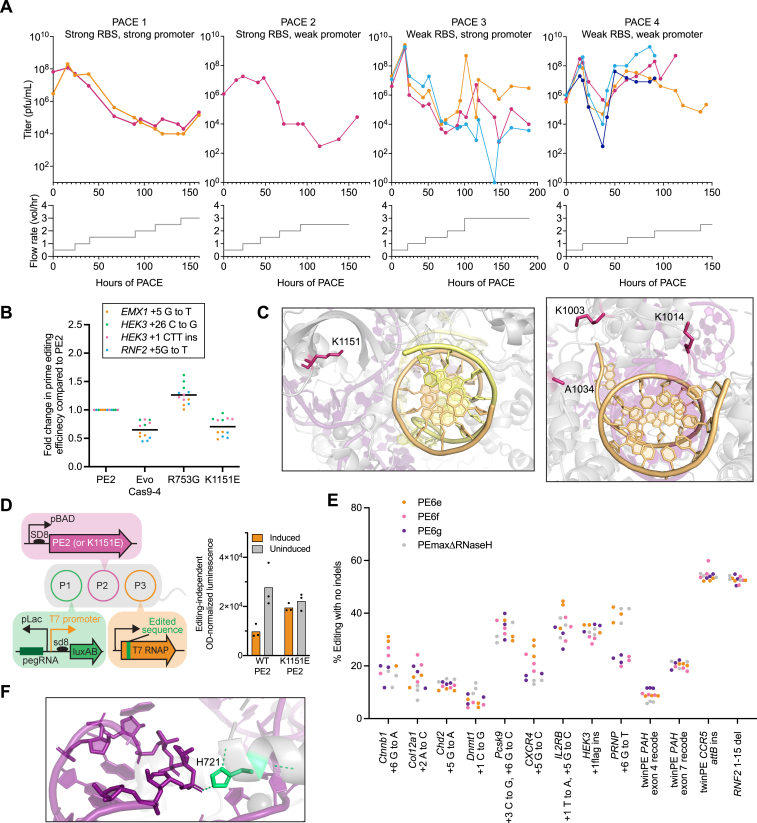
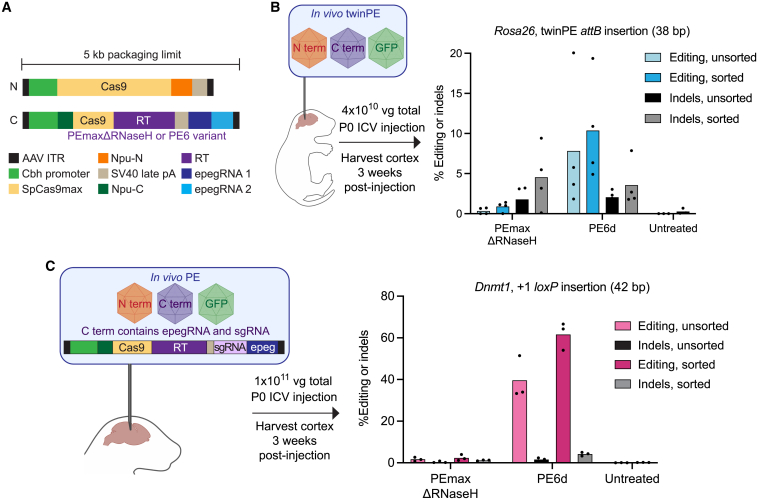
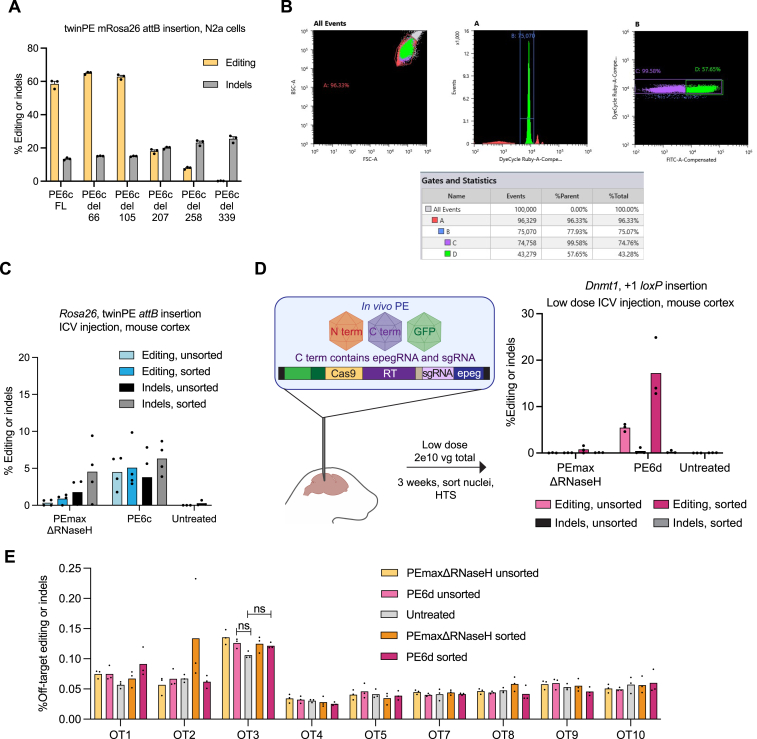
Prime editing enables a wide variety of precise genome edits in living cells. Here we use protein evolution and engineering to generate prime editors with reduced size and improved efficiency. Using phage-assisted evolution, we improved editing efficiencies of compact reverse transcriptases by up to 22-fold and generated prime editors that are 516-810 base pairs smaller than the current-generation editor PEmax. We discovered that different reverse transcriptases specialize in different types of edits and used this insight to generate reverse transcriptases that outperform PEmax and PEmaxΔRNaseH, the truncated editor used in dual-AAV delivery systems. Finally, we generated Cas9 domains that improve prime editing. These resulting editors (PE6a-g) enhance therapeutically relevant editing in patient-derived fibroblasts and primary human T-cells. PE6 variants also enable longer insertions to be installed in vivo following dual-AAV delivery, achieving 40% loxP insertion in the cortex of the murine brain, a 24-fold improvement compared to previous state-of-the-art prime editors.

Keywords: CRISPR-Cas9; directed evolution; genome editing; guide RNAs; pegRNAs; phage-assisted continuous evolution; prime editing; protein engineering.


Conflict of interest statement

Declaration of interests J.L.D., S.P., and D.R.L. have filed patent applications on aspects of this work. M.F.R. is an employee of Vertex Pharmaceuticals. J.R.D. is an employee of Prime Medicine. S.B. is an employee of Nvelop Therapeutics. M.J.O. receives compensation as a consultant for Agathos Biologics. D.R.L. is a consultant and equity holder of Beam Therapeutics, Prime Medicine, Pairwise Plants, Chroma Medicine, Resonance Medicine, Exo Therapeutics, and Nvelop Therapeutics. The authors have filed patent applications on evolved and/or engineered prime editors and methods to generate them.

Figures

None
Graphical abstract
Figure 1
Figure 1
Identification and engineering of reverse transcriptase enzymes into prime editor candidates (A) Overview of PE systems. All use a prime editor protein consisting of SpCas9(H840A) nickase fused to a reverse transcriptase (RT) enzyme. PE1 uses the wild-type RT from the Moloney murine leukemia virus (M-MLV), while the PE2 system uses an engineered pentamutant variant of the M-MLV RT. PE3 uses an additional single guide RNA (sgRNA) to nick the non-edited strand. PBS = primer binding site. RT template = reverse transcriptase template. (B) Phylogenetic classification of RTs tested in this study. Red circles indicate PE-active enzymes. Green circles indicate PE-inactive enzymes. (C) Mammalian activity of 20 different RT enzymes in the prime editing system at endogenous sites in HEK293T cells. (D) Comparison of wild-type Tf1 RT, PE2ΔRNaseH, and PE2 at three longer, complex PE (HEK3) or twinPE (CCR5 and IDS) edits in HEK293T cells. (E) Comparison of prime editors containing engineered retroviral RT variants with their wild-type counterparts in HEK293T cells. Horizontal bars show the mean value. (F) Residues mutated to improve editing of the Tf1 RT prime editor correspond to V188, R118, L258, M281 and V286 (red) in Ty3 RT (blue, PDB: 4OL8). V188 and R118 are in close proximity to the RNA (green) substrate and correspond to K118 and S188 in Tf1, respectively. L258, M281 and V286 are near the DNA (yellow) substrate and correspond to I260, S297 and R288 in Tf1, respectively. (G) Rationally designed Tf1 pentamutant variant (rdTf1) shows improvements in editing over its wild-type counterpart in HEK293T cells. All edits are PE edits, except the AAVS1 site, which is twinPE. (H) Rationally designed Ec48 triple mutant variant (rdEc48) shows improvements in editing over its wild-type counterpart for five edits in HEK293T cells. (I) Comparison of prime editors containing engineered RT variants with PE2 in HEK293T cells. All edits use single-flap prime editing, except the AAVS1 site, which uses twinPE. (J) Comparison of rdTf1 with PE2 and its wild-type counterpart at three longer, complex PE (HEK3) or twinPE (CCR5 and IDS) edits in HEK293T cells. Dots indicate individual replicates for n = 3 biological replicates (C–E and G–J). Bars reflect the mean of n = 3 independent replicates (C, D, G, H, and J). See also Figure S1. Throughout all figures (Figures 1, 2, 3, 4, 5, 6, 7, and S1–S7), prime editing efficiencies shown reflect the frequency of the intended prime editing outcome with no indels or other changes at the target site.
Figure S1
Figure S1
Characterization and engineering of reverse transcriptase enzymes for prime editing, related to Figure 1 (A) Native small RT enzymes demonstrate poor activity in the prime editing system (HEK293T cells, HEK3 +5 G to T edit). RT enzymes engineered in Figure 1 are highlighted in green, and the wild-type M-MLV RT used in the PE1 system is highlighted in black. All other enzymes are in red. Dots reflect the mean of n = 3 independent replicates. Of these enzymes that can support detectable mammalian PE activity, 11 are closely related to the M-MLV RT and are encoded by retroviruses, two are encoded by LTR retrotransposons, and seven are bacterial RTs from group-II introns, retrons, or CRISPR-Cas associated systems. (B) Overview of twinPE. The prime editor protein (gray and blue) uses two pegRNAs (dark blue and teal) to target opposite strands of DNA. The prime editor generates two 3’ flaps (red) that are complementary to each other. After these newly synthesized 3’ flaps anneal and the original DNA sequence in the 5′ flaps is degraded, the edited sequence in the flaps is permanently installed at the target DNA site. (C) Incorporation of each of the five mutations analogous to those in PE2 (D200N, T306K, W313F, T330P, and L603W) improves the activity of four retroviral RT enzymes in HEK293T cells. PERV = porcine endogenous retrovirus RT, AVIRE = avian reticuloendotheliosis virus RT, KORV = koala retrovirus RT and WMSV = woolly monkey sarcoma virus RT. Combining all five mutations together (Penta) further improves the activity of each enzyme. All values from n = 3 independent replicates are shown. Horizontal bars show the mean value. (D) Structure-guided rational engineering of the Tf1 RT identifies five mutations that improve prime editing in HEK293T cells. The solved structure of the Tf1 RT homolog, Ty3 RT, was used to predict mutations that could increase contacts of the RT with its DNA-RNA substrate (PDB: 4OL8). All values from n = 3 independent replicates are shown. Horizontal bars show the mean value across all sites and replicates. (E) Combining all mutations identified from structure-guided rational engineering improves the activity of the Tf1 RT prime editor in HEK293T cells. The final rationally designed Tf1 variant (rdTf1) is a combination of five mutations: K118R, S188K, I260L, R288Q and S297Q. All values from n = 3 independent replicates are shown. Horizontal bars show the mean value. (F) AlphaFold-predicted structure of the Ec48 RT enzyme. The predicted structure aligns well with the RT from the xenotropic murine leukemia virus-related virus (XMRV, PDB: 4HKQ), a close relative of the M-MLV RT. (G) Aligning the AlphaFold-predicted structure of the Ec48 RT (blue) with the RT from xenotropic murine leukemia virus-related virus (XMRV, PDB: 4HKQ, yellow), a close relative of the M-MLV RT, suggests that the residue analogous to the D200 residue in M-MLV RT is the T189 residue in Ec48 RT. (H) Structure-guided rational engineering of the Ec48 RT identifies six mutations that improve prime editing in HEK293T cells. An AlphaFold-generated predicted structure of the Ec48 RT was overlayed with the structure of the RT from the xenotropic murine leukemia virus-related virus (XMRV) (PDB: 4HKQ) to perform structure-guided mutagenesis. All values from n = 3 independent replicates are shown. Horizontal bars show the mean value. (I) Positions of residues (red) proximal to the substrate that were mutated to improve the activity of the Ec48 RT prime editor. Residues are mapped onto the predicted AlphaFold structure of the Ec48 RT aligned with the solved substrate of the XMRV RT (PDB: 4HKQ). L182 and T385 are proximal to the DNA substrate (green), R315 and K307 are proximal to the RNA substrate (yellow) and R378 is proximal to both the DNA and RNA rate. (J) Combining the top three mutations identified from structure-guided engineering improves the activity of the Ec48 RT prime editor in HEK293T cells. The final rationally designed Ec48 RT variant (rdEc48) contains three mutations: L182N, T189N and R315K. All values from n = 3 independent replicates are shown. Horizontal bars show the mean value.
Figure S2
Figure S2
Design and validation of a PE-PACE circuit, related to Figure 2 (A) Summary of phage-assisted continuous evolution (PACE). In both PACE and PANCE, the desired activity of a biomolecule of interest is linked to propagation of a modified M13 bacteriophage. To achieve this linkage, gIII, a gene required for phage propagation, is moved from the phage genome to a plasmid in host E. coli cells under the control of a gene circuit, such that gIII expression and phage propagation are only possible if the phage contain gene(s) that encode proteins with the desired activity. Simultaneous expression of mutagenic proteins from the MP6 plasmid mutagenizes the phage, including the gene of interest. During PACE, continuous dilution of a fixed-volume ‘lagoon’ with fresh host cells selects for rapidly propagating phage encoding molecules that trigger gIII expression (Figure S2A). PANCE uses the same selection strategy, but is implemented using discrete dilution steps every 12–24 h (Figure S2B): PANCE thus offers higher sensitivity (lower stringency) and greater ease of parallelization than PACE, with the trade-off of slower evolution. Both methods can complete dozens of generations of mutagenesis and selection every 24 h. Host E. coli (gray) harboring relevant selection circuit plasmids (green, pink, and orange) and the mutagenesis plasmid (MP, black) continuously flow into a fixed-volume lagoon (left). Addition of arabinose induces expression of mutagenic genes on the MP. Selection phage (blue) harboring an NpuC-RT transgene (purple) infect the E. coli and are mutagenized. If a mutagenized RT is inactive (red, bottom/right), then prime editing does not trigger gIII expression and pIII production, and phage are not able to propagate. These phage encoding inactive RTs are washed out of the lagoon by continuous flow. If a mutagenized RT is active (green, center), then prime editing leads to pIII production, and phage encoding that RT can propagate faster than the rate at which they are diluted out of the lagoon. (B) Summary of phage-assisted non-continuous evolution (PANCE). The same principles shown above in Figure S2A are used in PANCE, except periodic discrete dilution steps instead of continuous flow is used to dilute selection cultures. Mid-log phase cultures of selection E. coli are infected with phage, and arabinose is added to induce mutagenesis (left). After an overnight incubation, cultures are centrifuged to pellet bacteria and allow isolation of propagating phage from the supernatant (middle). A small volume of supernatant (typically a 1:50 dilution factor) is used to infect a fresh lagoon of mid-log selection strains (right). This process is iterated until phage titers stabilize (i.e., when overnight phage propagation is equal to or greater than the dilution factor). (C) Effect of pegRNA optimization on PE2 phage propagation. Overnight propagation of empty phage (native control, red), PE2 phage (purple), and T7 RNAP phage (positive control, green) in strains harboring pegRNAs of different PBS and RTT lengths. Bars reflect the mean of n = 3 independent replicates. Dots show individual replicate values. This data was used to generate Figure 2C. (D) Luciferase assay to screen pegRNAs for the v2 PE-PACE circuit. Selection strains encoding luxAB transcriptionally coupled to gIII were infected with either empty phage (red) or PE2 phage (purple). 4 h after infection, OD600-normalized luminescence was measured as a proxy for circuit activation. Bars reflect the mean of n = 3 independent replicates. Dots show individual replicate values. Strains in which PE2 phage outperformed empty phage were used for v2 evolutions. (E) Overnight propagation of pools of wild-type RT and evolved RT phage on their cognate or noncognate host-cell selection strains. Additional evolved pools of phage are shown here beyond those provided in Figure 2K. Phage were from PANCE on the v1 circuit (yellow bars), from PANCE on the v2 circuit (blue bars), or wild-type-PE2 phage (gray bars). Propagation was then measured in the v1 circuit (left) or the v2 circuit (right). Bars reflect the mean of n = 3 independent replicates. Dots show individual replicate values. (F) Design of v3 circuit and improvements compared to v1 and v2 designs. A long insertion edit (20-bp insertion edit with a 60-bp RTT) was used to select for high-processivity, high-activity prime editors. Unlike v1 and v2 circuits, the v3 pegRNA (gray) targets the noncoding strand of T7 RNAP; this shortens the time between prime editing and wild type T7 RNAP production. In addition to the 20-bp insertion (green) needed to restore the frame of T7 RNAP, the v3 pegRNA also encodes silent PAM edits (maroon) and a seed edit (blue) that prevents subsequent binding and nicking of the edited sequence.
Figure 2
Figure 2
Development and validation of a prime editing PACE selection (A) Schematic of PE-PACE selection circuit. Upon infection of E. coli by selection phage (blue), the NpuN intein and NpuC intein (pink) mediate reconstitution of the PE2 prime editor (purple and pink), which engages a pegRNA (dark green) and corrects a frameshift in T7 RNAP (orange) via PE. Functional T7 RNAP then transcribes gIII (light green), which enables SP propagation. (B) Phage replication levels from overnight propagation of empty phage (red), NpuC-PE2-RT phage (purple), and T7-RNAP phage (green) in PE-PACE host cells before pegRNA optimization. (C) Screen of pegRNAs for the v1 PE-PACE circuit. Overnight propagation values of empty phage (red), NpuC-PE2-RT phage (purple), and T7-RNAP phage (green) are shown. Each point reflects the mean value of n = 3 independent biological replicates for a different pegRNA. Individual replicates are shown in Figure S2C. (D) Overnight propagation of empty phage (red), NpuC-PE1-RT phage (light purple), NpuC-PE2-RT phage (dark purple), and T7-RNAP phage (green) in the v1 pegRNA-optimized circuit. (E) PANCE titers for the evolution of NpuC-PE1-RT phage. Gray shading indicates a passage of evolutionary drift, in which phage were supplied gIII in the absence of selection. Titers of four replicate lagoons are shown. (F) Mutation table for NpuC-PE1-RT phage surviving v1 PANCE. Four clones per lagoon (L1-L4, with clones ordered by lagoon) were sequenced. Light purple denotes conserved mutations. Dark purple denotes conserved mutations also present in the previously engineered PE2 RT1. (G) Schematic of the PE-PACE selection for evolution of the whole prime editor, including the Cas9 domain. The P1 plasmid (green) and P3 plasmid (orange) are identical to those used in Figure 2A. (H) PANCE experiment to compare the outcome of selection on v1 and v2 selection circuits. Replicate lagoons were evolved on each (v1, yellow and v2, blue) selection circuit. After 31 passages, clones from each selection were sequenced, and the resulting mutations were compared to generate (I-K). (I) Violin plots showing the number of mutations per clone for the M-MLV domain of whole-editor phage evolved with either the v1 (yellow) or v2 (blue) circuit. Data are shown as individual values, with one dot representing one sequenced phage. The mean value is shown as a dotted line. (J) Predicted positions of mutated residues in M-MLV from v1 (yellow) or v2 (blue) PANCE. The structure is from the highly homologous XMRV (PDB: 4HKQ). (K) Overnight propagation of pools of wild-type RT and evolved RT phage on their cognate or noncognate host-cell selection strains. Phage were from PANCE on the v1 circuit (yellow bars), from PANCE on the v2 circuit (blue bars), or wild-type-PE2 phage (gray bars). Propagation was then measured in the v1 circuit (left) or the v2 circuit (right). Bars reflect the mean of n = 3 independent replicates, and dots show individual replicate values (B, D, K). See also Figure S2.
Figure 3
Figure 3
Phage-assisted evolution of compact RTs for prime editing (A) Summary of evolution campaigns for NpuC-Gs RT, NpuC-Ec48 RT, or NpuC-Tf1 RT phage in the v1 (yellow), v2 (blue), and v3 (purple) PE-PACE circuits. Whether an evolution was PANCE or PACE is specified. PANCE passages (p) or hours of PACE (h) are specified in parentheses. Arrowheads indicate increases in selection stringency. Mutants characterized in mammalian cells are denoted with a dot and labeled. Additional increases in stringency are in pink. (B) Position of residues in wild-type Gs RT (PDB: 6AR1) that were mutated during evolution. (C) Predicted positions of residues in Ec48 RT that were mutated during evolution. Residues are mapped onto the AlphaFold-predicted structure of Ec48 RT overlayed with the substrate of the XMRV RT (PDB: 4HKQ). (D) Predicted positions of residues in Tf1 RT that were mutated during evolution. Residues are mapped onto the AlphaFold predicted structure of Tf1 RT overlayed with the substrate of the Ty3 RT (PDB: 4OL8). (E) Prime editing using prime editors containing wild-type (gray) Gs, Ec48, and Tf1 RTs, evolved Gs-RT (evoGs, green), evolved Ec48 RT (evoEc48, blue), and evolved Tf1 RT (evoTf1, yellow) in HEK293T cells (n = 3 independent replicates). (F) Comparison of prime editors in the optimized PEmax architecture containing either engineered pentamutant Marathon RT (Marathon penta, red), evoEc48 (blue), or evoTf1 (yellow) with PEmax (gray) in HEK293T cells (n = 3 independent replicates). (G) Prime editing in primary human T-cells at commonly edited test loci (n = 4 independent replicates). Indel-free editing is shown in blue or pink, and indels are shown in gray. (H) Correction of the HEXA 1278insTATC mutation that causes Tay-Sachs disease in a HEK293T cell line model previously engineered to harbor the mutation (left) and in patient-derived fibroblasts (right). n = 3 independent replicates were used for the HEK293T cell line model. n = 2 independent replicates were used for the patient-derived fibroblasts. For B-D, the DNA substrate is green, RNA substrate is yellow, residues mutated following PANCE in the v1 circuit are blue, residues mutated following PANCE in the v2 circuit are red, and residue mutated following PANCE in the v3 circuit is orange. For (E–H), bars show the mean value for the specified number of replicates, and dots show individual replicate values. See also Figure S3.
Figure S3
Figure S3
Evolution and characterization of compact RTs for prime editing, related to Figure 3 (A) Overnight propagation of phage encoding dead M-MLV RT (red), Gs (blue), or PE2 (purple) RTs in the NpuC-RT phage architecture in the pegRNA-optimized v1 PE-PACE circuit. Bars reflect the mean of n = 3 independent replicates. Dots show individual replicate values. (B) Phage titers during PANCE of NpuC-Gs-RT phage. Gray shading indicates a passage of evolutionary drift, in which phage were supplied gIII in the absence of selection to allow free mutagenic replication. Titers of four replicate lagoons are shown. (C) PACE of NpuC-Gs-RT phage. The left y axis and pink and blue lines show the SP titer of three different replicate lagoons at various timepoints. The right y axis and dotted gray line show the flow rate in volumes per hour. (D) Indel frequencies for prime editors in the optimized PEmax architecture containing either engineered pentamutant Marathon RT (Marathon penta, red), evoEc48 (blue), or evoTf1 (yellow) with PEmax (gray) in HEK293T cells. Editing frequencies corresponding to this data is in Figure 3F. Bars reflect the mean of three independent replicates. Dots show individual replicate values. (E) Performance of PE6a and PE6b in the presence and absence of epegRNAs in HEK293T cells. All values from n = 3 independent replicates are shown. Horizontal bars show the mean value. (F) Comparison of PE6a, PE6b, and PEmax at three longer, complex edits in HEK293T cells. Bars reflect the mean of n = 3 independent replicates. Dots show individual replicate values.
Figure 4
Figure 4
Development of dual-AAV compatible RT variants for installing long, complex edits (A) Summary of evolution and engineering campaigns used to generate PE6c and PE6d. (B) Conserved mutations from M-MLV RT evolution. The structure of XMRV RT (PDB: 4HKQ), which is highly homologous to M-MLV shows PACE-evolved residues (blue) lie close to the enzyme active site (dark gray) and DNA/RNA duplex substrate (pink/purple). An incoming dNTP, modeled by alignment with PDB: 5TXP, is shown in yellow. Below, pink lines indicate locations in the M-MLV RT at which PACE-evolved mutations truncated the protein. (C) Fold-change in editing efficiency relative to PEmax for PEmaxΔRNaseH, PE6c, and PE6d in HEK293T cells. Individual replicates are plotted, with n = 3 biological replicates per edit. (D) Editing efficiencies of PEmaxΔRNaseH and PE6d at the HEK3 +1 loxP insertion edit (pink) and the HEK3 +1 FLAG insertion edit (orange) in HEK293T cells. The NUPACK-predicted structures of the RTT and PBS extensions for each edit is shown. (E) Results of a TdT assay on the HEK3 +1 loxP insertion edit in HEK293T cells. The y axis indicates the percentage of total RT products of a given length, and the x axis represents the length of the product in base pairs. PEmaxΔRNaseH is shown in gray, and PE6d is shown in blue. The lines are mean values from n = 3 biological replicates. The pink box indicates DNA bases templated by the structured portions of the pegRNA. (F) Editing efficiencies of PEmaxΔRNaseH (gray) and PE6d (blue) at an example engineered hairpin edit and its corresponding unpinned control in HEK293T cells. The sequence of the RTT is shown, with point mutations in the unpinned control shown in red. The NUPACK-predicted structures of the RTT and PBS extensions for each edit is shown. (G) Relationship between pegRNA RTT/PBS secondary structure and PE6d improvements. The y axis reflects the fold-improvement of PE6d over PEmaxΔRNaseH. The x axis is the absolute value of the free energy of pegRNA folding as measured by NUPACK. Each dot represents one edit in HEK293T cells that was calculated from the mean values from n = 3 biological replicates. See Figure S4D for individual editing values and edit identities. (H) Comparison of evolved and engineered RTs to PEmaxΔRNaseH at typical twinPE edits in HEK293T cells. Solid bars indicate editing efficiency. Striped bars indicate indels. (I) TwinPE-mediated insertion of the 38-bp attB sequence into the Rosa26 locus in N2a cells. Indel-free editing is shown in yellow, and indels are shown in gray. (J) PE-mediated insertion of a 42-bp sequence containing loxP into the Dnmt1 locus in N2a cells. Indel-free editing is shown in yellow, and indels are shown in gray. For D, F, and H-J, bars reflect the mean of n = 3 independent replicates. Dots show individual replicate values. See also Figure S4.
Figure S4
Figure S4
Development and characterization of highly processive, dual AAV-compatible RTs, related to Figure 4 (A) Editing efficiencies of prime editors containing single M-MLV mutants in HEK293T cells. Prime editing efficiencies used are the frequency of the intended prime editing outcome with no indels or other changes at the target site. Lines reflect the mean of n = 2 independent replicates per edit. Dots show individual replicate values. (B) Overview of the terminal deoxynucleotidyl transferase (TdT) assay for directly sequencing newly reverse-transcribed DNA flaps that have not been incorporated into the genome. 24 h after treatment with a prime editor and pegRNA, cells are lysed, and DNA is purified to capture and sequence newly reverse-transcribed DNA before its incorporation into the genome. A terminal transferase enzyme (yellow) adds a polyG sequence to all DNA 3′ ends. PCR amplification for high-throughput DNA sequencing is performed using a locus-specific forward primer and a polyC reverse primer. (C) Results of a TdT assay on the HEK3 +1 FLAG insertion edit in HEK293T cells. The y axis indicates the percentage of total RT products of a given length, and the x axis represents the length of the product in base pairs. PEmaxΔRNaseH is shown in gray, and PE6d is shown in blue. The lines are mean values from n = 3 biological replicates. (D) Editing efficiencies of PE6b-d, PEmax, and PEmaxΔRNaseH for edits engineered to contain varying levels of secondary structure. “UC” indicates an unpinned control for a corresponding hairpin edit. These values were used to generate the free energy vs. fold improvement plot in Figure 4G. All edits are in HEK293T cells. Individual replicates are shown, with n = 3 replicates per condition. (E) Editing efficiencies (left) and indel rates (right) of PE6d (blue) and PEmaxΔRNaseH (gray) for a series of prime edits that use short unstructured pegRNAs in HEK293T cells. Bars reflect the mean of n = 3 independent replicates. Dots show individual replicate values. (F) Results of a TdT assay on the RNF2 +5 G to T edit in HEK293T cells. Note that the x axis differs from other TdT plots shown in this study: instead of RTT-templated bases correctly installed, it quantifies the number of sgRNA scaffold-templated bases aberrantly installed (for example, x = 1 indicates the addition of one extra scaffold-templated base). The y axis indicates the percentage of edit-containing flaps that have a given number of scaffold-templated bases. For each prime editor, the line reflects the mean of n = 3 independent replicates. Pie charts indicate the percentages of edit-containing flaps that either have ≤2 bp (solid color) or >2 bp (striped) of scaffold-templated bases. Data shown are the mean of three independent biological replicates. (G) Unique molecular identifier (UMI) analysis of prime editing efficiencies for twinPE edits in N2a cells (left) and HEK293T cells (middle, right). UMI protocol was applied to remove PCR bias, and trends agree with the data shown in Figure 4. Bars reflect the mean of n = 3 independent replicates. Dots show individual replicate values.
Figure 5
Figure 5
Characterization of PE6 variants compared with PEmax (A) Prime editing efficiencies of PE6c, PE6d, and PEmax at challenging twinPE edits in HEK293T cells. (B) Edit to indel ratios of PE6c, PE6d, and PEmax at sites shown in (A) in HEK293T cells. (C) Twin prime editing in primary human T-cells at the CCR5 safe harbor locus. Indel-free editing is shown in red, and indels are shown in gray. Bars reflect the mean of n = 4 independent replicates. Dots show individual replicate values. (D) Edit to indel ratios of PE6b and PEmaxΔRNaseH normalized to that of PEmax in HEK293T cells. Individual replicates are plotted, with n = 3 biological replicates per edit. Lines reflect the mean across all edits and replicates. Individual editing efficiencies and indel levels are shown in Figures S5D and S5I. (E) Edit to indel ratios of prime editors at endogenous HEK293T sites. The editor with the highest edit:indel ratio was picked and plotted side-by-side with PEmax for each specific edit. Bars reflect the mean of n = 3 independent replicates. Dots show individual replicate values. Individual editing efficiencies and indel levels are shown in Figures S5D and S5E. (F) Prime editing efficiencies of PE6b and PE6c normalized to the editing efficiency of PEmax at 77 edits that install a pathogenic allele into endogenous sites in HEK293T cells. No nicking gRNA was used and MLH1dn plasmid was simultaneously transfected with prime editor plasmid for all conditions. All values from n = 3 replicates are shown. Lines reflect the mean across all edits and replicates. Prime editing efficiencies for edits where PE6b or PE6c outperformed PEmax by more than 1.5-fold are shown on the right. Bars reflect the mean of n = 3 independent replicates. Dots show individual replicate values. (G) Correction of pathogenic mutations implicated in Crigler-Najjar Syndrome, Bloom Syndrome, and Pompe disease in HEK293T cell models using PEmax, PEmaxΔRNaseH, PE6b, and PE6c. (H) Correction of mutations implicated in Crigler-Najjar Syndrome (UGT1A1) and Bloom Syndrome (RECQL3) in patient-derived fibroblast using PE6c and PEmax. Bars reflect the mean of n = 3 independent replicates for treated samples and n = 1–3 replicates of an untreated control for editing (red) and indels (gray). Dots show individual replicate values. For A, B, and G, bars reflect the mean of n = 3 independent replicates. Dots show individual replicate values. See also Figure S5.
Figure S5
Figure S5
Comparison of PE6 variants with PEmax, related to Figure 5 (A) Prime editing efficiencies of the best performing PE6 variant (either PE6c or PE6d) normalized to the editing efficiency of PEmax at sites tested in Figure 5A. All values from n = 3 independent replicates are shown. Editing was performed in HEK293T cells. The horizontal bar shows the mean value. (B) Indel frequencies of PEmax, PE6c, and PE6d at edits tested in Figure 5A. This data was used for Figure 5B. Bars reflect the mean of three independent replicates. Editing was performed in HEK293T cells. Dots show individual replicate values. (C) Screening PE6 variants for insertion of attB into the CCR5 locus in primary human T cells. Bars reflect the mean of n = 4 independent replicates for editing (red) and indels (gray). Dots show individual replicate values. (D) Absolute prime editing efficiencies of PE6 variants, PEmaxΔRNaseH, and PEmax in HEK293T cells used to plot data for Figures 5D and 5E. Prime editing efficiencies used are the frequency of the intended prime editing outcome with no indels or other changes at the target site. Bars reflect the mean of three independent replicates. Dots show individual replicate values. (E) Indel frequencies of PE6 variants, PEmaxΔRNaseH, and PEmax in HEK293T cells used to plot data for Figures 5D and 5E. Bars reflect the mean of three independent replicates. Dots show individual replicate values. (F) Percentage of sequencing reads containing a pegRNA scaffold insertion after prime editing using PE6 variants, PEmaxΔRNaseH, and PEmax in HEK293T cells. These reads contribute to the total indel frequency. Bars reflect the mean of n = 3 independent replicates. Dots show individual replicate values. (G) Prime editing efficiencies for edits where PE6b or PE6c outperformed PEmax using a nicking gRNA. Bars reflect the mean of n = 3 independent replicates. Dots show individual replicate values. Prime editing efficiencies used are the frequency of the intended prime editing outcome with no indels or other changes at the target site in HEK293T cells. (H) Indel frequencies of PE6 variant and PEmax at sites shown in Figure 5F in HEK293T cells. Bars reflect the mean of n = 3 independent replicates. Dots show individual replicate values. (I) Correction of mutation implicated in Pompe disease in patient-derived fibroblast using PE6c and PEmax. Bars reflect the mean of n = 3 independent replicates for editing (red) and indels (gray). Dots show individual replicate values. (J) Distribution of editing outcomes after correction of the pathogenic mutation implicated in Pompe disease in patient-derived fibroblasts using PE6c. The patient was heterozygous. Indel genotypes are shown. Interestingly, many of the indels detected at this site did not contain the silent PAM edit encoded by the pegRNA, suggesting those indels were not RT-templated products.
Figure 6
Figure 6
Evolution and engineering of improved Cas9 domains for prime editing, and summary of PE6 recommended use cases (A) Summary of evolution campaigns for whole PE2 phage in the v1 (yellow), v2 (blue), and v3 (purple) circuits. Green shading indicates reversion analysis. PANCE passages (p) or hours of PACE (h) are in parentheses. Arrowheads indicate increases in selection stringency. Mutants characterized in mammalian cells are denoted with a dot and labeled. Additional increases in stringency are in pink. (B) Evaluation of PACE-evolved clones in HEK293T cells. EvoCas9-1 through evoCas9-4 were isolated from low-stringency evolution. EvoCas9-5 and evoCas9-6 were isolated from high-stringency evolution. (C) Assessment of individual Cas9 mutations on prime editing efficiency at two test sites. The y axis shows editing efficiency at the Pcsk9 +3 C to G / +6 G to C edit in N2a cells. The x axis shows editing efficiency for the RNF2 +5 G to T edit in HEK293T cells. Mutants incorporated into final Cas9 variants are shown in green. Mutants previously shown to, or structurally predicted to, decrease Cas9 binding are shown in maroon. PEmaxΔRNaseH is shown in orange. (D) Comparison of combined Cas9 mutants to PEmaxΔRNaseH in HEK293T cells and N2a cells. Editing efficiencies of variants are normalized to the editing efficiency generated by PEmaxΔRNaseH. Individual replicates are plotted, with n = 3 biological replicates per edit. (E) Comparison of PEmax, PE6a, and PE6a/e at two sites in HEK293T cells. (F) Comparison of PEmaxΔRNaseH, PE6c, and PE6g in HEK293T cells. (G) Decision tree for selecting a PE6 variant. For secondary structure stability predictions, we recommend the NUPACK prediction tool with the RTT/PBS sequence as the input. For B, E, and F, bars reflect the mean of n = 3 independent replicates. Dots show individual replicate values. See also Figure S6.
Figure S6
Figure S6
Evolution and engineering of Cas9 mutants for PE, related to Figure 6 (A) Representative PACE campaign for the v1 circuit. Different colored lines represent different replicate lagoons. PACE experiments with less than four lagoons shown experienced cheating (activity-independent phage propagation likely from rare gene III recombination onto the SP) or washout (complete loss of viable phage) for one or more lagoons. Top graphs represent the phage titer over a PACE experiment. Bottom graphs show the flow rate at the corresponding time. (B) Reversion analysis of EvoCas9-4 in HEK293T cells. Editing efficiency was normalized to the values obtained using PE2. Data are shown as individual data points for n = 3 biological replicates and as the grand mean across the four sites tested. (C) Structural analysis of mutations that harm mammalian prime editing activity. (Left) Structure (PDB: 4UN3) of wild-type Sp Cas9 (gray) bound to its guide RNA (purple) and DNA substrate (yellow/orange). Residue K1151 is shown in dark pink. (Right) Structure (PDB: 4OO8) of wild-type Sp Cas9 (gray) bound to its guide RNA (purple) and DNA substrate (orange). Wild-type residues K1003, K1014, and A1034 are shown in dark pink. (D) To test whether mutations that disrupt DNA binding enhanced circuit propagation via mechanisms other than enhancing PE efficiency, we transformed E. coli with plasmids encoding a corrected wild-type T7 RNAP, the pegRNA used in the v1 circuit, a gIII-luxAB fusion under the T7 promoter, and either a wild-type or K1151E PE2 mutant under the control of an arabinose-inducible promoter. After induction, OD-normalized luminescence for n = 3 biological replicates were used to measure circuit turn on. This system assessed the effect of each editor on the expression of already-corrected T7 RNAP by luciferase signal. Compared to uninduced bacteria, strains induced to express PE2 exhibited a 2.8-fold lower luciferase signal. Strains induced to express the K1151E mutant, though, showed no reduction in T7 RNAP expression. These findings support a model in which PE-PACE not only selects for PE activity, but also selects for avoidance of impeding the expression of edited T7 RNAP. Bars reflect the mean of n = 3 independent replicates. Dots show individual replicate values. (E) Prime editing efficiencies N2a cells (left, Ctnnb1 through Pcks9) and HEK293T cells (right, CXCR4 through RNF2) used to generate the fold changes reported in Figure 6D. Individual replicates are plotted, with n = 3 biological replicates per edit. (F) Structure (PDB: 4UN3) of Cas9 (gray) bound to its sgRNA (purple). Residue H721, which is mutated to Tyr in evolutions, is shown in green sticks. Dotted lines denote predicted polar contacts between H721 and other atoms. The H721Y mutation is predicted to perturb an interaction between Cas9 and stem loop 2 of the guide RNA scaffold, so its effects may differ depending on the pegRNA used.
Figure 7
Figure 7
PE6 variants enable longer and more complex prime edits in vivo (A) Schematic showing a dual-AAV delivery system for twinPE (v3em twinPE-AAV). In the N-terminal AAV, production of the N-terminal portion of Cas9 (yellow) fused to an N-terminal Npu split intein (orange) is regulated by the Cbh promoter (green) and the SV40 late polyA signal (tan). In the C-terminal AAV, the C-terminal Npu split intein (dark green) is fused to the remainder of the prime editor (Cas9, yellow and RT, purple). The SV40 late polyA signal (tan), two epegRNAs (light and dark blue), AAV ITRs (black) are also shown. (B) Injection route and twinPE editing efficiency of PEmaxΔRNaseH and PE6d viruses in the for the twinPE-mediated insertion of a 38-bp attB sequence at murine Rosa26 in the mouse cortex. N- and C- terminal twinPE viruses are administered via ICV injection (4x10¹⁰ vg total) along with a GFP-KASH virus. Editing efficiencies (light and dark blue) and indel frequencies (black and gray) are shown to the right. Bars reflect the mean of n = 3–4 mice. Dots show individual mice. (C) Injection route and PE editing efficiency of PEmaxΔRNaseH and PE6d viruses for the installation of a 42-bp insertion containing loxP at the Dnmt1 locus in the mouse cortex. (Left) The C-terminal virus is modified to include one epegRNA and one nicking sgRNA to encode a PE edit as opposed to a twinPE edit. (Right) Editing efficiencies (light/dark pink) and indel rates (black/gray). Bars reflect the mean of n = 3 mice. Dots show individual mice. See also Figure S7.
Figure S7
Figure S7
In vivo prime editing with PE6c and PE6d delivered via dual AAV, related to Figure 7 (A) Further truncation of the Tf1 RT allowed us to minimize prime editor size an additional 100 bp to facilitate AAV packaging. Editing (yellow) and indels (gray) are shown for the installation of an attB sequence at the murine Rosa26 locus in N2a cells using either PE6c or a truncated variant of PE6c. Bars reflect the mean of n = 3 independent replicates. Dots show individual replicate values. The number below each variant indicates the number of DNA bases that have been deleted from the C-terminal end of the Tf1 gene. (B) Representative flow plots for the isolation of unsorted and sorted nuclei from mouse cortices. Left: scatterplot of all events, gate A set to collect nuclei. Middle: selection of single-nuclei droplets in Gate B, Right: FITC signal was used to collect unsorted cells (Gate C) and transduced, GFP-positive cells (Gate D). (C) TwinPE editing efficiency of PEmaxΔRNaseH and PE6c viruses in the mouse cortex. N- and C- terminal twinPE viruses are administered via ICV injection (4x10¹⁰ vg total) along with a GFP-KASH virus. Editing efficiencies (light and dark blue) and indel (black/gray) rates are shown to the right. Bars reflect the mean of n = 3–4 mice. Dots show individual mice. (D) Injection route and PE editing (Dnmt1 loxP insertion) efficiency of PEmaxΔRNaseH and PE6d viruses at a low viral dose (2 x10¹⁰ vg total) in the mouse cortex. (Left) The C-terminal virus is modified to include one epegRNA and one nicking sgRNA to encode a PE edit as opposed to a twinPE edit. (Right) Editing efficiencies (light/dark pink) and indel rates (black/gray). Bars reflect the mean of n = 3 mice. Dots show individual mice. (E) Off-target editing from AAV-treated and untreated mice. Bars reflect the mean of n = 3 mice. Dots show individual mice. PE6d bulk (light pink) and transduced (dark pink) values were either less than 0.1% on average or were not statistically significant from untreated controls (light gray). For both ns notes, p = 0.08. Analyses were performed with an unpaired t test with Welch correction. The y axis indicates off-target editing and indels summed (see STAR Methods for calculation). OT6 failed to amplify by PCR. All treated samples are from the high AAV dose condition.

References

    1. Anzalone A.V., Randolph P.B., Davis J.R., Sousa A.A., Koblan L.W., Levy J.M., Chen P.J., Wilson C., Newby G.A., Raguram A., Liu D.R. Search-and-replace genome editing without double-strand breaks or donor DNA. Nature. 2019;576:149–157. doi: 10.1038/s41586-019-1711-4. - DOI - PMC - PubMed
    1. Chen P.J., Hussmann J.A., Yan J., Knipping F., Ravisankar P., Chen P.-F., Chen C., Nelson J.W., Newby G.A., Sahin M., et al. Enhanced prime editing systems by manipulating cellular determinants of editing outcomes. Cell. 2021;184:5635–5652.e29. doi: 10.1016/j.cell.2021.09.018. - DOI - PMC - PubMed
    1. Liu B., Dong X., Cheng H., Zheng C., Chen Z., Rodríguez T.C., Liang S.-Q., Xue W., Sontheimer E.J. A split prime editor with untethered reverse transcriptase and circular RNA template. Nat. Biotechnol. 2022;40:1388–1393. doi: 10.1038/s41587-022-01255-9. - DOI - PubMed
    1. Nelson J.W., Randolph P.B., Shen S.P., Everette K.A., Chen P.J., Anzalone A.V., An M., Newby G.A., Chen J.C., Hsu A., Liu D.R. Engineered pegRNAs improve prime editing efficiency. Nat. Biotechnol. 2022;40:402–410. doi: 10.1038/s41587-021-01039-7. - DOI - PMC - PubMed
    1. Zhang G., Liu Y., Huang S., Qu S., Cheng D., Yao Y., Ji Q., Wang X., Huang X., Liu J. Enhancement of prime editing via xrRNA motif-joined pegRNA. Nat. Commun. 2022;13:1856. doi: 10.1038/s41467-022-29507-x. - DOI - PMC - PubMed

Publication types

Substances