. 2023 Nov 15;111(22):3604-3618.e11.
doi: 10.1016/j.neuron.2023.08.002. Epub 2023 Aug 31.

BMAL1 loss in oligodendroglia contributes to abnormal myelination and sleep

Affiliations

BMAL1 loss in oligodendroglia contributes to abnormal myelination and sleep

Daniela Rojo et al. Neuron. .

Abstract

Myelination depends on the maintenance of oligodendrocytes that arise from oligodendrocyte precursor cells (OPCs). We show that OPC-specific proliferation, morphology, and BMAL1 are time-of-day dependent. Knockout of Bmal1 in mouse OPCs during development disrupts the expression of genes associated with circadian rhythms, proliferation, density, morphology, and migration, leading to changes in OPC dynamics in a spatiotemporal manner. Furthermore, these deficits translate into thinner myelin, dysregulated cognitive and motor functions, and sleep fragmentation. OPC-specific Bmal1 loss in adulthood does not alter OPC density at baseline but impairs the remyelination of a demyelinated lesion driven by changes in OPC morphology and migration. Lastly, we show that sleep fragmentation is associated with increased prevalence of the demyelinating disorder multiple sclerosis (MS), suggesting a link between MS and sleep that requires further investigation. These findings have broad mechanistic and therapeutic implications for brain disorders that include both myelin and sleep phenotypes.

Keywords: BMAL1; OPC; circadian; demyelination; multiple sclerosis; myelin; oligodendrocyte; sleep.


Conflict of interest statement

Declaration of interests The authors declare no competing interests.

Figures

Figure 1.
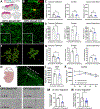
Figure 1.. Time-of-day differences in OPC physiology and circadian gene oscillations.
(A-D) WT OPC dynamics throughout the circadian day. (A) EdU was injected in a single pulse 30 min before perfusion of P21 WT mice. OPC proliferation is significantly higher at the zeitgeber time (ZT) 0 than ZT12 assessed by EdU+/PDGFRα+ co-labelling in the grey matter (cortex, CTX) (ZT0, n = 7; ZT12, n = 6; *P = 0.0287) but not in the white matter (corpus callosum, CC) (ZT0, n = 7; ZT12, n = 6; P = 0.2819). (B) Morphological complexity (filament volume) of OPCs is significantly higher at ZT12 than ZT0 in the cortex (ZT0, n = 7; ZT12, n = 6; **P = 0.0039) but not in corpus callosum (ZT0, n = 7; ZT12, n = 6; P = 0.5648). (C) Photomicrograph (63X) of PDGFRα+ OPCs (green) in the cortex at ZT0 (top) and ZT12 (bottom); Scale bar = 20 μm. (D) BMAL1 immunofluorescence intensity is significantly higher at ZT12 than ZT0 in the corpus callosum (ZT0, n = 7; ZT12, n = 6; **P = 0.0087) and cortex (ZT0, n = 7; ZT12, n = 6; **P = 0.0027). (E) Photomicrograph (63X) of PDGFRα+ OPCs (green) expressing BMAL1 (red) with DAPI (blue) in immunopan-isolated OPCs from P6 mice; Scale bar = 20 μm. (F) Luciferase activity in isolated OPCs from P6 PER2::LUCIFERASE mice that express a fusion protein of PER2 and LUCIFERASE. Treating OPCs with 100 mM dexamethasone for 1 hr synchronizes the circadian molecular clocks of OPCs in vitro (n = 5–6; P<0.0001 One-way ANOVA for CT, P<0.0001 JTK Cycle). (G) The conditional Bmal1 knock out model Bmal1fl/fl, in which the eighth exon coding for the basic helix-loop-helix DNA-binding domain is surrounded by loxP sites, was bred to the OPC-specific Cre driver mouse model NG2::Cre to create a Bmal1 transcriptional hypomorph mouse model in which only the DNA-binding domain of BMAL1 is eliminated specifically in OPCs (NG2::Cre+;Bmal1fl/fl or OPC-Bmal1-KO), thus creating a functional knock out model. (H) Bmal1 (OPC-Bmal1-WT, n = 3; OPC-Bmal1-KO, n = 4; **P = 0.0013 Two-way ANOVA genotype; **P = 0.0026 CT12), Per2 (n = 4; **P = 0.0011 Two-way ANOVA genotype; *P = 0.0493 CT16), and Rev-Erbα expression (n = 4; **P = 0.0062 Two-way ANOVA genotype; *P = 0.0139 CT24) measured by RT-qPCR relative to Gapdh across 24 hr circadian time (CT) in OPCs with (OPC-Bmal1-WT) or without (OPC-Bmal1-KO) functional Bmal1. Data shown as mean +/− S.E.M. n.s. P >0.05.
Figure 2.
Figure 2.. Functional knock out of Bmal1 in OPCs during embryonic development affects oligodendroglial lineage dynamics.
(A) Schematic of the brain regions assessed in P21 mice, showing the corpus callosum (pink), the cortex (purple), and locus coeruleus (teal). (B) Photomicrograph (63X) of PDGFRα+ (green) OPC with EdU (red). Scale bar = 10 μm. (C) The functional loss of Bmal1 from OPCs results in a 48% decrease in OPC proliferation assessed by EdU+/PDGFRα+ co-labelling in the corpus callosum (OPC-Bmal1-WT, n = 6; OPC-Bmal1-KO, n = 4; *P = 0.0252) but not in cortex or locus coeruleus. (D) Photomicrographs (20X; inset 63X) of PDGFRα+ (green) OPCs in the corpus callosum of OPC-Bmal1-WT (left) and OPC-Bmal1-KO (right) mice. Scale bar = 50 μm. (E) OPC-Bmal1-KO mice exhibit a significant decrease in PDGFRα+ OPC density compared to OPC-Bmal1-WT OPCs in the corpus callosum (OPC-Bmal1-WT, n = 6; OPC-Bmal1-KO, n = 4; **P = 0.0061), cortex (OPC-Bmal1-WT, n = 4; OPC-Bmal1-KO, n = 3; *P = 0.0332) and locus coeruleus (OPC-Bmal1-WT, n = 4; OPC-Bmal1-KO, n = 5; **P = 0.01). (F) Representative tracings of OPC morphological complexity using Imaris in OPC-Bmal1-WT (left) and OPC-Bmal1-KO (right). Scale bar = 5 μm. (G) Morphological complexity (ratio of branch points and filament length by filament volume) of OPCs in the corpus callosum (OPC-Bmal1-WT, n = 5; OPC-Bmal1-KO, n = 4; *P = 0.0232), cortex (OPC-Bmal1-WT, n = 5; OPC-Bmal1-KO, n = 4; **P = 0.01), and locus coeruleus (OPC-Bmal1-WT, n = 4; OPC-Bmal1-KO, n = 5; *P = 0.0148). (H-K) OPC establishment from the subventricular germinal zone (SVZ) during development is reduced in NG2::Cre+;Bmal1fl/fl (OPC-Bmal1-KO) mice. (H) Schematic of the brain region analyzed in P0 mice. (I) Photomicrograph (10X) of PDGFRα+ (green) OPCs at P0 showing a representative image of OPC densities analyzed across 5 positions (P1–5) in the cortex. Scale bar = 500 μm. (J-K) PDGFRα+ OPC density is not affected in the SVZ (n = 6; P = 0.4701) (J) but is reduced across the cortex compared to controls (K). (K) OPC densities were determined across the cortex of each mouse (OPC-Bmal1-WT, n = 5; OPC-Bmal1-KO, n = 6; **P = 0.0041 Two-way ANOVA Genotype). (L-N) OPCs isolated from OPC-Bmal1-KO P6 mice exhibit a delay in migration in vitro. (L) Photomicrographs (10X) of OPC-Bmal1-WT (left) and OPC-Bmal1-KO (right) OPCs at time 0 hr (top) and 24 hr (bottom) of the wound. (M) Relative wound closure was determined by measuring the area covered by OPCs at time 0 and after 24 hr (OPC-Bmal1-WT, n = 3; OPC-Bmal1-KO, n = 5; ***P = 0.0005). (N) Relative migration through 8μm-pore Boyden chambers after 24 hr incubation determined through crystal violet staining (OPC-Bmal1-WT, n = 13; OPC-Bmal1-KO, n = 15 over 3 independent experiments; *P = 0.0104). Data shown as mean +/− S.E.M. n.s. P >0.05.
Figure 3.
Figure 3.. BMAL1 regulates the expression of genes that contribute to the homeostatic dynamics of OPCs.
Bulk RNA sequencing was performed in immuno-pan isolated OPCs from P6–7 OPC-Bmal1-WT and OPC-Bmal1-KO mice at 6-h intervals for 24 h (OPC-Bmal1-WT: ZT0 n = 4, ZT6 n = 5, ZT12 n = 6, ZT18 n = 4; OPC-Bmal1-KO: ZT0 n = 4, ZT6 n = 7, ZT12 n = 4, ZT18 n = 4). (A-E) Genes identified to be specifically rhythmic in BMAL1-intact OPCs are enriched in modulators of cell cycle, apoptosis, oligodendrocyte differentiation, gliogenesis, and microtubule binding. (A) Gene Ontology (GO) pathways enriched in differentially expressed genes in BMAL1-intact OPCs between ZT0 and ZT12. (B-C) Volcano plot showing differential gene expression in RNA-seq from OPC-Bmal1-WT at ZT0 compared to ZT12 (B) and inset (C). Genes with adjusted p value < 0.05 and log2 fold change > 1 are shown in dark blue, and genes with adjusted p value < 0.05 and log2 fold change < 1 are shown in light blue. (D) JTK Cycle analysis using FPKMs as inputs shows that the rhythmicity of gene expression in OPCs from OPC-Bmal1-WT mice (left) changes in OPCs that lack a functional BMAL1 (right). The heatmap represents all normalized counts combined per genotype and ZT and clustered by time of peak expression in OPC-Bmal1-WT OPCs. (E) Heatmaps of genes clustered based on gene expression differences between OPC-Bmal1-WT and OPC-Bmal1-KO OPCs at ZT12, organized by top GO terms. (F-G) Volcano plot showing that OPCs from OPC-Bmal1-KO mice have a downregulation of 860 genes compared to OPCs from OPC-Bmal1-WT mice at ZT12 (F), inset (G), and corresponding table showing the Log2FoldChange and p adjusted values of the genes marked in the volcano plot (H).
Figure 4.
Figure 4.. BMAL1 functional knock out in OPCs dysregulates oligodendrocytes, myelination, motor, and cognitive function.
(A) Photomicrographs (20X) of CC1+ (red) oligodendrocytes with DAPI (blue) in the corpus callosum at P21. Scale bar = 30 μm. (B) OPC-Bmal1-KO have decreased CC1+ oligodendrocyte density in the corpus callosum (n = 3; **P = 0.0067), cortex (OPC-Bmal1-WT, n = 4; OPC-Bmal1-KO, n = 3; *P = 0.0493) and locus coeruleus (n = 4; *P = 0.0193) at P21 compared to OPC-Bmal1-WT mice. (C) Representative TEM images of the corpus callosum at the level of the cingulum in OPC-Bmal1-WT (left) and OPC-Bmal1-KO (right) mice at P21. Scale bar = 2 μm. (D) g-ratio of axons in the corpus callosum of OPC-Bmal1-WT and OPC-Bmal1-KO mice at P21 (larger g-ratio = thinner myelin) (OPC-Bmal1-WT, n = 4; OPC-Bmal1-KO, n = 5; **P = 0.0033) and (E) g-ratio by axon caliber (OPC-Bmal1-WT, n = 4; OPC-Bmal1-KO, n = 5; <0.5μm **P = 0.0034; 0.5–1μm *P = 0.0123; >1μm; P = 0.0874). (F) Scatterplot of g-ratios as a function of axon caliber of all axons measured. Each point represents a single axon (100 axons per mouse; OPC-Bmal1-WT, n = 4; OPC-Bmal1-KO, n = 5; *P = 0.011). (G) OPC-Bmal1-KO exhibit deficits in swing speed of limbs and shorter stride length at P35 assessed using the CatWalk gait analysis system compared to OPC-Bmal1-WT mice (OPC-Bmal1-WT, n = 9; OPC-Bmal1-KO, n = 6; speed: ***P = 0.0003; length: ****P <0.0001). (H) OPC-Bmal1-KO mice exhibit attention and short-term memory deficits at 7 months assessed using a modified novel object recognition test (NORT) in which the interval between training and testing is shortened to 5 minutes. OPC-Bmal1-KO mice do not discriminate between the novel and familiar objects whereas OPC-Bmal1-WT spend more time investigating the novel over familiar object OPC-Bmal1-WT, n = 4; OPC-Bmal1-KO, n = 7; P = 0.0244 for Two-way ANOVA interaction, *P = 0.0489 for OPC-Bmal1-WT, P = 0.4155 for OPC-Bmal1-KO). Data shown as mean +/− S.E.M. n.s. P >0.05.
Figure 5.
Figure 5.. Functional loss of Bmal1 specifically in OPCs is associated with abnormal sleep architecture in mice.
(A) At 2 months of age, OPC-Bmal1-WT and OPC-Bmal1-KO mice were subjected to abdominal surgery to implant electronic transmitters. Locomotor activity was telemetrically monitored in light/dark (LD) cycles for 7 days followed by constant darkness (DD) for 15 days. EMG/EEG biotelemetry electrodes were then implanted at 3.5 months and baseline (BL) sleep was recorded at 5 months for 10 days. Mice were then subjected to a 6-hr sleep deprivation (SD) cycle and sleep waves were recorded for 12 hrs post sleep deprivation (PSD). (B-D) While OPC-Bmal1-WT and OPC-Bmal1-KO mice spend the same total amount of time awake and asleep during both the light/sleep and dark/active phase at baseline (n = 6) (B left), OPC-Bmal1-KO mice have shorter (OPC-Bmal1-WT, n = 5; OPC-Bmal1-KO, n = 6; **P = 0.0046) (C left), more frequent wake bouts (n = 6; *P = 0.0434) (D left) during the dark phase than OPC-Bmal1-WT mice, indicative of sleep fragmentation. Post-sleep deprivation (PSD), OPC-Bmal1-KO mice exhibit a significant decrease in the amount of wake during their dark/active phase compared to OPC-Bmal1-WT mice (B right; OPC-Bmal1-WT, n = 5; OPC-Bmal1-KO, n = 6; *P = 0.0199). This increased active-phase sleep following sleep deprivation exhibits the same pattern of sleep fragmentation as detected during baseline as they have shorter (C right; OPC-Bmal1-WT, n = 4; OPC-Bmal1-KO, n = 6; ****P <0.0001) but more frequent wake bouts (D right; OPC-Bmal1-WT, n = 5; OPC-Bmal1-KO, n = 6; **P=0.0043). (E-G) The shift in sleep architecture at BL is driven by changes in NREM sleep, as total amount of NREM does not differ between the genotypes (n = 6; P = 0.631) (E left), but OPC-Bmal1-KO mice exhibit the same trend of shorter (n = 6; **P=0.0076) (F left) but more frequent (n = 6; **P=0.0083) (G left) NREM events during the dark/active phase. Post-sleep deprivation, OPC-Bmal1-KO spend more time in NREM sleep compared to OPC-Bmal1-WT mice (OPC-Bmal1-WT, n = 5; OPC-Bmal1-KO, n = 6; *P=0.0314) (E right), which is driven by shorter (OPC-Bmal1-WT, n = 5; OPC-Bmal1-KO, n = 6; *P=0.0191) (F right), more frequent (OPC-Bmal1-WT, n = 5; OPC-Bmal1-KO, n = 6; **P=0.0016) (G right) bouts. (H) Representative hypnograms showing wake (W), REM (R) and NREM (NR) sleep events during the dark phase (21:00 hr – 9:00 hr) at BL in OPC-Bmal1-WT (top) and OPC-Bmal1-KO (bottom) mice. Data shown as mean +/− S.E.M. n.s. P>0.05.
Figure 6.
Figure 6.. Impaired remyelination potential is associated with sleep fragmentation in both mice and humans.
(A) Tamoxifen-induced functional knock out of Bmal1 in OPCs (PDGFRα::CreERT+;Bmal1fl/fl or OPC-Bmal1-iKO) at 3 months of age leads to decreased complexity in OPC morphology (OPC-Bmal1-WT, n = 5, OPC-Bmal1-iKO, n = 6, ***P = 0.0003) without disrupting OPC density (OPC-Bmal1-WT, n = 5, OPC-Bmal1-iKO, n = 6, P = 0.0787). (B-C) Six weeks after tamoxifen-induced Cre recombination, OPC-Bmal1-iKO and their control littermates (PDGFRα::CreERT2−;Bmal1fl/fl or OPC-Bmal1-WT) were injected with lysolecithin into the cingulum of the corpus callosum of one hemisphere and brains were collected after 5, 9 or 20 days post-injection (dpi). Cellular densities were compared to the contralateral non-lesioned hemisphere. (C) Photomicrograph (10X) of MBP (green) showing the demyelinating lesion in the cingulum of the corpus callosum. Scale bar = 500 μm. (D) Photomicrographs (20X) of PDGFRα+ (green) OPCs in the corpus callosum at 5 dpi. Scale bar = 50 μm. (E) 5 days after demyelination, OPC density in the lesion compared to the contralateral non-lesioned hemisphere is decreased in OPC-Bmal1-iKO compared to OPC-Bmal1-WT mice (n = 5; *P = 0.0335), which is unrelated to OPC proliferation (OPC-Bmal1-WT, n = 5; OPC-Bmal1-iKO, n = 4; P = 0.4037). (F) Photomicrographs (20X) of CC1+ (red) oligodendrocytes in the corpus callosum at 9 dpi. Scale bar = 50μm. (G) 9 days after lysolecithin-induced demyelination, oligodendrocyte density in the lesion is significantly lower in OPC-Bmal1-iKO compared to OPC-Bmal1-WT mice (n = 3; *P = 0.0322), with no differences in OPC density (n = 5, P = 0.6125). (H) Representative TEM images of the corpus callosum in OPC-Bmal1-WT (left) and OPC-Bmal1-iKO (right) mice at 20 dpi. Scale bar = 1 μm. (I) At 20 dpi, myelin sheath thickness is decreased in small caliber axons of OPC-Bmal1-iKO compared to OPC-Bmal1-WT mice (n = 5; *P = 0.0118). Data shown as mean +/−SEM. n.s. P>0.05. (J) Scatterplot of the mendelian randomization (MR) analysis of association between sleep fragmentation and multiple sclerosis (MS). MR analyses were performed on lead variants identified in a GWAS of sleep fragmentation (defined as number of sleep episodes) in 85,723 UK Biobank individuals. By using genetic proxies for the exposure (sleep fragmentation) and assessing how they influence the outcome (risk of MS), we estimate the true effect of the exposure on the outcome and not the effect that comes from the genetics only. The y-axis represents the effect of the analyzed variants on MS (beta) and the x-axis represents the variants effect on the number of sleep episodes (logOddsRatio) for each of the 11 variants studied. The slopes of the regression lines represent the association tested using Inverse variance weighted (IVW), Weighted median, Weighted mode, Simple mode, and MR Egger statistical tests. (K) Corresponding table of the MR analysis performed indicates causal association between sleep fragmentation and MS risk without pleiotropic effect (MR Egger Intercept P = 0.32). Beta, β coefficient; SE, Standard Error.

References

    1. Hirrlinger J, and Nave K-A (2014). Adapting brain metabolism to myelination and long-range signal transduction. Glia 62, 1749–1761. 10.1002/glia.22737. - DOI - PubMed
    1. Saab AS, Tzvetavona ID, Trevisiol A, Baltan S, Dibaj P, Kusch K, Möbius W, Goetze B, Jahn HM, Huang W, et al. (2016). Oligodendroglial NMDA Receptors Regulate Glucose Import and Axonal Energy Metabolism. Neuron 91, 119–132. 10.1016/j.neuron.2016.05.016. - DOI - PMC - PubMed
    1. Dawson MRL, Polito A, Levine JM, and Reynolds R (2003). NG2-expressing glial progenitor cells: An abundant and widespread population of cycling cells in the adult rat CNS. Mol. Cell. Neurosci 24, 476–488. 10.1016/S1044-7431(03)00210-0. - DOI - PubMed
    1. Matsumoto, Tsunekawa Y, Nomura T, Suto F, Matsumata M, Tsuchiya S, and Osumi N (2011). Differential Proliferation Rhythm of Neural Progenitor and Oligodendrocyte Precursor Cells in the Young Adult Hippocampus. PLoS ONE 6, 27628–27628. 10.1371/journal.pone.0027628. - DOI - PMC - PubMed
    1. Hughes EG, Kang SH, Fukaya M, and Bergles DE (2013). Oligodendrocyte progenitors balance growth with self-repulsion to achieve homeostasis in the adult brain. Nat. Neurosci 16, 668–676. 10.1038/nn.3390. - DOI - PMC - PubMed

Publication types

Substances