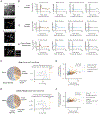
. 2023 Nov 15;111(22):3541-3553.e8.
doi: 10.1016/j.neuron.2023.08.003. Epub 2023 Aug 31.

Overlapping representations of food and social stimuli in mouse VTA dopamine neurons

Affiliations

Overlapping representations of food and social stimuli in mouse VTA dopamine neurons

Lindsay Willmore et al. Neuron. .

Abstract

Dopamine neurons of the ventral tegmental area (VTADA) respond to food and social stimuli and contribute to both forms of motivation. However, it is unclear whether the same or different VTADA neurons encode these different stimuli. To address this question, we performed two-photon calcium imaging in mice presented with food and conspecifics and found statistically significant overlap in the populations responsive to both stimuli. Both hunger and opposite-sex social experience further increased the proportion of neurons that respond to both stimuli, implying that increasing motivation for one stimulus increases overlap. In addition, single-nucleus RNA sequencing revealed significant co-expression of feeding- and social-hormone-related genes in individual VTADA neurons. Taken together, our functional and transcriptional data suggest overlapping VTADA populations underlie food and social motivation.

Keywords: dopamine; hunger; internal state; motivation; snRNA-seq; social; two-photon calcium imaging; ventral tegmental area.


Conflict of interest statement

Declaration of interests The authors declare no competing interests.

Figures
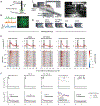
Figure 1.
Figure 1.. VTADA neurons respond to the arrival of a conspecific, with attenuating responses across trials
(A) Schematic of surgical strategy for GRIN lens insertion over the ventral tegmental area (VTA). (B) GCaMP traces from an example field of view. (C) Schematic of social stimulus and food delivery mechanism to head-fixed mice undergoing two-photon calcium imaging (created with BioRender.com). (D) Stimuli presented during imaging. (E) Neural activity to the first trial of each stimulus type in a single baseline imaging session (dotted lines indicate slider movement onset and offset, with arrival at t=0s and departure at t=20s). Neurons plotted in the same order across columns (N=411 neurons, 19 mice). (F) Top: Average activity in the first second after stimulus arrival across all neurons within each trial type (1-sample t-test for activity different from 0, after Bonferroni correction for 50 tests). Bottom: Average activity across neurons recorded from male and female imaged mice (generalized estimating equation (GEE) for average activity by trial, imaged mouse sex, and the interaction between trial and imaged mouse sex, N=199 neurons from males, 212 neurons from females). See Table S1A, S1C for statistics. ∗p < 0.05, ∗∗p < 0.01, ∗∗∗p < 0.001. Unless specified, data plotted as mean ± SEM.
Figure 2.
Figure 2.. Overlap in VTADA populations responsive to food and social stimuli
(A) Example field of view with neurons colored by which stimulus type they are responsive to. (N=16 neurons). (B) Examples of neural activity in the 1s after the first presentation of food or social stimuli from (i) a neuron responsive to food but not social stimuli arrival, (ii) a neuron responsive to male but not food arrival, and (iii) a neuron responsive to both food and male arrival. Slider motor turns on at time −3s and arrives at 0s. (C) Left: Percentage of neurons responsive to food, male, both, or neither. Tuning here and in subsequent panels is based on the mean activity in the first second after arrival (shaded region in B). Right: Overlap compared to null distribution assuming food- and male-responsive neurons are independent samples. (In C-F, N=411 neurons) (D) Same as (C) for estrus female stimulus mice. (E) Correlation between neural activity in response to food and male (left) corrected by empty cage arrival (right), colored by selectivity to food arrival, male arrival, or both. (F) Same as (E) for estrus female stimulus mice. See Table S1A for statistics. ∗p < 0.05, ∗∗p < 0.01, ∗∗∗p < 0.001. Unless specified, data plotted as mean ± SEM.
Figure 3.
Figure 3.. Hunger and, to a lesser extent, opposite-sex experience increase fraction of VTADA neurons responsive to both food and social stimuli
(A) Cartoon representing comparison of imaging under sated or hungry conditions (same animals, separated by 48 hours, counterbalanced order of sated versus hungry day). Mice created with BioRender.com. (B) Example field of view across imaging sessions (sated: N=22 neurons, hungry: N=20 neurons). (C) Lick rates during food presentation (average across 20s trials, N=13 mice). (D) Distribution of change in food response magnitude from sated to hungry sessions (N=137 neurons, those recorded across all recording sessions). (E) Changes in neural tuning from cells tracked between sated and hungry sessions. (N=217 neurons, all those recorded across sated and hungry sessions) (F) Percentage of neurons responsive to food arrival, social (male and estrus female) arrival, or both on sated vs hungry sessions (error bars show standard deviation of binomial distribution, sated: N=427 neurons, hungry: N=394 neurons). (G) Cartoon representing comparison of imaging before and after freely moving opposite sex experience. Mice created with BioRender.com. (H) Example field of view across imaging sessions (before: N=34 neurons, after: N=35 neurons). (I) USV syllable counts while males are presented with female stimuli after versus before opposite sex experience (y-axis log scale, 5 out of 5 males increased in USVs detected during female trials). (J) In neurons that are food-responsive (before or after opposite sex experience), distribution of change in activity in response to opposite-sex arrival (N=95 neurons). (K) Changes in neural tuning before versus after opposite sex interaction (N=227 neurons). (L) In imaged males, percentage of neurons responsive to food arrival, opposite-sex arrival, food and opposite-sex arrival, same-sex arrival, and food and same-sex arrival before versus after freely moving opposite-sex interactions (error bars show standard deviation of binomial distribution, before: N=134 neurons, after: N=139 neurons). See Table S1A for statistics. ∗p < 0.05, ∗∗p < 0.01, ∗∗∗p < 0.001. Unless specified, data plotted as mean ± SEM.
Figure 4.
Figure 4.. Changes in excitability-related genes in VTADA neurons with hunger, and coexpression of feeding- and social-behavior related genes.
(A) Single-nucleus RNA sequencing (snRNA-seq) pipeline. Schematic created with BioRender.com. (B) Volcano plots showing genes significantly differentially expressed in nuclei from sated versus hungry animals across neuronal subtypes (dopamine, left; GABA, middle; glutamate, right; see Table S2A for genes and statistics). (C) Representative calcium traces from three neurons recorded on sated and hungry days (red dots indicate transients). (D) Average transient rate in neurons recorded on sated and hungry days (N=218 neurons). (E) Uniform approximation and projection (UMAP) of Slc6a3- or Th-expressing (dopamine nuclei) neuron subclusters in mouse VTA (N=14,208 nuclei). (F) Expression of the top marker genes for each dopamine neuron subcluster as well as feeding and social hormone-related genes across subclusters. (G) UMAP of VTADA nuclei colored by expression of Insr (see Table S2B for description of gene). (H) UMAP of VTADA nuclei colored by expression of Ar (see Table S2B for description of gene). (I) UMAP of VTADA nuclei colored by whether they express both Insr and Ar. (J) Percentage of VTADA nuclei expressing Insr, Ar, both, or neither (top). True percentage of VTADA nuclei co-expressing Insr and Ar (yellow line) compared to a null distribution assuming the nuclei expressing each are independent samples (bottom). (K) Level of co-expression (compared to chance, assuming the nuclei expressing each gene are independent samples) of each food/social gene pair in VTADA nuclei. Horizontal break separates social-related hormone receptors (top) and enzymes (bottom). Vertical break separates feeding-related hormone receptors (left) and enzymes (right). (L) Percentage of gene pairs coexpressed more than chance (based on comparison to null distribution constructed as described above) across neuron subtypes. See Table S2A–C for statistics and gene lists. ∗p < 0.05, ∗∗p < 0.01, ∗∗∗p < 0.001 unless otherwise specified.

Update of

Similar articles

Cited by

References

    1. Schultz W, Dayan P, and Montague PR (1997). A neural substrate of prediction and reward. Science 275, 1593–1599. - PubMed
    1. Cohen JY, Haesler S, Vong L, Lowell BB, and Uchida N. (2012). Neuron-type-specific signals for reward and punishment in the ventral tegmental area. Nature 482, 85–88. - PMC - PubMed
    1. Fernandes AB, Alves da Silva J, Almeida J, Cui G, Gerfen CR, Costa RM, and Oliveira-Maia AJ (2020). Postingestive Modulation of Food Seeking Depends on Vagus-Mediated Dopamine Neuron Activity. Neuron 106, 778–788.e6. - PMC - PubMed
    1. Grove JCR, Gray LA, La Santa Medina N, Sivakumar N, Ahn JS, Corpuz TV, Berke JD, Kreitzer AC, and Knight ZA (2022). Dopamine subsystems that track internal states. Nature. 10.1038/s41586-022-04954-0. - DOI - PMC - PubMed
    1. Martel P, and Fantino M. (1996). Mesolimbic dopaminergic system activity as a function of food reward: a microdialysis study. Pharmacol. Biochem. Behav. 53, 221–226. - PubMed

Publication types