. 2023 Sep 1;6(11):e202302118.
doi: 10.26508/lsa.202302118. Print 2023 Nov.

LEF1 enhances β-catenin transactivation through IDR-dependent liquid-liquid phase separation

Affiliations

LEF1 enhances β-catenin transactivation through IDR-dependent liquid-liquid phase separation

Bing Zhao et al. Life Sci Alliance. .

Abstract

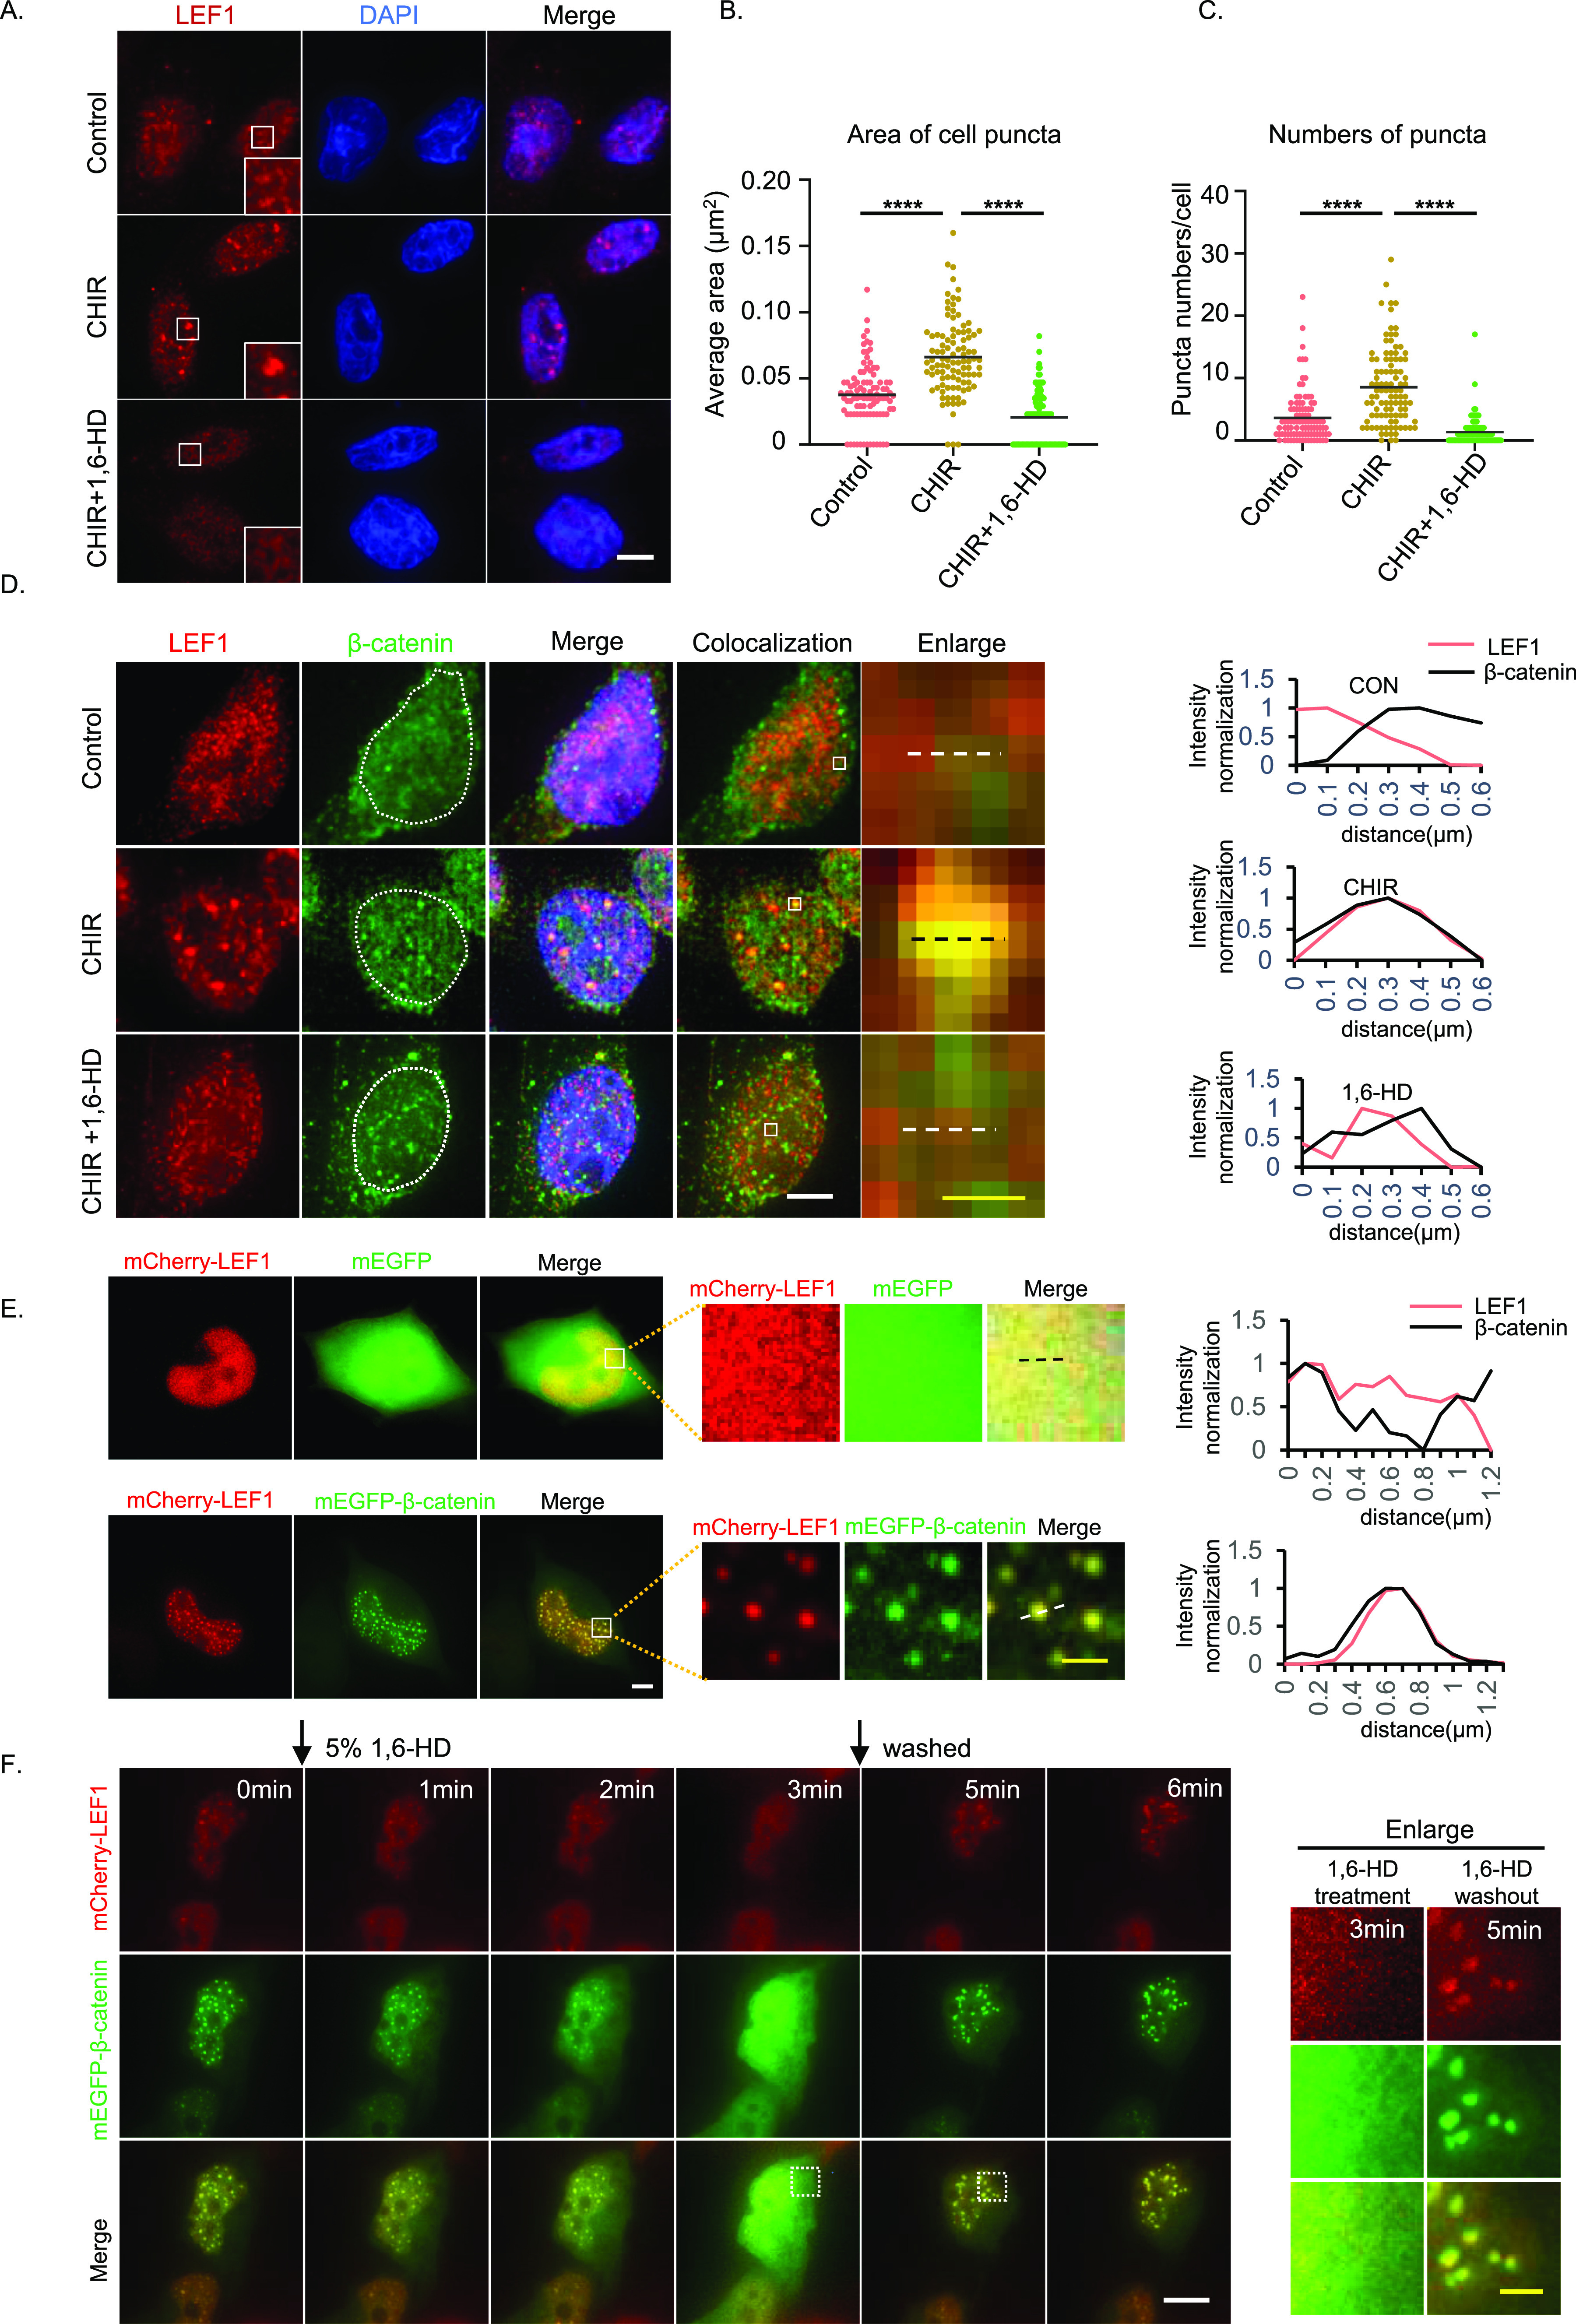
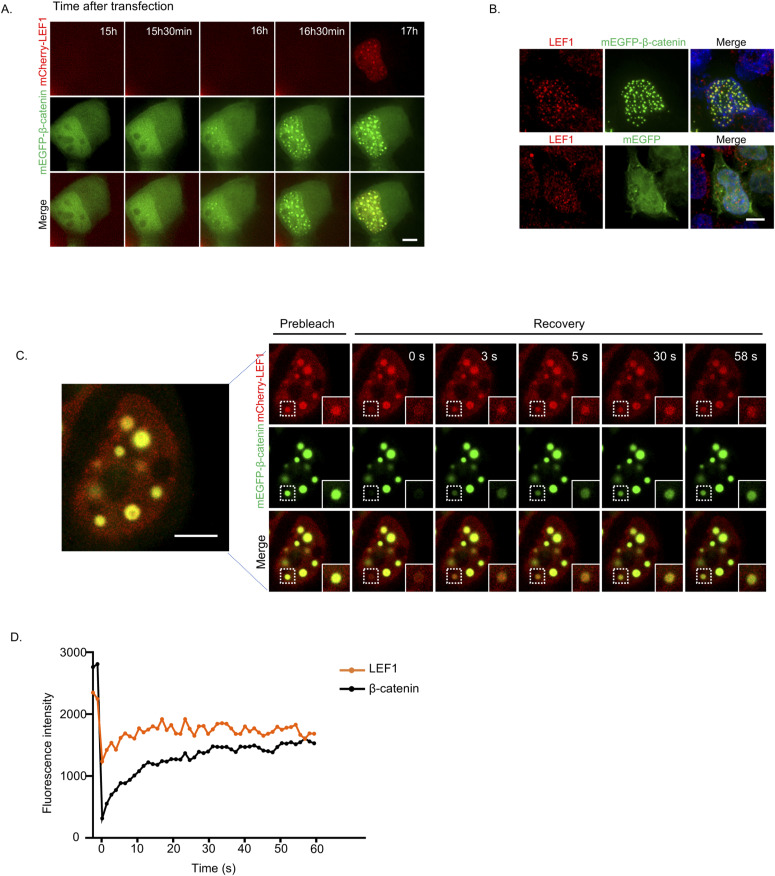
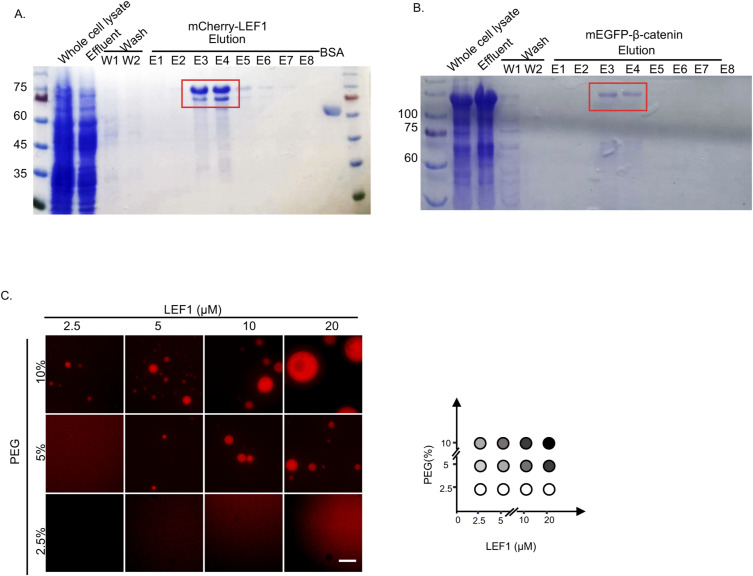
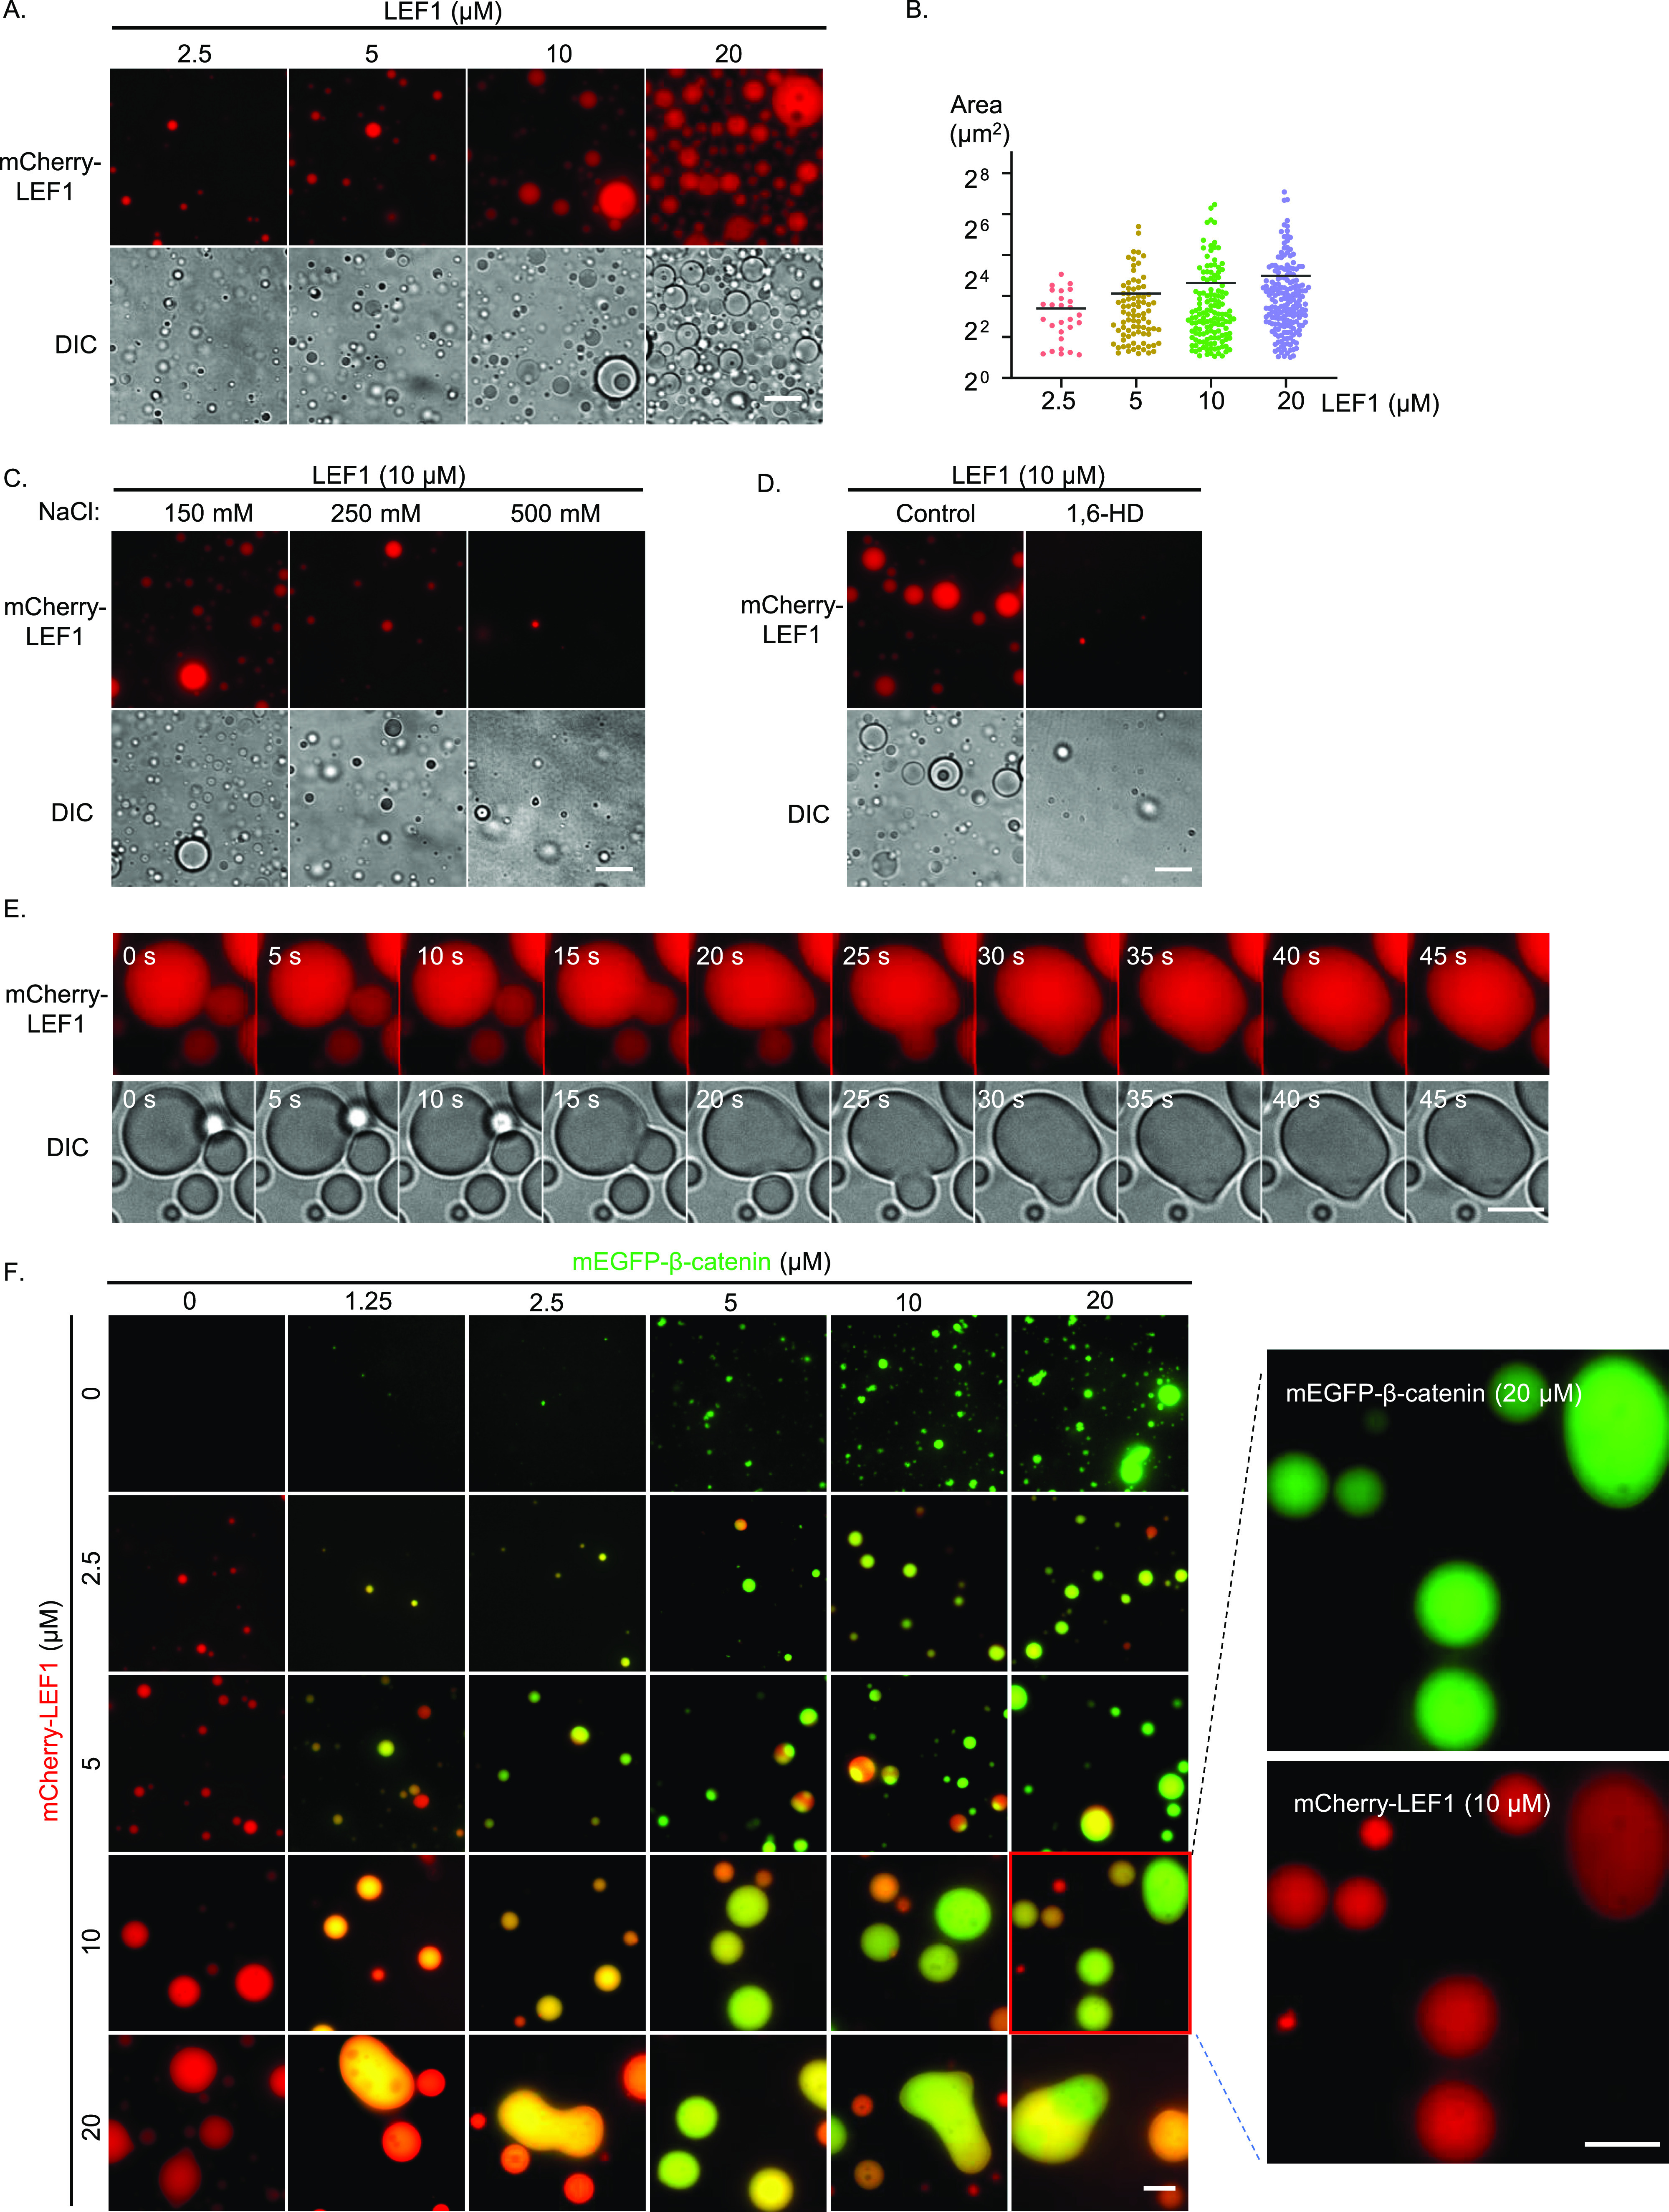
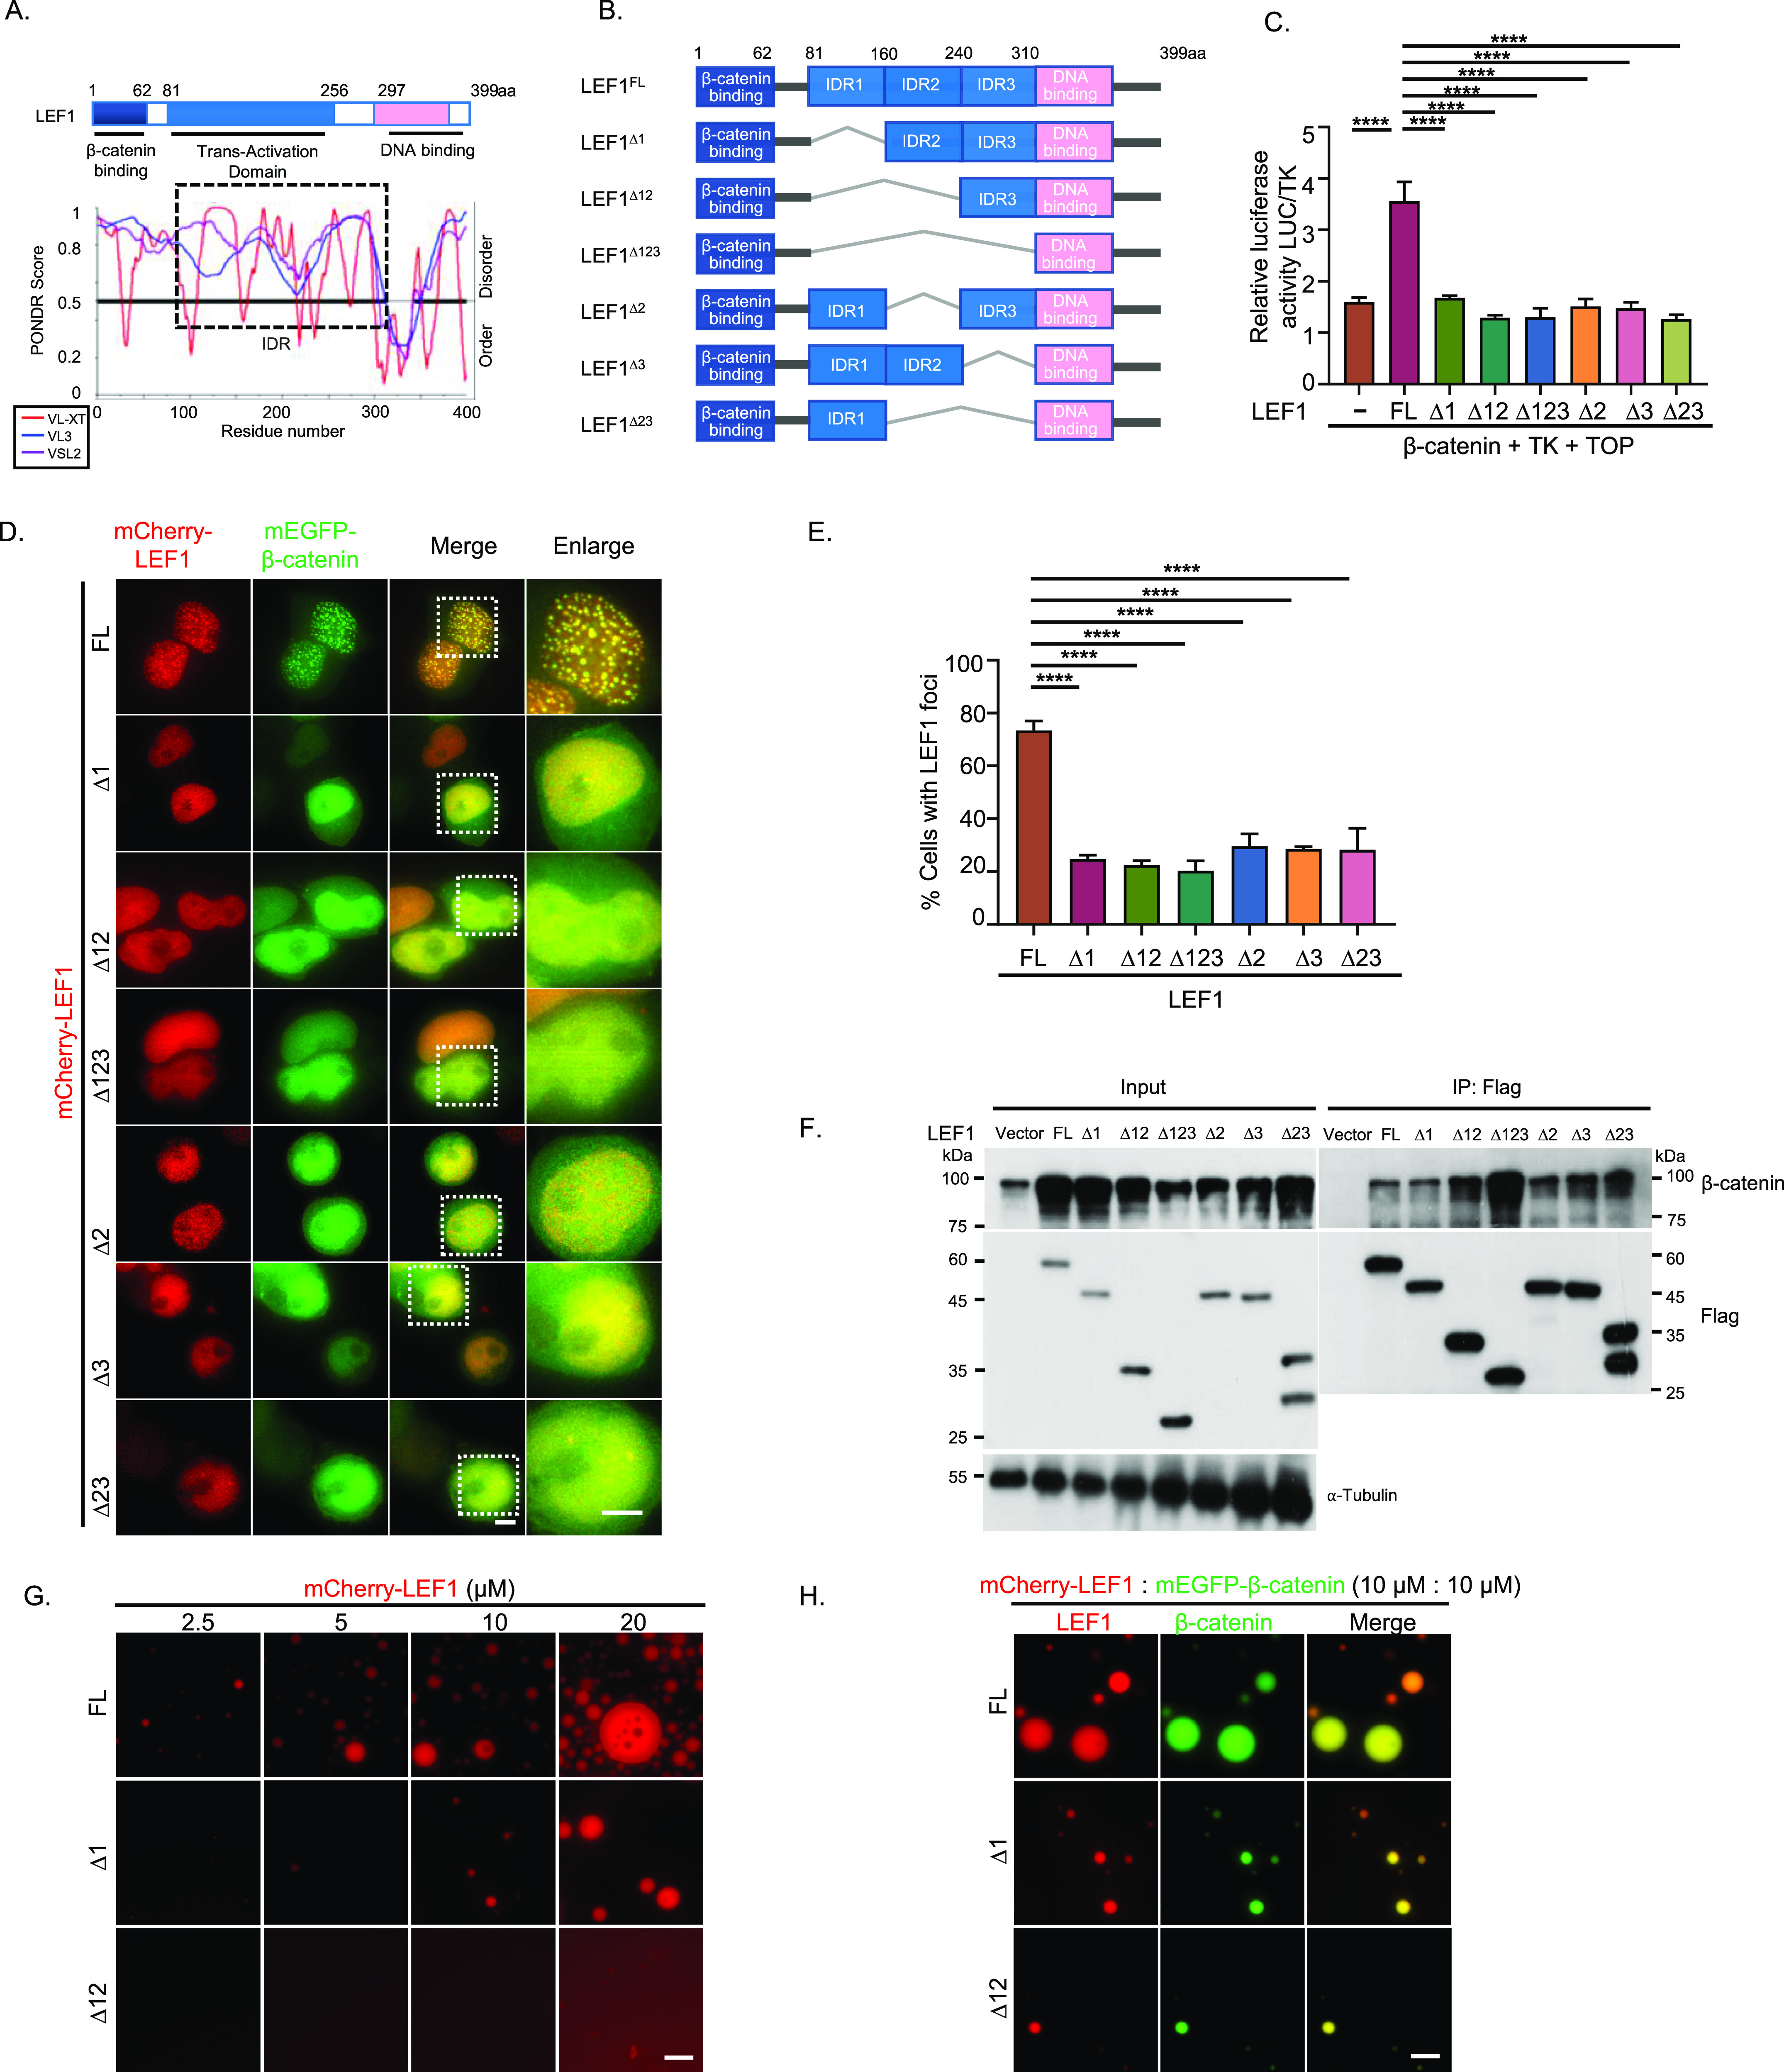
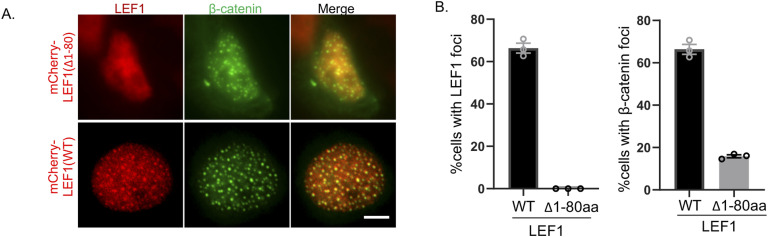
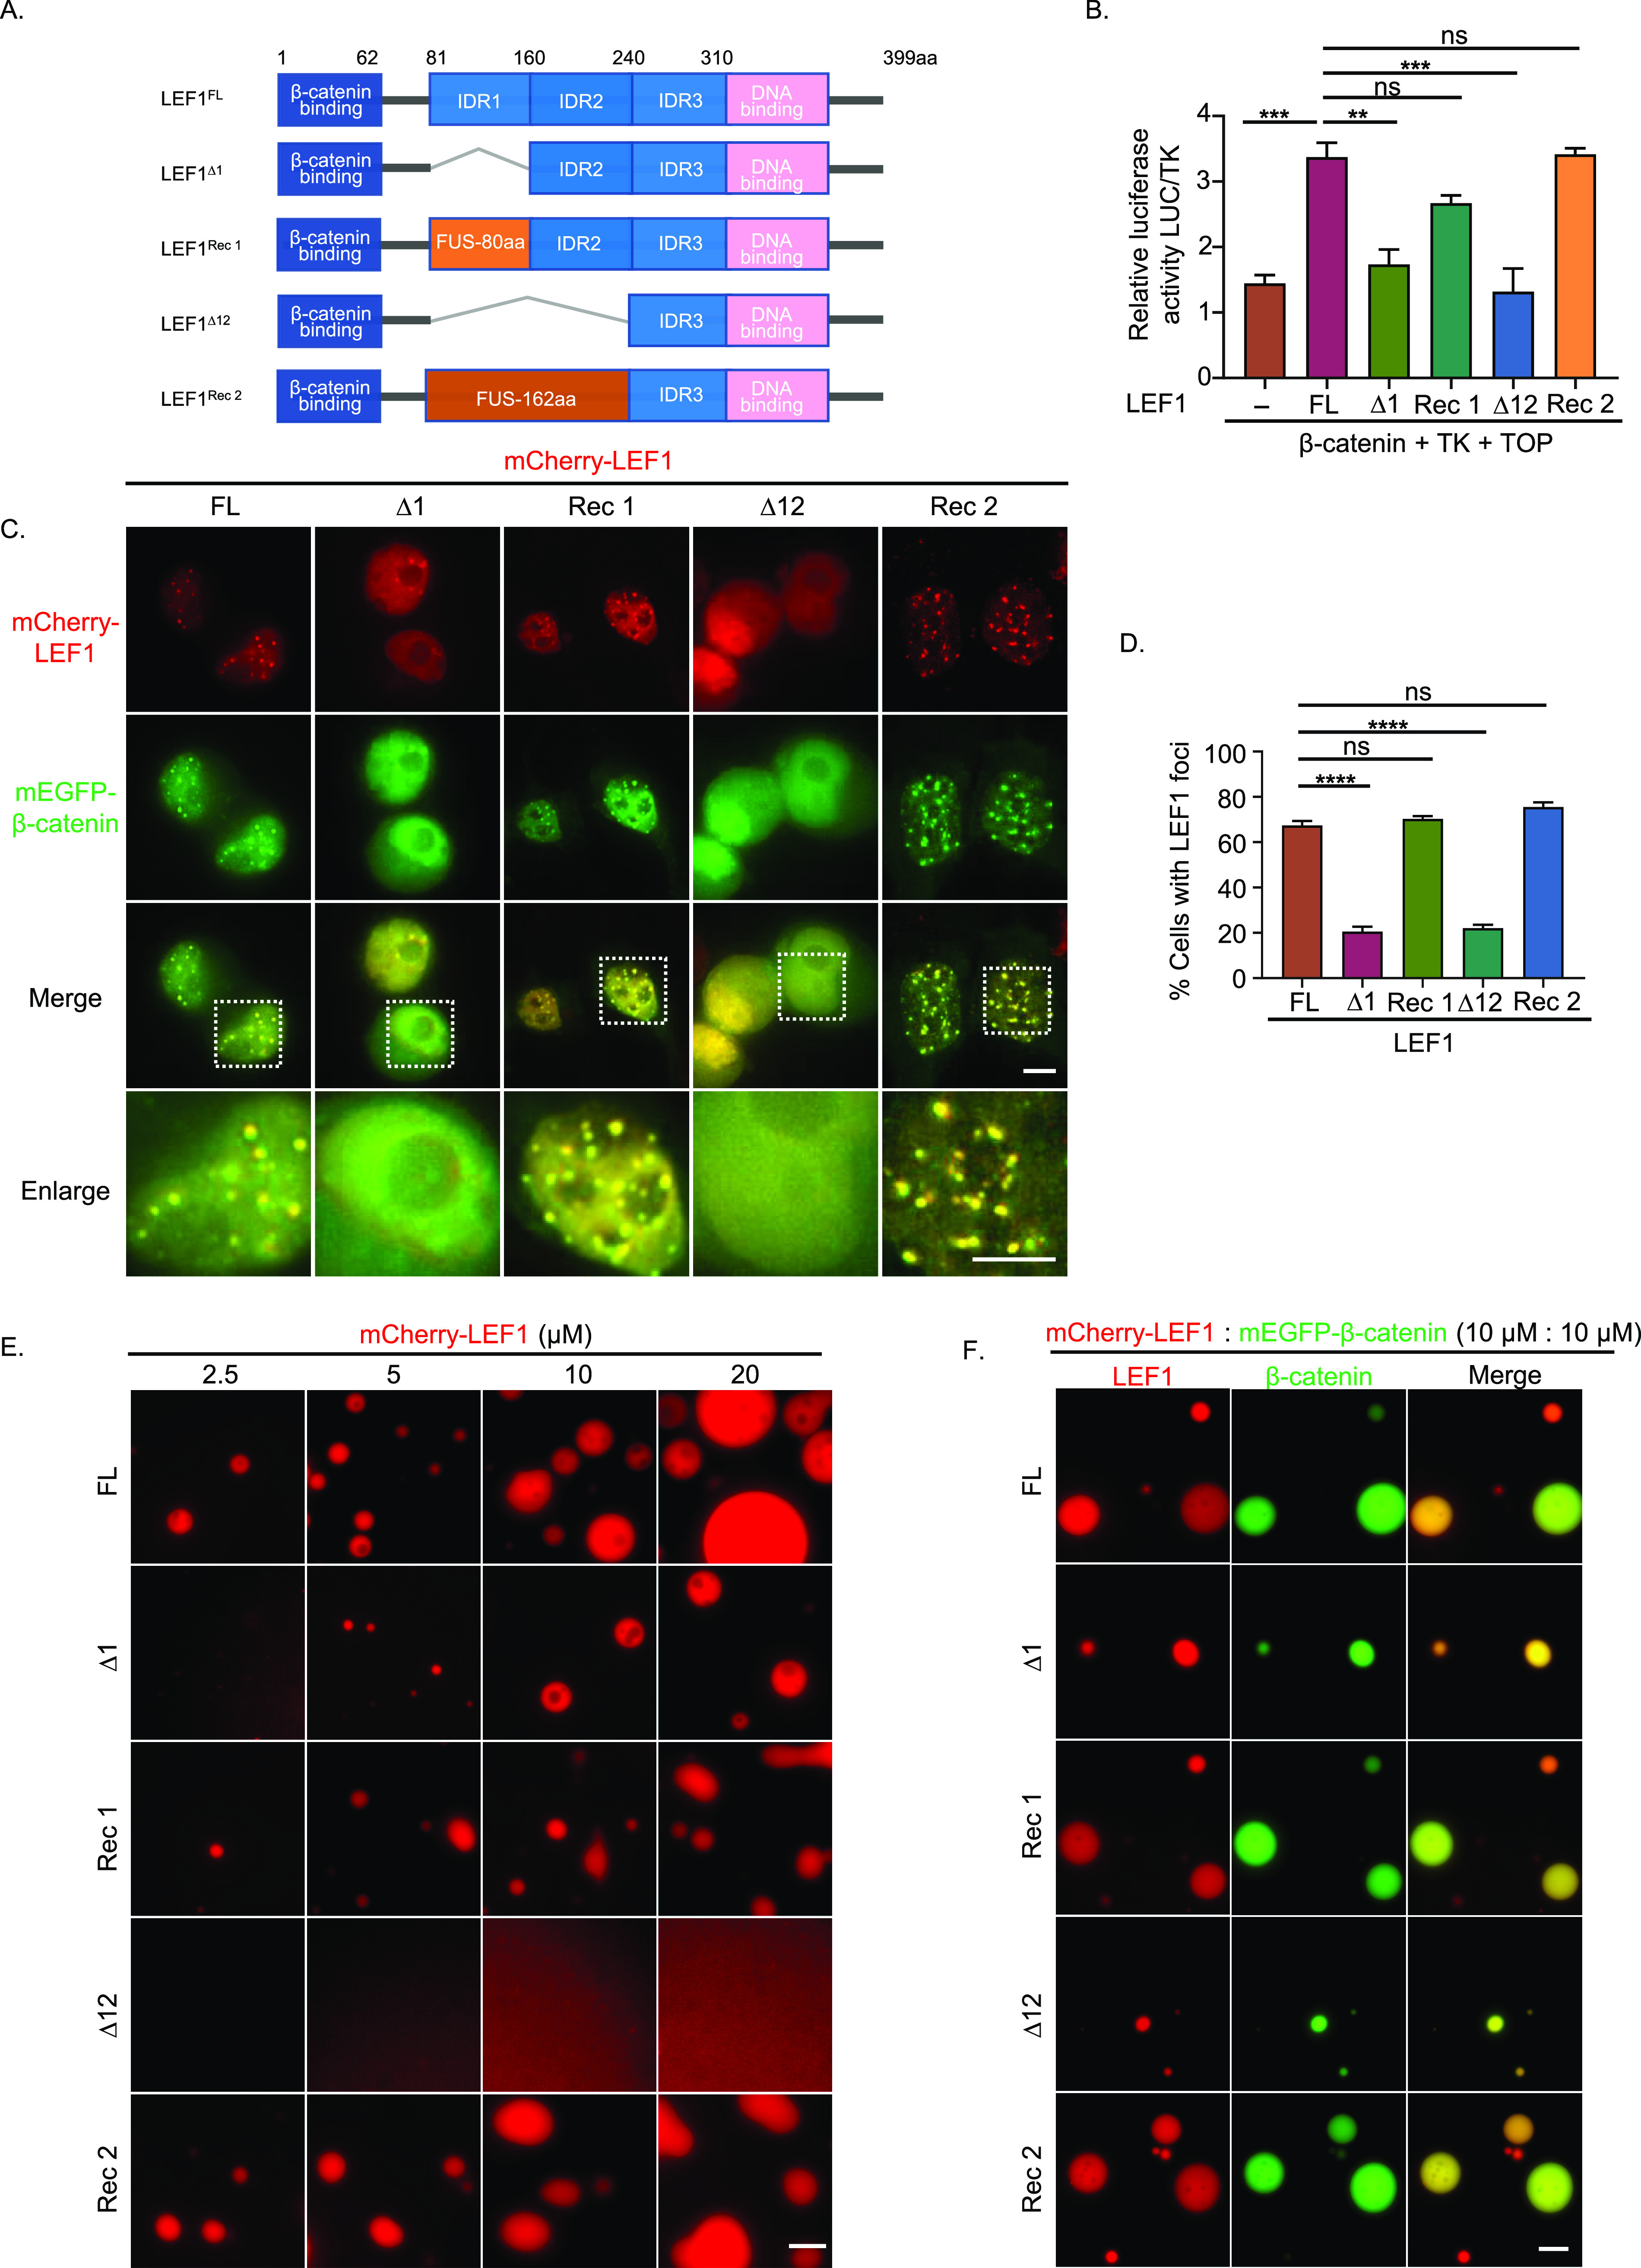
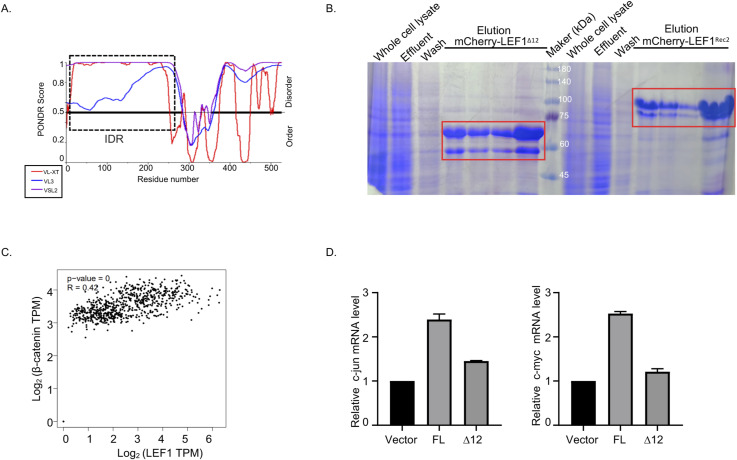
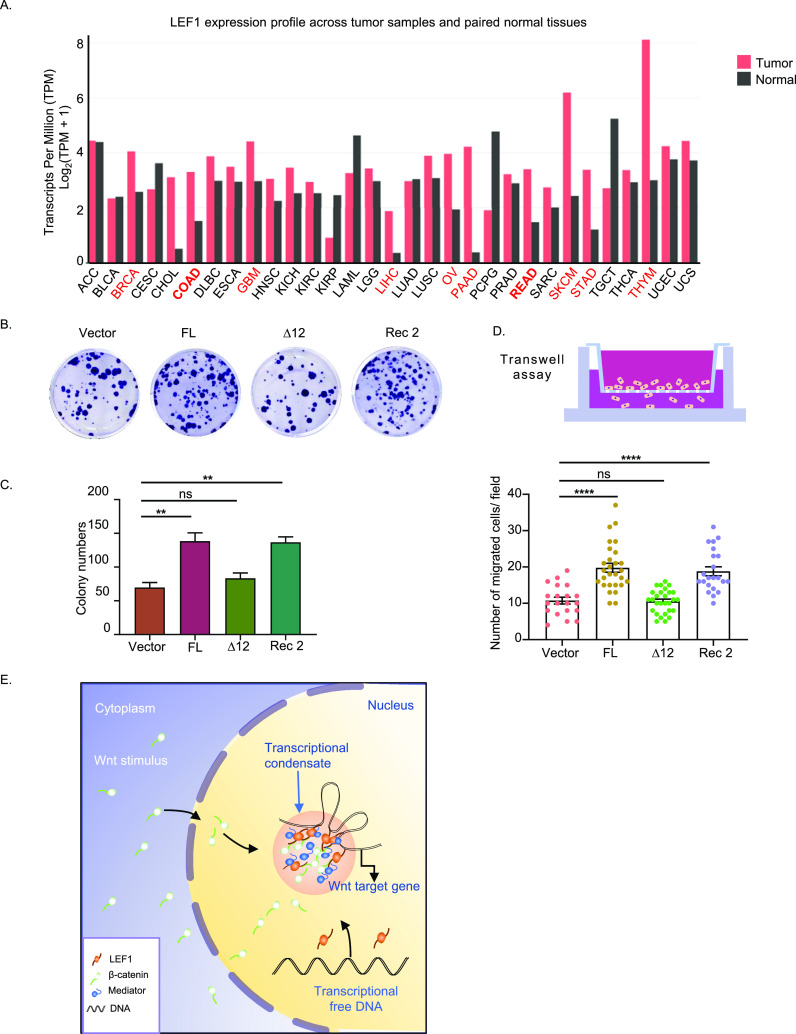
Wnt/β-catenin signaling plays a crucial role in cancer development, primarily activated by β-catenin forming a transcription complex with LEF/TCF in the nucleus and initiating the transcription of Wnt target genes. Here, we report that LEF1, a member of the LEF/TCF family, can form intrinsically disordered region (IDR)-dependent condensates with β-catenin both in vivo and in vitro, which is required for β-catenin-dependent transcription. Notably, LEF1 with disrupted IDR lost its promoting activity on tumor proliferation and metastasis, which can be restored by substituting with FUS IDR. Our findings provide new insight into the essential role of liquid-liquid phase separation in Wnt/β-catenin signaling and present a potential new target for cancer therapy.


Conflict of interest statement

The authors declare that they have no conflict of interest.

Figures

Figure 1.
Figure 1.. LEF1 undergoes phase separation in vivo upon Wnt activation.
(A) Immunofluorescence for LEF1 in SW480 cells when Wnt signaling is activated by CHIR99021 for 24 h. Cells were treated with 5% 1,6-HD for 10 s. Scale bar, 5 μm. (B) Dots show the average area of puncta from individual cells and mean values (black horizontal lines). 100 cells were analyzed in each group (****P < 0.0001, one-way ANOVA). (C) Dots show puncta numbers of SW480 cells after different treatments and mean values (black horizontal lines). 100 cells were analyzed in each group (****P < 0.0001, one-way ANOVA). (D) Left, immunofluorescence for LEF1 and β-catenin when Wnt signaling activated with or without 5% 1,6-HD for 10 s. Scale bar, 5 μm (white horizontal line), 0.5 μm (yellow horizontal line). Right, normalized fluorescence intensity profiles of dotted lines are indicated in the images on the left. (E) Left, cells were transfected with mEGFP–β-catenin and mCherry–LEF1 for 24 h and imaged. Scale bar, 5 μm (white horizontal line), 1 μm (yellow horizontal line). Right, normalized fluorescence intensity profiles of dotted lines are indicated in the images on the left. (F) Time-lapse imaging of cells transfected with mEGFP–β-catenin and mCherry-LEF1 after treatment with 1,6-HD and washout. Scale bar, 5 μm (white horizontal line), 2 μm (yellow horizontal line).
Figure S1.
Figure S1.. Phase separation of LEF1 upon Wnt activation in cell.
(A) Time-lapse of a representative cell showing mEGFP–β-catenin and mCherry–LEF1 after transfection 15 h. Scale bar, 5 μm. (B) Immunofluorescence image of the distribution of endogenous LEF1 after β-catenin overexpression in HEK293T cells. Scale bar, 5 μm. (C) FRAP of mCherry–LEF1 and mEGFP–β-catenin puncta in cell. Scale bar, 5 μm. (D) Quantitative analysis of fluorescence intensity changes in LEF1 and β-catenin before and after fluorescence bleaching was performed in panel Fig S1C.
Figure S2.
Figure S2.. Protein purification and PEG titration of LEF1.
(A) SDS–PAGE results for mCherry–LEF1 protein purification. (B) SDS–PAGE results for mEGFP–β-catenin protein purification. (C) PEG titration of LEF1 in vitro with phase separation. Scale bar, 10 μm.
Figure 2.
Figure 2.. LEF1 undergoes phase separation with β-catenin in vitro.
(A) Representative images of mCherry–LEF1 droplet formation with indicated concentrations (RT, 150 mM NaCl, pH 7.5, 10% PEG-6000). Scale bar, 10 μm. (B) Measurement of the area and number of droplets formed in Fig 2A. (C) Droplet formation of mCherry–LEF1 was analyzed with different concentrations of NaCl. Scale bar, 10 μm. (D) Droplet formation of mCherry–LEF1 was analyzed with or without 5% 1,6-HD. Scale bar, 10 μm. (E) Selected frames from time-lapse movies of representative LEF1 droplets fusion. Scale bar 2 μm. (F) Representative images of mEGFP–β-catenin and mCherry–LEF1 mixture with the indicated module concentration. Scale bar 10 μm.
Figure 3.
Figure 3.. LEF1 LLPS and Wnt target gene activation are dependent on IDR.
(A) Domain structure and the intrinsically disordered tendency of LEF1 predicted by PONDR. PONDR assigned scores of disordered tendencies between 0 and 1 to the sequences (scores >0.5 indicates disordered). (B) Schematic of LEF1(FL) and truncated LEF1 with IDR depleted (∆1, ∆12, ∆123, ∆2, ∆3, ∆23). (C) Activation of β-catenin with different LEF1 mutants that were detected by luciferase reporter gene assay. Error bars show the mean ± SEM from three individual experiments (****P < 0.0001, one-way ANOVA). (D) Representative confocal microscopy images of HEK293T cells transfected with mEGFP–β-catenin and mCherry–LEF1 or LEF1 mutants. Scale bar, 5 μm. (E) A quantification of the percentage of cells that showed nuclear LEF1 puncta. Error bars show mean ± SEM from three individual experiments. (****P < 0.0001, one-way ANOVA). (F) Immunoprecipitation and Western blot analysis of FLAG-tagged LEF1 variants co-expressed with β-catenin in HEK293T cells. (G) mCherry–LEF1(FL), ∆1, ∆12 proteins were analyzed using droplet-formation assays with the indicated module concentration. Scale bar, 10 μm. (H) Representative images of mEGFP–β-catenin (10 μm) and mCherry–LEF1 (FL), ∆1 or ∆12 (10 μm) proteins mixture in phase-separation buffer. Scale bar, 10 μm.
Figure S3.
Figure S3.. The localization of LEF1 mutant lacking β-catenin binding domain.
(A) Images of overexpressed β-catenin and LEF1 mutant localization in HEK293T cells. Scale bar, 5 μm. (B) Quantification of the proportion of cells exhibiting nuclear LEF1 puncta (left) and β-catenin puncta (right).
Figure 4.
Figure 4.. IDR-dependent phase separation of LEF1 is indispensable for its transcriptional activation.
(A) Schematic of full-length LEF1 (FL), truncated LEF1 with IDR-depleted (∆1, ∆12), and IDR substitution (Rec1: ∆1+fus80, Rec2: ∆12+fus162). (B) Activation of β-catenin with different LEF1 mutants that were detected by luciferase reporter gene assay. Error bars show the mean ± SEM from three individual experiments (***P < 0.001, **P < 0.01, *P < 0.05, one-way ANOVA). (C) Co-expression of mEGFP–β-catenin and mCherry–LEF1 WT or mutant in HEK293T cells. Scale bar, 5 μm. (D) A quantification of the percentage of cells that showed nuclear LEF1 puncta. Data are mean ± SEM from three individual experiments. (****P < 0.0001, one-way ANOVA). (E) Comparison of droplet formation ability about mCherry–LEF1(FL) and mutants (∆1, ∆12, Rec 1, Rec 2) with the indicated module concentration. Scale bar, 10 μm. (F) Droplet formation ability for mEGFP–β-catenin with mCherry–LEF1 (FL) or with mutants mixed at a concentration of 10 μm. Scale bar, 10 μm.
Figure S4.
Figure S4.. LEF1 variants purification and Wnt target genes mRNA levels detection.
(A) Intrinsically disordered tendency of FUS predicted by PONDR. (B) SDS–PAGE results for mCherry–LEF1 variants’ protein purification. (C) Correlation analysis of LEF1 and β-catenin in colorectal cancer patients. Data from TCGA and GTEx were analyzed by the Pearson correlation coefficient. (D) Alterations in the mRNA levels of Wnt target genes in HCT116 cells after transfection with LEF1(FL) and LEF1 mutants (∆12).
Figure 5.
Figure 5.. LEF1 phase separation promotes tumor growth and metastasis.
(A) Differences in LEF1 expression in tumor and normal tissues. The height of the bar represents the median expression of indicated tumor and normal tissues. The red font represents the top 10 greatest differences in the expression of LEF1 in tumor and normal tissues. (B) Representative image for colony formation of HCT116 cells after stably transfected LEF1 and its mutants, respectively. (C) Colony counts of each kind of HCT116 cells stably express LEF1 or its mutants. Error bars show the mean ± SEM from three individual experiments. (D) The statistical analysis of transwell assays of the migration in HCT116 cells. (****P < 0.0001, one-way ANOVA). (E) Model of LEF1 enhances β-catenin transactivation through IDR-dependent liquid–liquid phase separation.

Similar articles

Cited by

References

    1. Ahn JH, Davis ES, Daugird TA, Zhao S, Quiroga IY, Uryu H, Li J, Storey AJ, Tsai YH, Keeley DP, et al. (2021) Phase separation drives aberrant chromatin looping and cancer development. Nature 595: 591–595. 10.1038/s41586-021-03662-5 - DOI - PMC - PubMed
    1. Alberti S, Carra S (2018) Quality control of membraneless organelles. J Mol Biol 430: 4711–4729. 10.1016/j.jmb.2018.05.013 - DOI - PubMed
    1. Alberti S, Saha S, Woodruff JB, Franzmann TM, Wang J, Hyman AA (2018) A user's guide for phase separation assays with purified proteins. J Mol Biol 430: 4806–4820. 10.1016/j.jmb.2018.06.038 - DOI - PMC - PubMed
    1. Anthony CC, Robbins DJ, Ahmed Y, Lee E (2020) Nuclear regulation of Wnt/β-catenin signaling: It's a complex situation. Genes (Basel) 11: 886. 10.3390/genes11080886 - DOI - PMC - PubMed
    1. Aulicino F, Pedone E, Sottile F, Lluis F, Marucci L, Cosma MP (2020) Canonical Wnt pathway controls mESC self-renewal through inhibition of spontaneous differentiation via beta-catenin/TCF/LEF functions. Stem Cell Rep 15: 646–661. 10.1016/j.stemcr.2020.07.019 - DOI - PMC - PubMed

Publication types

MeSH terms

LinkOut - more resources