

Exploring the Role of Plasma Lipids and Statin Interventions on Multiple Sclerosis Risk and Severity: A Mendelian Randomization Study
- PMID: 37657941
- PMCID: PMC10624499
- DOI: 10.1212/WNL.0000000000207777
Exploring the Role of Plasma Lipids and Statin Interventions on Multiple Sclerosis Risk and Severity: A Mendelian Randomization Study
Abstract
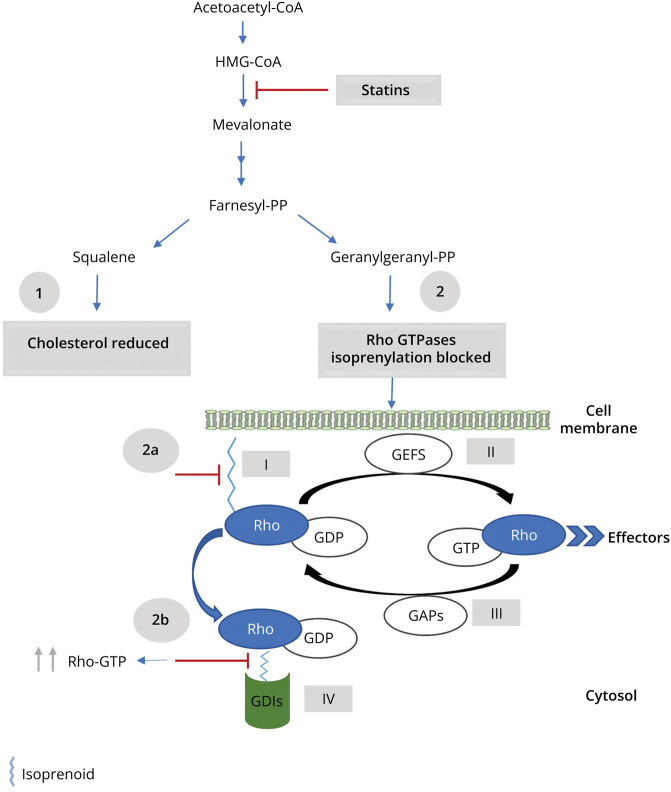
Background and objectives: There has been considerable interest in statins because of their pleiotropic effects beyond their lipid-lowering properties. Many of these pleiotropic effects are predominantly ascribed to Rho small guanosine triphosphatases (Rho GTPases) proteins. We aimed to genetically investigate the role of lipids and statin interventions on multiple sclerosis (MS) risk and severity.
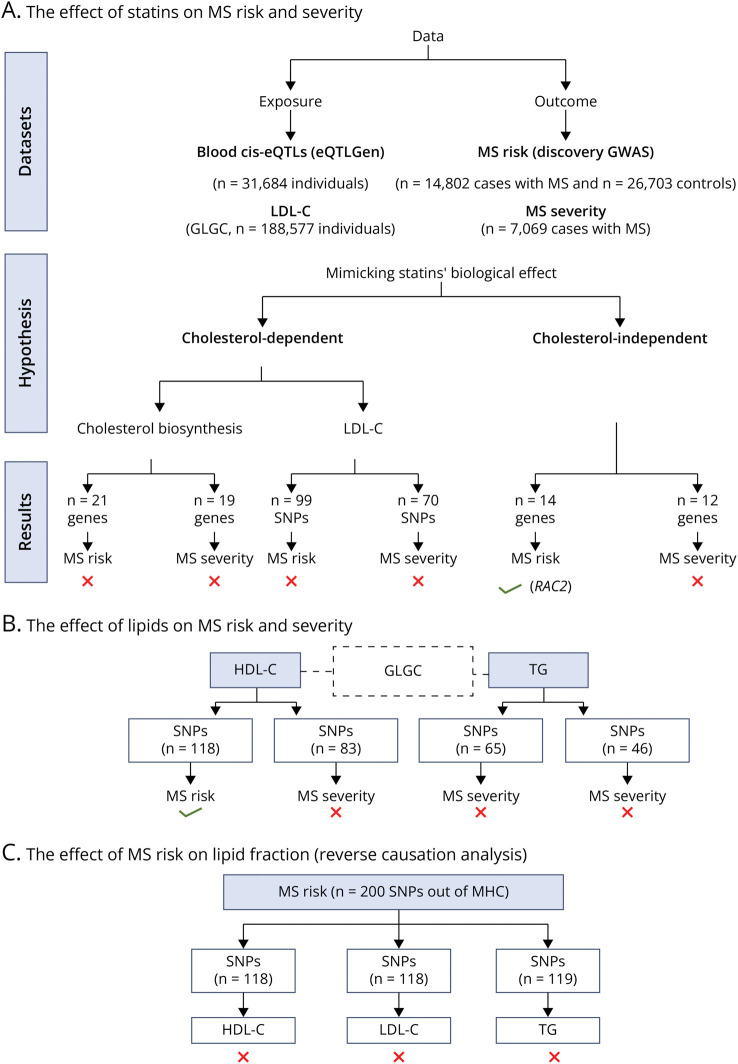
Method: We used two-sample Mendelian randomization (MR) to investigate (1) the causal role of genetically mimic both cholesterol-dependent (through low-density lipoprotein cholesterol (LDL-C) and cholesterol biosynthesis pathway) and cholesterol-independent (through Rho GTPases) effects of statins on MS risk and MS severity, (2) the causal link between lipids (high-density lipoprotein cholesterol [HDL-C] and triglycerides [TG]) levels and MS risk and severity, and (3) the reverse causation between lipid fractions and MS risk. We used summary statistics from the Global Lipids Genetics Consortium (GLGC), eQTLGen Consortium, and the International MS Genetics Consortium (IMSGC) for lipids, expression quantitative trait loci, and MS, respectively (GLGC: n = 188,577; eQTLGen: n = 31,684; IMSGC (MS risk): n = 41,505; IMSGC (MS severity): n = 7,069).
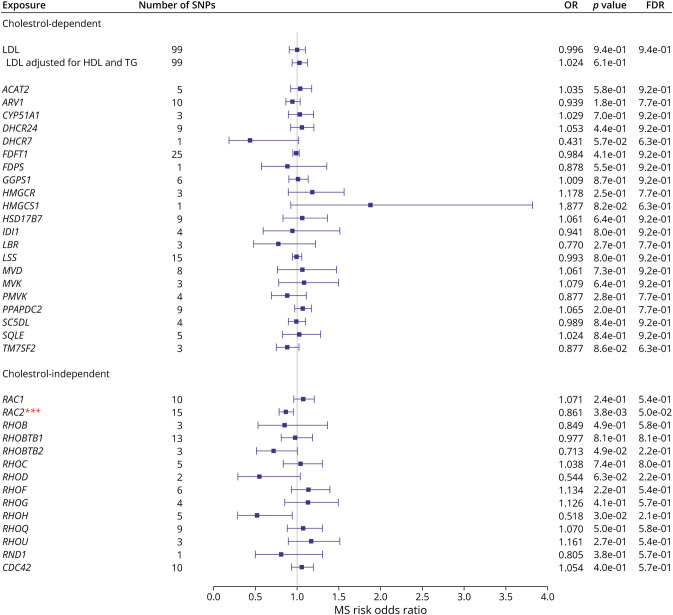
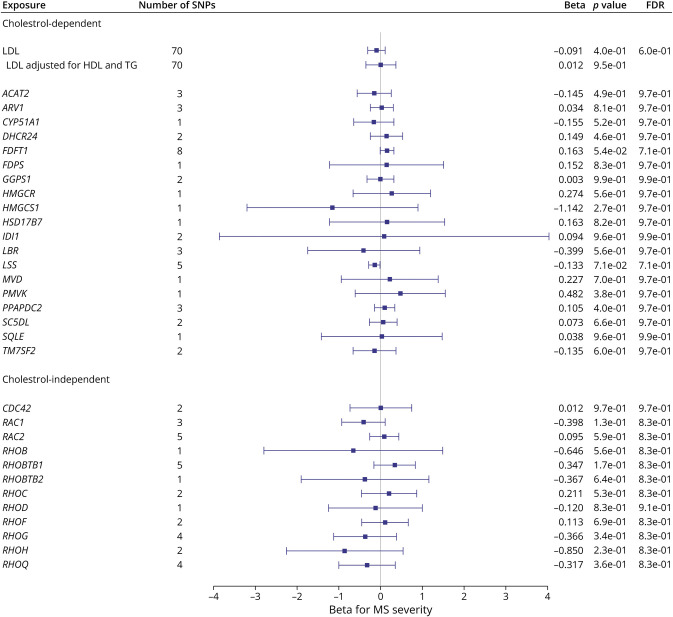
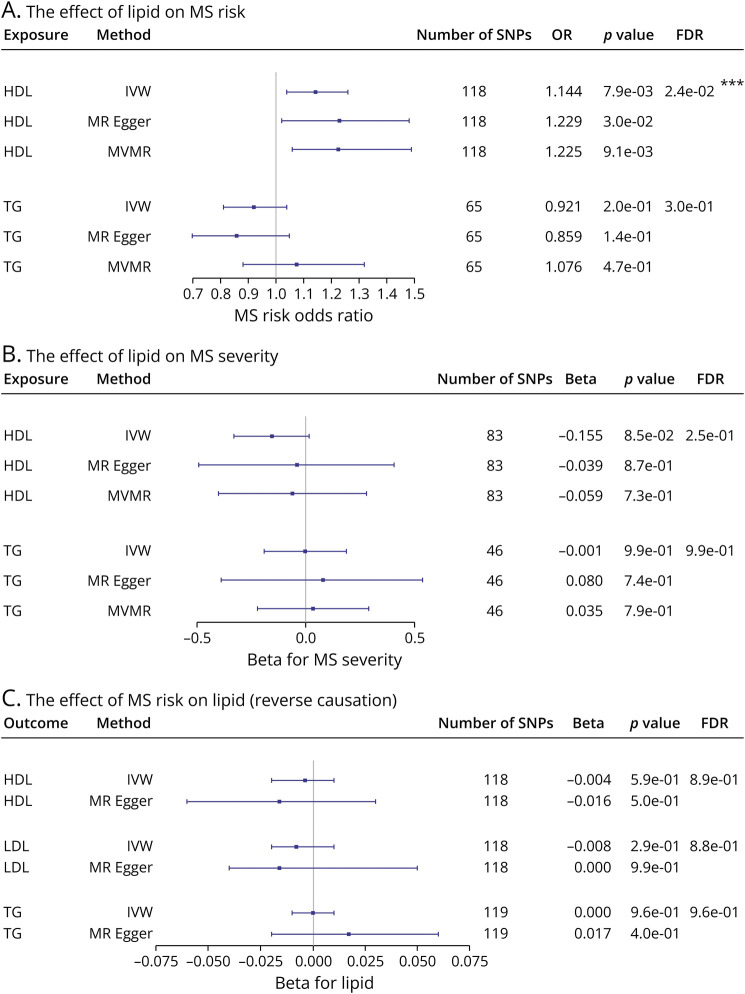
Results: The results of MR using the inverse-variance weighted method show that genetically predicted RAC2, a member of cholesterol-independent pathway (OR 0.86 [95% CI 0.78-0.95], p-value 3.80E-03), is implicated causally in reducing MS risk. We found no evidence for the causal role of LDL-C and the member of cholesterol biosynthesis pathway on MS risk. The MR results also show that lifelong higher HDL-C (OR 1.14 [95% CI 1.04-1.26], p-value 7.94E-03) increases MS risk but TG was not. Furthermore, we found no evidence for the causal role of lipids and genetically mimicked statins on MS severity. There is no evidence of reverse causation between MS risk and lipids.
Discussion: Evidence from this study suggests that RAC2 is a genetic modifier of MS risk. Because RAC2 has been reported to mediate some of the pleiotropic effects of statins, we suggest that statins may reduce MS risk through a cholesterol-independent pathway (that is, RAC2-related mechanism(s)). MR analyses also support a causal effect of HDL-C on MS risk.
Copyright © 2023 The Author(s). Published by Wolters Kluwer Health, Inc. on behalf of the American Academy of Neurology.
Conflict of interest statement
M. M. Almramhi is funded by the Faculty of Applied Medical Sciences, King Abdulaziz University, Jeddah, Saudi Arabia. C. Finan received additional support from the National Institute for Health Research University College London Hospitals Biomedical Research Centre. C. S. Storm is funded by Rosetrees Trust, John Black Charitable Foundation, and the University College London MBPhD Programme. A. F. Schmidt is supported by BHF grant PG/18/503383 and acknowledges support by grant R01 LM010098 from the NIH (United States). D. A. Kia is supported by an MBPhD Award from the International Journal of Experimental Pathology. R. Rachel Coneys is funded by Eisai, on the Wolfson-Eisai Neurodegeneration University College London PhD programme. N. W. Wood is a National Institute for Health Research senior investigator. N. W. Wood receives support from the National Institute for Health Research University College London Hospitals Biomedical Research Centre. All other authors report no disclosures relevant to the manuscript. Go to
Figures
Similar articles
-
Effects of genetically proxied lipid-lowering drugs on acute myocardial infarction: a drug-target mendelian randomization study.Lipids Health Dis. 2024 Jun 3;23(1):163. doi: 10.1186/s12944-024-02133-w. Lipids Health Dis. 2024. PMID: 38831433 Free PMC article.
-
The causal effects of lipid traits on kidney function in Africans: bidirectional and multivariable Mendelian-randomization study.EBioMedicine. 2023 Apr;90:104537. doi: 10.1016/j.ebiom.2023.104537. Epub 2023 Mar 29. EBioMedicine. 2023. PMID: 37001235 Free PMC article.
-
Plasma lipid levels and risk of retinal vascular occlusion: A genetic study using Mendelian randomization.Front Endocrinol (Lausanne). 2022 Oct 10;13:954453. doi: 10.3389/fendo.2022.954453. eCollection 2022. Front Endocrinol (Lausanne). 2022. PMID: 36299452 Free PMC article.
-
Role of Blood Lipids in the Development of Ischemic Stroke and its Subtypes: A Mendelian Randomization Study.Stroke. 2018 Apr;49(4):820-827. doi: 10.1161/STROKEAHA.117.019653. Epub 2018 Mar 13. Stroke. 2018. PMID: 29535274 Free PMC article.
-
Genetic Association of Lipids and Lipid Drug Targets With Abdominal Aortic Aneurysm: A Meta-analysis.JAMA Cardiol. 2018 Jan 1;3(1):26-33. doi: 10.1001/jamacardio.2017.4293. JAMA Cardiol. 2018. PMID: 29188294 Free PMC article. Review.
Cited by
-
Does the use of statins alter the risk of rheumatoid arthritis? A systematic review and meta-analysis.PLoS One. 2024 Jul 23;19(7):e0307599. doi: 10.1371/journal.pone.0307599. eCollection 2024. PLoS One. 2024. PMID: 39042634 Free PMC article.
-
A metabolome-wide Mendelian randomization study prioritizes potential causal circulating metabolites for multiple sclerosis.J Neuroimmunol. 2023 Jun 15;379:578105. doi: 10.1016/j.jneuroim.2023.578105. Epub 2023 May 11. J Neuroimmunol. 2023. PMID: 37207441 Free PMC article.
-
High-density lipoprotein cholesterol and multiple sclerosis: a systematic review and meta-analysis.Arch Med Sci Atheroscler Dis. 2025 Jun 2;10:e69-e77. doi: 10.5114/amsad/204578. eCollection 2025. Arch Med Sci Atheroscler Dis. 2025. PMID: 40620741 Free PMC article. Review.
-
Evaluating the effectiveness of simvastatin in slowing the progression of disability in secondary progressive multiple sclerosis (MS-STAT2): protocol for a multicentre, randomised controlled, double-blind, phase 3 clinical trial in the UK.BMJ Open. 2024 Sep 16;14(9):e086414. doi: 10.1136/bmjopen-2024-086414. BMJ Open. 2024. PMID: 39284697 Free PMC article.
References
Publication types
MeSH terms
Substances
Grants and funding
LinkOut - more resources
Full Text Sources
Medical
Miscellaneous