. 2023 Sep 1;14(1):5317.
doi: 10.1038/s41467-023-41091-2.

CENP-E activation by Aurora A and B controls kinetochore fibrous corona disassembly

Affiliations

CENP-E activation by Aurora A and B controls kinetochore fibrous corona disassembly

Susana Eibes et al. Nat Commun. .

Abstract

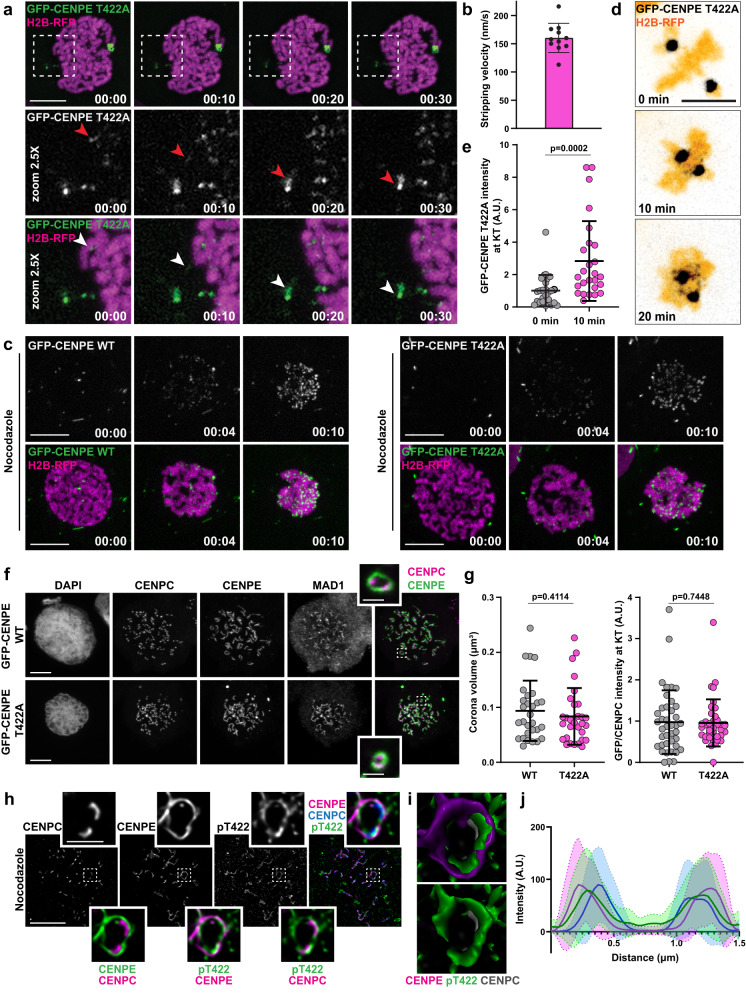
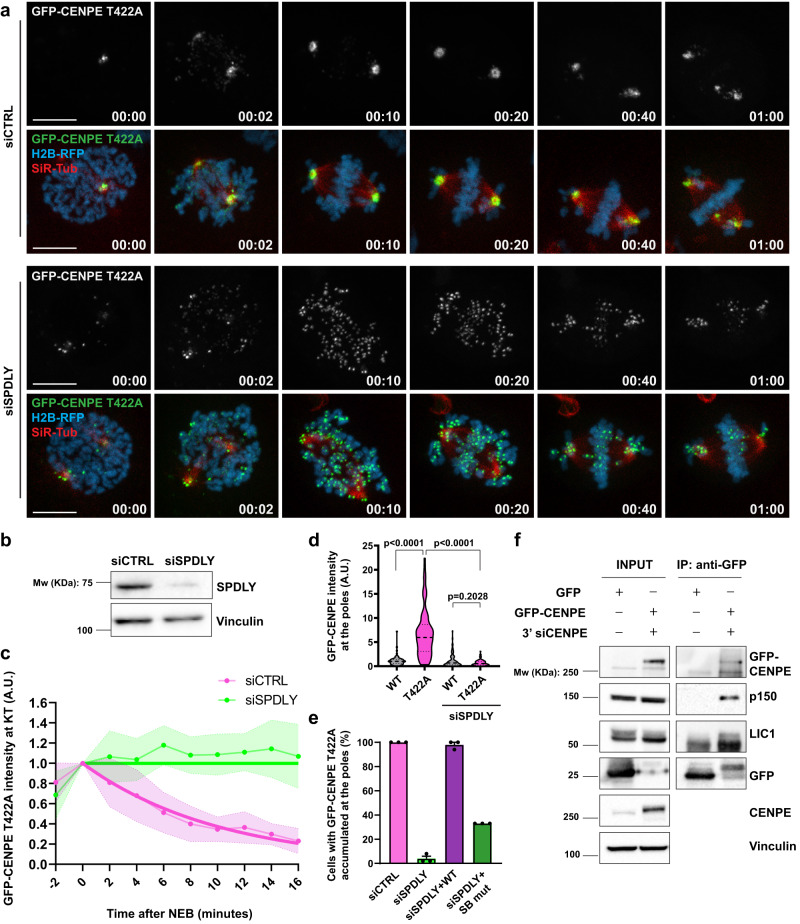
Accurate chromosome segregation in mitosis depends on multiprotein structures called kinetochores that are built on the centromeric region of sister chromatids and serve to capture mitotic spindle microtubules. In early mitosis, unattached kinetochores expand a crescent-shaped structure called fibrous corona whose function is to facilitate initial kinetochore-microtubule attachments and chromosome transport by microtubules. Subsequently, the fibrous corona must be timely disassembled to prevent segregation errors. Although recent studies provided new insights on the molecular content and mechanism of fibrous corona assembly, it remains unknown what triggers the disassembly of the outermost and dynamic layer of the kinetochore. Here, we show that Aurora A and B kinases phosphorylate CENP-E to release it from an autoinhibited state. At kinetochores, Aurora B phosphorylates CENP-E to prevent its premature removal together with other corona proteins by dynein. At the spindle poles, Aurora A phosphorylates CENP-E to promote chromosome congression and prevent accumulation of corona proteins at the centrosomes, allowing for their intracellular redistribution. Thus, we propose the Aurora A/B-CENP-E axis as a critical element of the long-sought-for mechanism of fibrous corona disassembly that is essential for accurate chromosome segregation.


Conflict of interest statement

The authors declare no competing interests.

Figures

Fig. 1
Fig. 1. Lack of Aurora A- and B- mediated phosphorylation of CENP-E promotes premature removal of CENP-E from kinetochores and its accumulation at the spindle poles.
a Representative spinning-disk confocal time-series of mitosis in U2OS GFP-CENP-E WT/T422A cells. H2B-RFP and SiR-tubulin are used to visualize DNA and MTs, respectively. Red arrowheads indicate spindle pole accumulation of CENP-E mutant. Time: hour:min. Scale bar: 10 μm. b Immunoblot of inducible expression of GFP-CENP-E along with depletion of endogenous CENP-E. c GFP-CENP-E intensity at KTs over time after NEB in U2OS cells expressing CENP-A-mCherry. Dots and dashed lines represent mean values and SD respectively. The solid thick line represents the fitted curve. N (number of cells, number of independent experiments): GFP-CENP-E WT (10, 4), GFP-CENP-E T422A (10, 4). d Representative time-series of GFP-CENP-E WT/T422A localization in monopolar spindles. Time scale: hour:min. Bottom panel shows GFP-CENP-E WT distribution in Aurora A-inhibited cells. Red arrowhead emphasizes transient spindle pole accumulation of CENP-E WT in the absence of Aurora A activity. Time: hour:min. Scale bars: 10 μm. e Quantification of the percentage of mitotic cells with transient accumulation of GFP-CENP-E WT at the spindle poles. The values are plotted with mean and SEM. N (number of cells, number of independent experiments): CTRL (32, 3) MLN8054 (28, 3). f Maximum intensity projected confocal images of endogenous CENP-E at KTs in U2OS cells undergoing the indicated treatments. Scale bars: 10 μm. g Quantification of endogenous CENP-E intensity normalized to CENP-C intensity at KTs. Violin plots with median (thick dashed lines) and quartiles (light dashed lines) represent the average KT intensities in cells. N (number of KTs, number of cells, number of independent experiments): NOC (1036, 29, 3), NOC + ZM447439 (1010, 29, 3), STLC (1044, 29, 3), STLC + ZM447439 (1063, 29, 3). Statistical significance was determined by the Mann–Whitney U-test (unpaired, two-tailed; no normal distribution). p values are indicated. h Illustrated model of the impact of T422A mutation on CENP-E localization and chromosome congression. Non-phosphorylatable CENP-E (green) is prematurely removed from KTs, and it accumulates at the spindle poles. Cells are arrested in a pseudo-metaphase with uncongressed polar chromosomes.
Fig. 2
Fig. 2. Removal of phospho-null CENP-E from kinetochores and its accumulation at the spindle poles require microtubules.
a High temporal resolution spinning-disk confocal time-series of GFP-CENP-E T422A at KTs in U2OS cells. Time: min:sec. Scale bar: 10 μm. Red and white arrowheads indicate a CENP-E T422A comet. b Quantification of GFP-CENP-E T422A stripping velocity represented with mean ± SD. A total of 11 comets in 9 cells from 3 independent experiments were analyzed. c Representative time-series of U2OS GFP-CENP-E WT/T422A cells entering mitosis in the absence of MTs. Time: hour:min. Scale bar: 10 μm. d Time-lapse images of GFP-CENP-E T422A reloading at KTs after MT depolymerization. Time: hour:min Scale bars: 10 μm. e Quantification of GFP-CENP-E T422A at the KTs over time after the addition of nocodazole. Average KT intensities in cells are represented with mean ± SD. N (number of KTs, number of cells, number of independent experiments): t = 0 min (520, 26, 3), t = 10 min (525, 226, 3). Statistical significance was determined by the Mann–Whitney U-test (unpaired, two-tailed; no normal distribution). p values are indicated. f Representative maximum intensity-projected confocal images of expanded fibrous coronas in HeLa cells transiently transfected with GFP-CENP-E WT/T422A. Insets display single KT pairs with expanded coronas. Scale bar: 5 μm; scale bar in insets: 1 μm. g Quantification of corona volume and GFP intensity normalized to CENP-C intensity at KTs. Average KT intensities in cells are represented with mean ± SD. N (number of coronas, number of cells, number of independent experiments) - Corona volume: WT (1038, 29, 3), T422A (1063, 30, 3); KT intensity: WT (899, 40, 3), T422A (781, 38, 3). Statistical significance was determined by the Mann–Whitney U-test (unpaired, two-tailed; no normal distribution). h Structured illumination microscopy (SIM) images of phosphorylated CENP-E at expanded coronas of RPE cells, detected using the anti-phospho-T422 antibody. Scale bar: 5 μm; scale bar in insets: 1 μm. i 3D surface rendering model of the fibrous corona represented in h. j Intensity profile plot of 40 coronas from 10 different cells from 2 independent experiments as represented in h. Thick and dashed lines represent averages and SD, respectively.
Fig. 3
Fig. 3. Lack of CENP-E phosphorylation at T422 promotes dynein-mediated stripping of CENP-E from kinetochores.
a Representative spinning-disk confocal time-series of control and Spindly-depleted U2OS cells expressing GFP-CENP-E T422A. Time scale: hour:min. Scale bar: 10 μm. b Immunoblot of Spindly depletion in GFP-CENP-E T422A cells. Four independent experiments showed similar results. c GFP-CENP-E T422A intensity at KTs at different time points after NEB in CENPA-mCherry-expressing cells. Dots and dashed lines represent mean values and SD, respectively. The solid thick line represents the fitted curve. N (number of cells, number of independent experiments): T422A + siCTRL (10, 4), T422A + siSPDLY (10, 2). d Immunofluorescence-based quantification of GFP-CENP-E intensities at the spindle poles in metaphase/pseudo-metaphase. Violin plots with median (thick dashed lines) and quartiles (light dashed lines) are presented. N (number of spindle poles, number of independent experiments) WT (66, 3) T422A (84, 3), WT + siSPDLY (90, 3), T422A + siSPDLY (79, 3). Statistical significance was determined by the Mann–Whitney U-test (unpaired, two-tailed; no normal distribution). p values are indicated. e Percentage of pseudo-metaphases with GFP-CENP-E T422A accumulated at the pole, represented with mean and SEM. N (number of cells, number of independent experiments): siCTRL (150, 3), siSPDLY (150, 3), siSPDLY + SPDLY WT (32, 3) and siSPDLY + SPDLY SB mutant (30, 3) in 3 immunostainings. Scale bar: 10 μm. f Co-immunoprecipitation of GFP-CEN-PE WT with two subunits of the dynein complex dynactin/p150 and dynein light intermediate chain/LIC1 from mitotic enriched HEK293 cells. Three independent experiments showed similar results.
Fig. 4
Fig. 4. Lack of CENP-E phosphorylation initiates dynein-mediated stripping of corona.
a Spinning-disk confocal time-series of HeLa cells stably expressing DHC-GFP/CENP-A-mCherry and labeling of DNA with SiR-DNA undergoing the indicated treatments. The red arrow shows the presence of dynein in one KT in early metaphase. Relative time from NEB is represented. Time scale: hour:min. Scale bar: 10 μm. b DHC-GFP dynamics at KTs after NEB. Dots and dashed lines represent mean values and SD, respectively. The solid thick line represents the fitted curve. N (number of cells, number of independent experiments): siCTRL (13, 2), siCENP-E (14, 2). c Representative maximum intensity-projected point-scanning confocal images of U2OS WT/T422A monopoles immunostained against the indicated proteins. Scale bar: 10 μm. d Fluorescence intensity profile plots of the indicated proteins (representing the region depicted by a white dashed line in c). e Quantification of spindle pole accumulation of indicated proteins in U2OS GFP-CENP-E WT and T422A cells represented in c. Values are plotted with mean ± SD. N (number of cells, number of independent experiments): GFP-CENP-E in WT (51, 3), GFP-CENP-E in T422A (55, 3), SPDLY in WT (54, 3), SPDLY in T422A (52, 3), ZW10 in WT (33, 3), ZW10 in T422A (34, 3), MAD1 in WT (43, 3), MAD1 in T422A (39, 3), BUBR1 in WT (50, 3), BUBR1 in T422A (49, 3). Statistical significance was determined by the Mann–Whitney U-test (unpaired, two-tailed; no normal distribution). p values are indicated.
Fig. 5
Fig. 5. Aurora A and B kinases activate CENP-E by releasing it from an auto-inhibited state.
a Schematic representation of the CENP-E constructs used in this study. b Co-immunoprecipitation of FLAG-GFP-CENP-E (1779-2701) construct with WT and T422A CENP-E-MYC (1-859). Four independent experiments showed similar results. c Representative maximum intensity-projected point-scanning confocal images of monopoles in U2OS CENP-E WT and T422A cell lines following the indicated treatments. Scale bar: 10 μm. d Quantification of GFP spindle pole/ total intensity ratio following the indicated treatments in CENP-E WT/T422A monopoles. Values are plotted with mean ± SD. N (number of cells, number of independent experiments) - GFP-CENP-E WT: siCTRL + DMSO (64, 3), siCTRL + GSK923295 (58, 3), siCTRL + Cmpd-A (59, 3), siSPDLY + DMSO (60, 3), siSPDLY + GSK923295 (59, 3), siSPDLY + Cmpd-A (61, 3); GFP-CENP-E T422A: siCTRL + DMSO (60, 3), siCTRL + GSK923295 (60, 3), siCTRL + Cmpd-A (61, 3), siSPDLY + DMSO (60, 3), siSPDLY + GSK923295 (60, 3), siSPDLY + Cmpd-A (58, 3). Note that in the absence of KT-bound dynein (CENP-E-WT + siSpindly) chromosomes are dispersed away from the pole by polar ejection forces (PEFs), lowering the ratio of polar and total intensity. Statistical significance was determined by the Mann–Whitney U-test (unpaired, two-tailed; no normal distribution). p values are indicated. e Spinning-disk confocal time-series of mitosis of GFP-CENP-E WT/T422A cells undergoing indicated treatments. Red arrowheads show spindle pole accumulation of non-phosphorylated CENP-E and inhibited CENP-E. Time: hour:min. Scale bar: 10 μm. f Illustrated model of the effects of CENP-E phosphorylation by Aurora A and B kinases. CENP-E activation is regulated by phosphorylation/dephosphorylation. Phosphorylation-activated CENP-E is dominant over dynein and thus facilitates chromosome congression to the spindle equator. CENP-E dephosphorylation inactivates CENP-E, thereby triggering dynein-mediated stripping of corona proteins toward the spindle pole. Re-activation of CENP-E by Aurora A phosphorylation at centrosome releases corona proteins from the spindle pole. Illustrations created with BioRender.com.

References

    1. Kops G, Gassmann R. Crowning the kinetochore: the fibrous corona in chromosome segregation. Trends Cell Biol. 2020;30:653–667. - PubMed
    1. Magidson V, et al. Adaptive changes in the kinetochore architecture facilitate proper spindle assembly. Nat. Cell Biol. 2015;17:1134–1144. - PMC - PubMed
    1. Sacristan C, et al. Dynamic kinetochore size regulation promotes microtubule capture and chromosome biorientation in mitosis. Nat. Cell Biol. 2018;20:800–810. - PMC - PubMed
    1. Pereira C, et al. Self-assembly of the RZZ complex into filaments drives kinetochore expansion in the absence of microtubule attachment. Curr. Biol. 2018;28:3408–3421.e3408. - PMC - PubMed
    1. Raisch T, et al. Structure of the RZZ complex and molecular basis of Spindly-driven corona assembly at human kinetochores. EMBO J. 2022;41:e110411. - PMC - PubMed

Publication types