. 2023 Sep 1;14(1):5329.
doi: 10.1038/s41467-023-41074-3.

The interplay between dietary fatty acids and gut microbiota influences host metabolism and hepatic steatosis

Affiliations

The interplay between dietary fatty acids and gut microbiota influences host metabolism and hepatic steatosis

Marc Schoeler et al. Nat Commun. .

Abstract

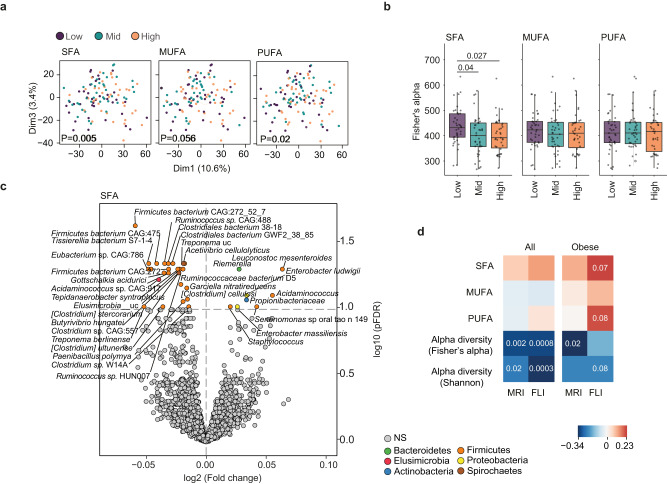
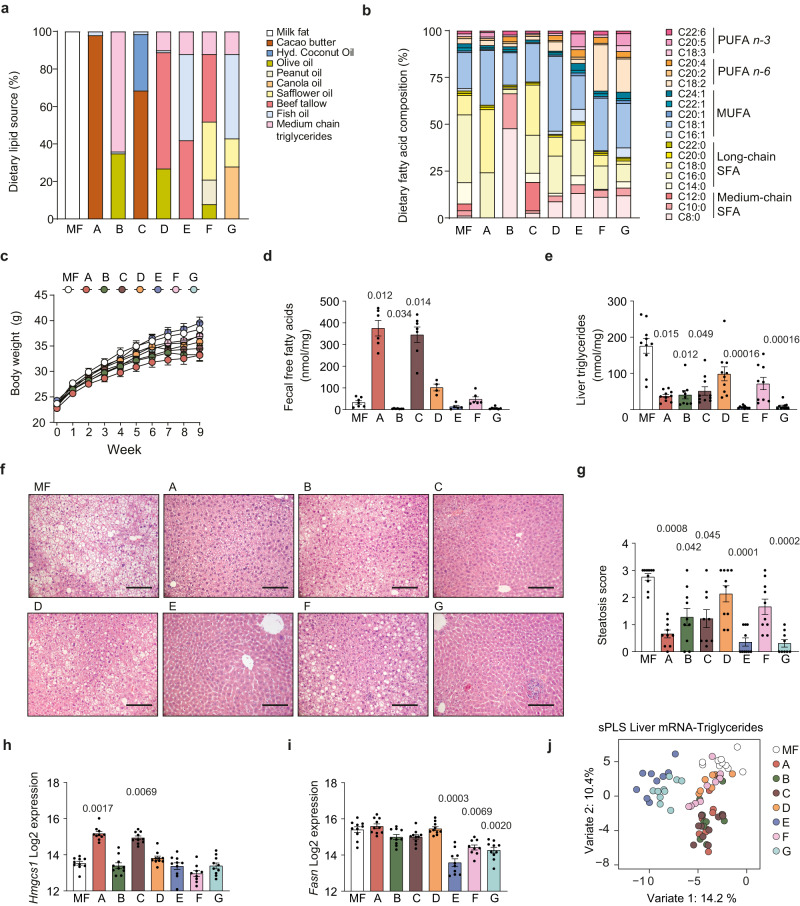
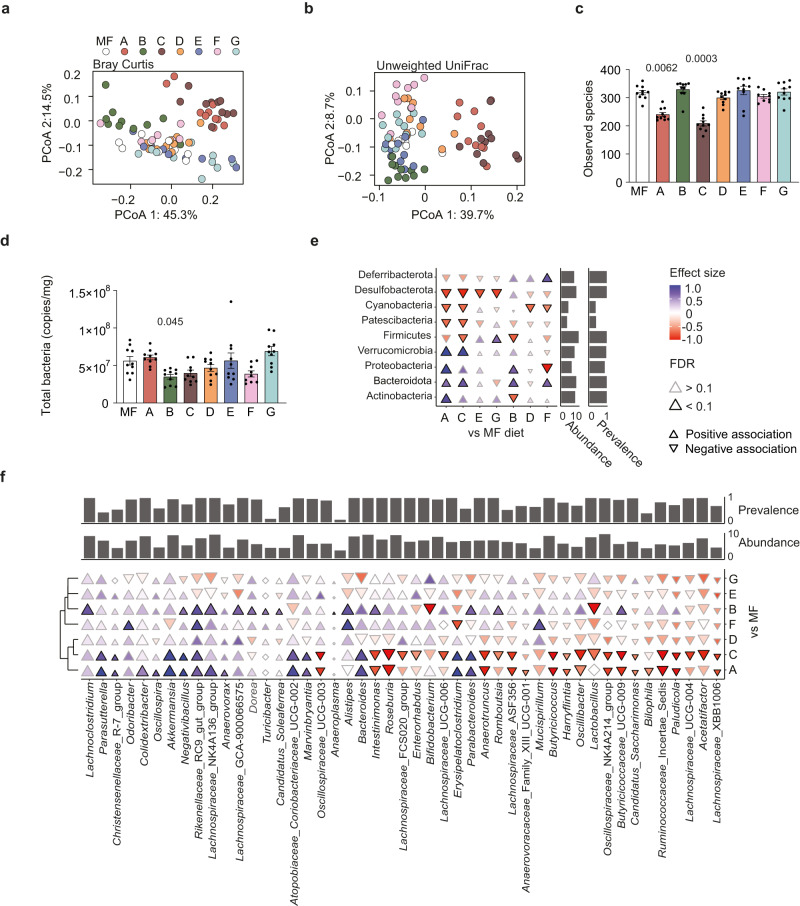
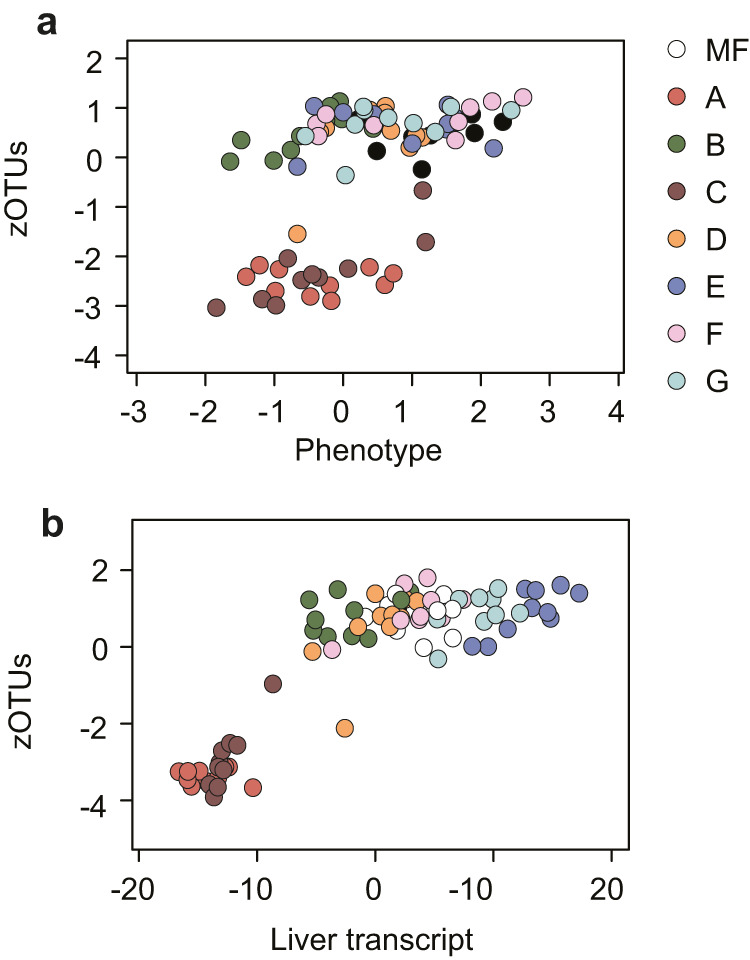
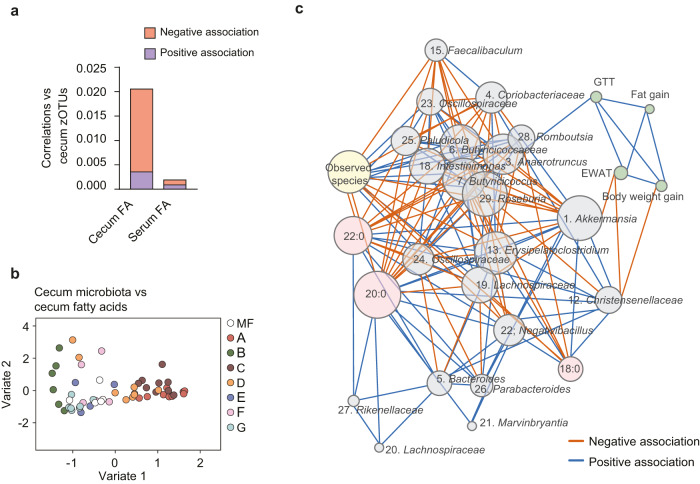
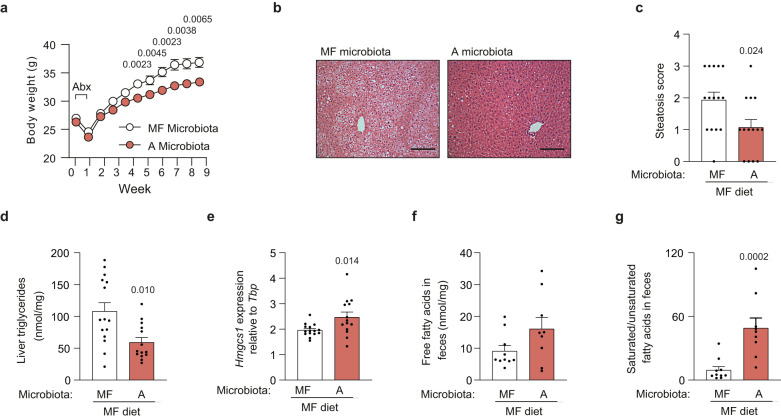
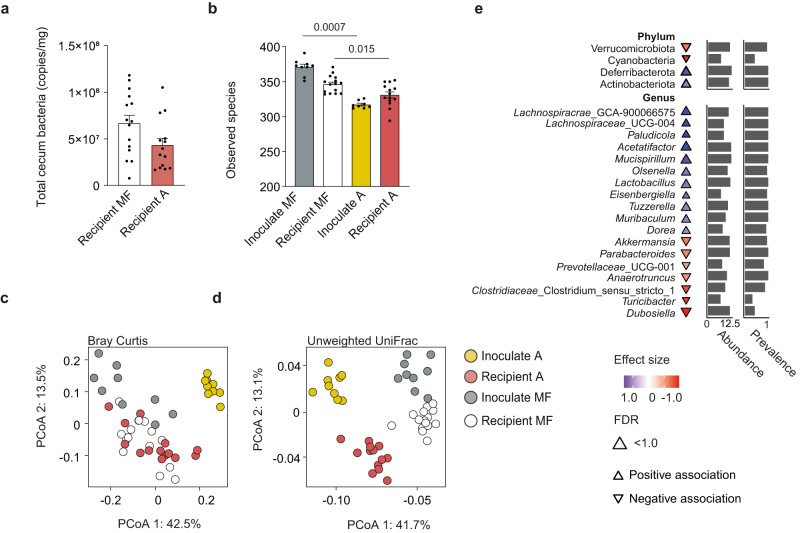
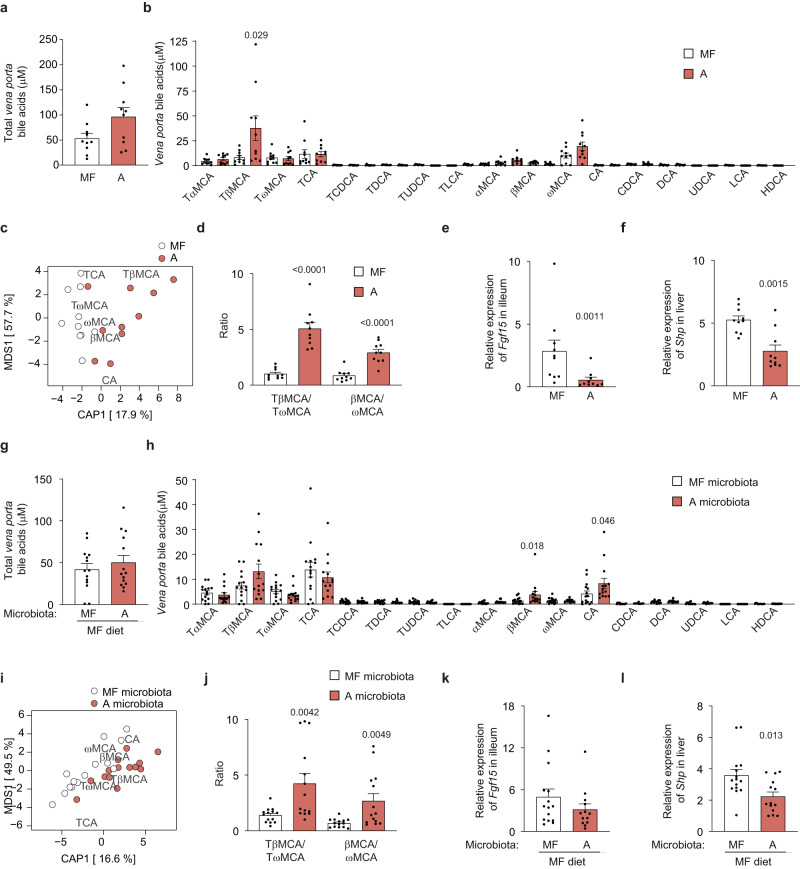
Dietary lipids can affect metabolic health through gut microbiota-mediated mechanisms, but the influence of lipid-microbiota interaction on liver steatosis is largely unknown. We investigate the impact of dietary lipids on human gut microbiota composition and the effects of microbiota-lipid interactions on steatosis in male mice. In humans, low intake of saturated fatty acids (SFA) is associated with increased microbial diversity independent of fiber intake. In mice, poorly absorbed dietary long-chain SFA, particularly stearic acid, induce a shift in bile acid profile and improved metabolism and steatosis. These benefits are dependent on the gut microbiota, as they are transmitted by microbial transfer. Diets enriched in polyunsaturated fatty acids are protective against steatosis but have minor influence on the microbiota. In summary, we find that diets enriched in poorly absorbed long-chain SFA modulate gut microbiota profiles independent of fiber intake, and this interaction is relevant to improve metabolism and decrease liver steatosis.


Conflict of interest statement

The authors declare no competing interests.

Figures

Fig. 1
Fig. 1. Increased consumption of SFA decreases gut microbiota diversity and abundance of butyrate-producing bacteria in humans.
Subjects from the IRONMET cohort. a Principal component analysis (PCA) on fecal microbiome data according to tertiles of SFA, MUFA and PUFA consumption. b Boxplots of α-diversity measured by Fisher’s alpha. Subjects were divided into tertiles based on SFA, MUFA or PUFA consumption. Each subject was included in the analysis of all three fatty acid categories (n = 39 per category and tertile). There were no significant differences in sequencing depth among tertiles. c Volcano plot of differential bacterial (pFDR <0.05) associated with the amount of SFA consumed identified after fitting a robust linear regression model to the clr-transformed data controlling for age, sex, BMI and fiber intake. Fold change associated with a unit change in SFA and FDR-adjusted values (pFDR) are plotted for each taxon. Significant taxa are colored according to phylum as shown. d Spearman correlation of SAT, MUFA and PUFA consumption, alpha diversity (Fisher’s alpha and Shannon diversity) against liver fat determined by MRI and FLI in all subjects, and in only obese subjects (n = 85) after controlling for age and sex. n = 117. Significant p-values as determined by two-sided Wilcoxon rank-sum test are displayed in the figure. For box plots in (b): the middle line is the median, the lower and upper hinges are the first and third quartiles, the whiskers extend from the hinge to the largest and smallest value no further than 1.5 × the inter-quartile range (IQR). SFA saturated fatty acids, MUFA mono-unsaturated fatty acids, PUFA poly-unsaturated fatty acids. See also Supplementary Fig. 1. Source data are provided as a Source data file.
Fig. 2
Fig. 2. Dietary fatty acid composition influences adiposity, steatosis, fecal lipid abundance and hepatic gene expression in mice.
Eight groups of mice were fed high-fat diets with different lipid compositions (MF, A–G) for 9 weeks. a Fat sources and b fatty acid composition of diets. c Body weight, d fecal concentration of free fatty acids, e liver triglyceride concentration, f hematoxylin and eosin staining of liver tissue (scale bar = 100 µm) and g steatosis score. Hepatic expression of h Hmgcs and i Fasn determined by microarray analysis. j Sparse partial least squares regression (sPLS) analysis of microarray data and liver triglyceride levels liver triglyceride concentration. c, gj: n = 10 except for F where n = 9; d: n = 7 (MF), 6 (A), 7 (B), 7 (C), 4 (D), 5 (E), 6 (F), and 7 (G); e: n = 10 except for B and F where n = 9. Significant p values vs MF diet as determined by two-sided Kruskal–Wallis test are displayed in (di). Data are presented as mean ± SEM. SFA saturated fatty acids, MUFA mono-unsaturated fatty acids, PUFA poly-unsaturated fatty acids, Hmgcs1 3-hydroxy-3-methylglutaryl-Coenzyme A synthase 1, Fasn fatty acid synthase. See also Supplementary Figs. 2 and 3 and Supplementary Table 1. Source data are provided as a Source data file.
Fig. 3
Fig. 3. Dietary fatty acid composition influences cecal microbiota profile in mice.
Analysis of cecal microbiota by 16S rRNA gene sequencing in eight groups of mice fed high-fat diets (MF, A-G) for 9 weeks. Principal coordinate analysis (PCoA) based on a Bray–Curtis dissimilarity and b unweighted UniFrac. c Number of observed species. d Quantification of total bacterial counts in cecum by qPCR. Differentially abundant e phyla and f genera in mice on diets A-G compared to MF diet, controlled for cage effects. Black-bordered triangles in panel E and F: Two-sided Wilcoxon rank sum test FDR-adjusted p value < 0.1. The direction and coloring of triangles indicate Cliff’s Delta effect size. The triangle size and left (e)/lower (f) marginal bar plot depict log transformed abundance of individual genera. Right (e)/upper (f) marginal bar plot shows proportion of samples containing respective genera. Source data are provided as a Source data file. n = 10 except for F where n = 9. Significant p values vs MF diet as determined by two-sided Wilcoxon rank sum test are displayed in the figure. Data are presented as mean ± SEM. See also Supplementary Fig. 5 and Supplementary Table 3. Source data are provided as a Source data file.
Fig. 4
Fig. 4. Covariance between cecum microbiota, host metabolic features and hepatic gene expression.
a N-integration discriminant analysis with DIABLO between zOTUs in the cecal microbiota and host metabolic features (glucose tolerance test, area under the curve (GTT AUC), epididymal adipose tissue (EWAT) weight, fat gain, body weight gain and liver triglyceride levels). b N-integration discriminant analysis with DIABLO between cecal microbiota zOTUs and hepatic gene expression as determined by microarray analysis. n = 10 except for F where n = 9.
Fig. 5
Fig. 5. Covariance between fatty acids, cecum microbiota and host features.
a Density of the correlation network between cecal zOTUs and cecal or serum fatty acids determined by regularized canonical correlation analysis (rCCA). b Cluster plot based on correlations between cecal fatty acids and cecal zOTUs determined by rCCA. c Network of interactions between cecum fatty acids, bacterial taxa, microbiota observed species and host metabolic phenotypes. Spearman’s rho and taxonomy of bacterial taxa in Supplementary Data 1. n = 5 (MF), 10 (A), 6 (B), 9 (C), 7 (D), 4 (E), 3 (F), 7 (G). GTT glucose tolerance test, EWAT epididymal white adipose tissue. See also Supplementary Fig. 6 and Supplementary Data 1 and 2. Source data are provided as a Source data file.
Fig. 6
Fig. 6. Transfer of cecal microbiota from mice fed diet A protects against obesity, impairment of glucose metabolism and steatosis in mice fed the MF diet.
Mice were inoculated with cecal microbiota from mice fed MF or A diet and subsequently fed MF diet for 9 weeks. a Body weight, b eosin-hematoxylin staining of liver tissue (scale bar = 100 µm), c steatosis score, d liver triglyceride concentration, e hepatic expression of Hmgcr determined by qPCR, f fecal free fatty acids, and g ratio between saturated and unsaturated fecal free fatty acids. ae: n = 15 (MF microbiota), 14 (A microbiota); f, g: n = 10 (MF microbiota) and 9 (A microbiota). Significant p values determined by two-sided Mann–Whitney U-test are displayed in the figure. Data are presented as mean ± SEM. Hmgcs1 3-hydroxy-3-methylglutaryl-Coenzyme A synthase 1. See also Supplementary Figs. 7 and 8. Source data are provided as a Source data file.
Fig. 7
Fig. 7. Cecal microbiota composition in recipient mice after microbiota transfer.
Mice were inoculated with cecal microbiota from mice fed MF or A diet and subsequently fed MF diet for 9 weeks. a Quantification of total bacterial counts in cecum by qPCR. b Number of observed species of inoculums and in recipient mice fed MF microbiota and inoculated with either MF or A diet microbiota. Principal coordinates analysis (PCoA) based on c Bray–Curtis dissimilarity and d unweighted UniFrac distance (means of ranked distances between recipients of microbiota from mice fed diets A or MF and of the inoculums used to colonize the mice). e Differential abundance of bacterial taxa at phylum and genus levels for mice after inoculation with cecal microbiota from mice on MF or A diets. Two-sided Wilcoxon rank sum test FDR-adjusted p value < 0.1. Direction and coloring of triangles indicate Cliff’s Delta effect size (positive effect size and blue color indicate increased relative abundance in diet A microbiota recipients). The triangle size and left marginal bar plot depict log transformed abundance of individual taxa. The right marginal bar plot shows proportion of samples containing respective taxa. n = 9 (MF microbiota inoculum), 15 (MF microbiota recipients), 8 (A microbiota inoculum), 14 (A microbiota recipients). Significant p values determined by two-sided Mann–Whitney U-test are displayed in the figure. Data are presented as mean ± SEM. See also Supplementary Fig. 10. Source data are provided as a Source data file.
Fig. 8
Fig. 8. The cecal microbiota from mice fed diet A regulates vena porta bile acid levels and hepatic expression of Shp in mice fed the MF diet.
Bile acid levels and expression of genes regulated by bile acids in mice fed diet A or MF diet for 9 weeks (af) and in mice inoculated with cecal microbiota from mice fed MF or A diet and subsequently fed MF diet for 9 weeks (gl). a Total vena porta bile acid levels, b vena porta levels of individual bile acids, c redundancy analysis (RDA) plot based on relative bile acid levels in vena porta, d TβMCA/TωMCA and βMCA/ωMCA ratios, e relative ileum expression of Fgf15 and f relative hepatic expression of Shp in mice fed diet A or MF diet. g Total vena porta bile acid levels, h vena porta levels of individual bile acids, i redundancy analysis (RDA) plot based on relative bile acid levels in vena porta, j TβMCA/TωMCA and βMCA/ωMCA ratios, k relative ileum expression of Fgf15, and l relative liver expression of Shp in mice inoculated with cecal microbiota from mice fed MF or A diet and subsequently fed MF diet. af: n = 10; gl: n = 15 (MF microbiota), 14 (A microbiota) except for k where n = 13 for A microbiota. Significant p-values determined by two-sided Mann–Whitney U-test are displayed in the figure. Data are presented as mean ± SEM. MCA muricholic acid, CA cholic acid, CDCA chenodeoxycholic acid, DCA deoxycholic acid, UDCA ursodeoxycholic acid, LCA lithocholic acid, HDCA hyodeoxycholic acid, T taurine-conjugated species, Fgf15 fibroblast growth factor 15, Shp small heterodimer partner. Source data are provided as a Source data file.

References

    1. Riazi K, et al. The prevalence and incidence of NAFLD worldwide: a systematic review and meta-analysis. Lancet Gastroenterol. Hepatol. 2022;7:851–861. - PubMed
    1. Hodson L, Rosqvist F, Parry SA. The influence of dietary fatty acids on liver fat content and metabolism. Proc. Nutr. Soc. 2020;79:30–41. - PubMed
    1. Jump DB, Tripathy S, Depner CM. Fatty acid–regulated transcription factors in the liver. Annu. Rev. Nutr. 2013;33:249–269. - PMC - PubMed
    1. Henao-Mejia J, et al. Inflammasome-mediated dysbiosis regulates progression of NAFLD and obesity. Nature. 2012;482:179–185. - PMC - PubMed
    1. Le Roy T, et al. Intestinal microbiota determines development of non-alcoholic fatty liver disease in mice. Gut. 2013;62:1787–1794. - PubMed

Publication types