Clinical Trial
. 2023 Sep 2;14(1):5332.
doi: 10.1038/s41467-023-40813-w.

Atezolizumab plus stereotactic ablative radiotherapy for medically inoperable patients with early-stage non-small cell lung cancer: a multi-institutional phase I trial

Affiliations
Clinical Trial

Atezolizumab plus stereotactic ablative radiotherapy for medically inoperable patients with early-stage non-small cell lung cancer: a multi-institutional phase I trial

Arta M Monjazeb et al. Nat Commun. .

Abstract

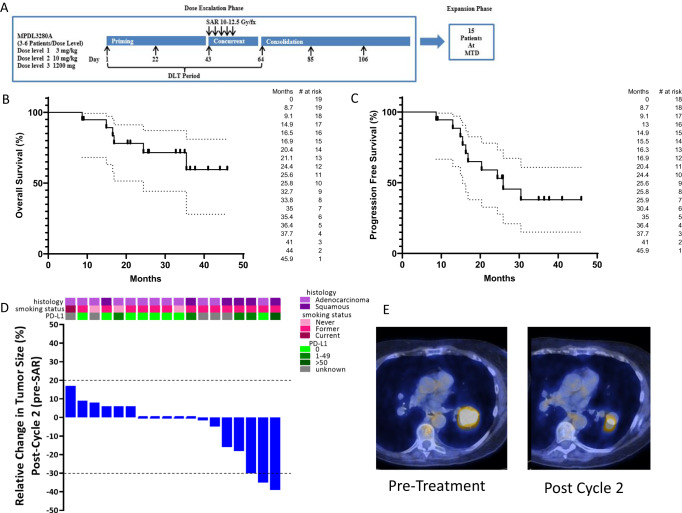
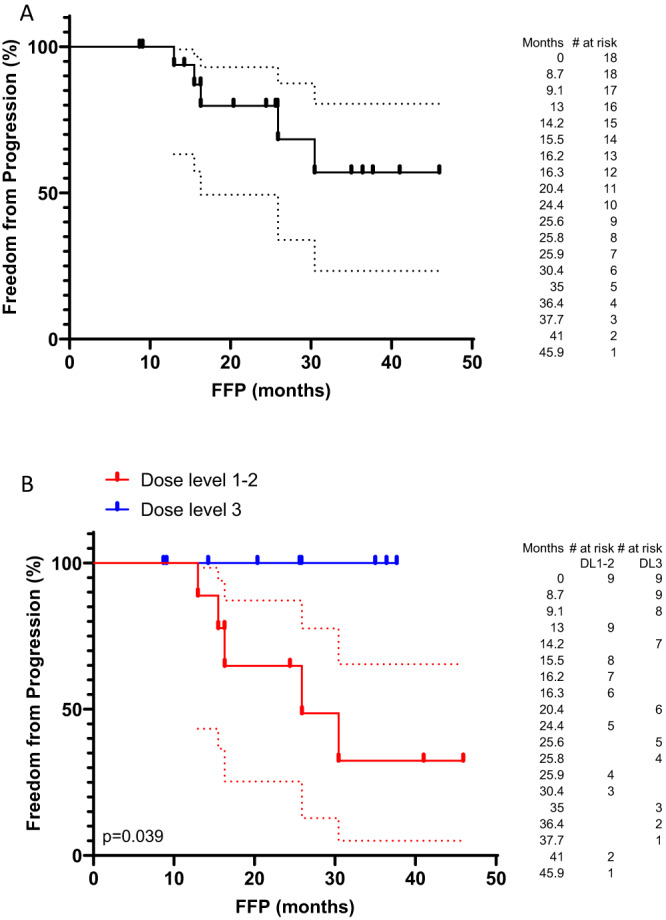
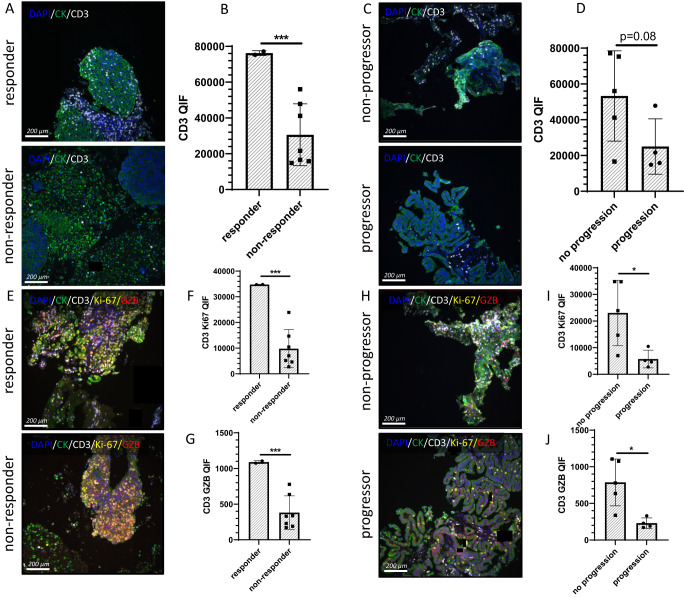
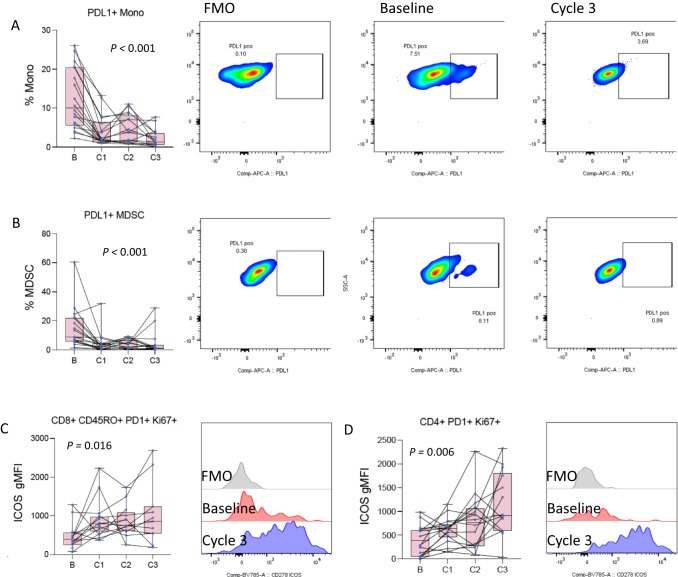
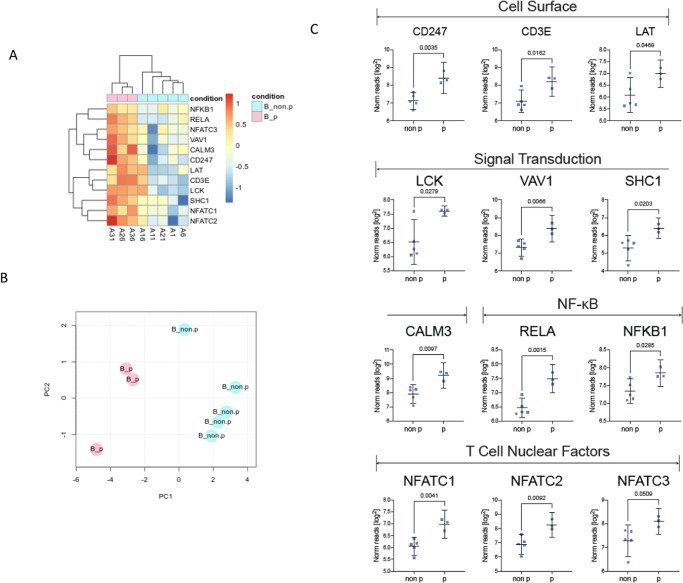
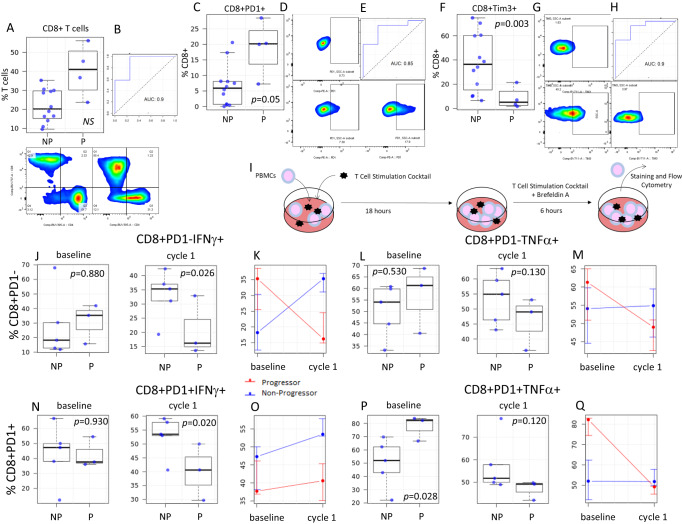
Stereotactic ablative radiotherapy (SABR) is a standard-of-care for medically-inoperable-early-stage non-small cell lung cancer (NSCLC). One third of patients progress and chemotherapy is rarely used in this population. We questioned if addition of the immune-checkpoint-inhibitor (ICI) atezolizumab to standard-of-care SABR can improve outcomes. We initiated a multi-institutional single-arm phase I study (NCT02599454) enrolling twenty patients with the primary endpoint of maximum tolerated dose (MTD); secondary endpoints of safety and efficacy; and exploratory mechanistic correlatives. Treatment is well tolerated and full dose atezolizumab (1200 mg) is the MTD. Efficacy signals include early responses (after 2 cycles of ICI, before initiation of SABR) in 17% of patients. Biomarkers of functional adaptive immunity, including T cell activation in the tumor and response to ex-vivo stimulation by circulating T cells, are highly predictive of benefit. These results require validation and are being tested in a phase III randomized trial.


Conflict of interest statement

A.M.M. – Grants/Contracts: Incyte, Merck, Genentech, BMS, Transgene, EMD Serono, Trisalus. Consulting Fees: Atheneum, First Thought, Opinion Site, Alcimed. Honoraria: ANCO, ACVR. Advisory Board and Stock Options: Multiplex Thera. M.E.D.—Grants/Contracts: Merck, Genentech, EMD Serono. Consulting Fees: Astra Zeneca. Honoraria: Curio, Dava. G.L.—none. E.M.—none. A.A.M.—none. A.I.M.—none. A.B.—none. A.M.—none. S.L.S.— none. L.B.—none. S.C.—none. D.E.—none. T.L.—none. L.V.V.—none. H.M.M.—Consulting fees: RefleXion. F.L.—none. L.G.—none. L.A.M.—none. R.J.C.—Advisory Board: NAKI Therapeutics. J.W.R.—Grants/Contracts: AstraZeneca, Boehringer Ingelheim, Merck, Novartis, Revolution Medicines, Spectrum. K.A.S.—Grants/Contracts: Navigate Biopharma, Tesaro/GSK, Moderna Inc., Takeda, Surface Oncology, Pierre-Fabre Research Institute, Merck, Bristol-Myers Squibb, AstraZeneca, Ribon Therapeutics, Eli Lilly, Boehringer-Ingelheim and Akoya Biosciences. Consulting Fees: Clinica Alemana Santiago, Shattuck Labs, AstraZeneca, EMD Serono, Takeda, Torque/Repertoire Therapeutics, Agenus, Genmab, OnCusp, Parthenon Therapeutics, Bristol-Myers Squibb, Roche, CDR life, Sensei Therapeutics, Molecular Templates and Merck. Honoraria: Takeda, Fluidigm, Merck, Brstil Myers Squibb, PeerView, Forefront collaborative. W.J.M.—Grants/Contracts: Merck. K.K.—Grants/Contracts: Genentech, BMS, Transgene. Advisory Board: Genentech. Other: IASLC. A.M.M., M.E.D., and K.K. received support from Genentech in the form of providing Atezolizumab for this clinical trial. Genentech stand to potentially benefit financially from this report. Genentech played no role in the conceptualization, design, data collection, analysis, decision to publish, or preparation of the paper.

Figures

Fig. 1
Fig. 1. Clinical outcomes.
A Schema of a clinical trial. B Overall survival of clinical trial patients from the date of enrollment estimated by the Kaplan–Meier method (n = 19). C Progression-free survival of clinical trial patients from the date of enrollment by the Kaplan–Meier method (n = 18). D Waterfall plot depicting the relative change in tumor volume following two cycles of neoadjuvant atezolizumab stratified by PD-L1 status, smoking status, and histology (n = 18). The bars at the top of the plot represent smoking status, histology, and PD-L1 tumor proportion score for each patient. E Axial fused PET/CT images from a patient with squamous cell carcinoma with marked response following two cycles induction atezolizumab. Pre-treatment tumor measuring 4.1 cm with SUVmax 24.9 is shown in the left panel, and a post-treatment tumor measuring 2.5 cm with SUVmax 17.2 is shown in the right panel. Source data are provided as a Source Data file.
Fig. 2
Fig. 2. Freedom from progression.
A Freedom from progression for the entire cohort from the date of enrollment by the Kaplan–Meier method (n = 18). B Freedom from progression stratified by a dose of atezolizumab administered (n = 18). Source data are provided as a Source Data file.
Fig. 3
Fig. 3. Multiplex immuno-fluorescence of the TME.
AD Staining of tissue sections for CD3 expression in the TME (n = 9). Nine patients with sufficient tissue for analysis were stained. This included two with the early response and seven without, four with progression, and five without. As outlined in the text, patients with early response did not progress, and thus the early response group is a subset of the non-progressor group. CD3 is stained in white, DAPI in blue, and cytokeratin in green. A Representative staining for CD3 expression in a patient with early response to atezolizumab (top panel) or no response to atezolizumab (bottom panel). B Bar graph representing the mean quantitative immuno-fluorescence of CD3 staining in responders and non-responders (p = 0.0004). C Representative staining for CD3 expression in a patient free from progression (top panel) or with disease progression (bottom panel). D Bar graph representing the mean quantitative immuno-fluorescence of CD3 staining in non-progressors and progressors. EJ Multiplex staining for CD3, Ki67, and granzyme b (GZB) expression (n = 9). CD3 is stained in white, Ki67 in yellow, GZB in red, DAPI in blue, and cytokeratin in green. E Representative multiplex staining in a patient with early response to atezolizumab (top panel) or no response to atezolizumab (bottom panel). F Bar graph representing the mean quantitative immuno-fluorescence of Ki67 staining in CD3+ cells in responders and non-responders (p = 0.0001). G Bar graph representing the mean quantitative immuno-fluorescence of GZB staining in CD3+ cells in responders and non-responders (p = 0.0002). H Representative multiplex staining for CD3, Ki67, and GZB expression in a patient free from progression (top panel) or with disease progression (bottom panel). I Bar graph representing the mean quantitative immuno-fluorescence of Ki67 staining in CD3+ cells in non-progressors and progressors (p = 0.0320). J Bar graph representing the mean quantitative immuno-fluorescence of GZB staining in CD3+ cells in non-progressors and progressors (p = 0.0159). Statistical comparisons between groups were performed with a two-sided t-test. The center line represents the mean, and the error bars represent the standard deviation of the mean. *p ≤ 0.05; ***p ≤ 0.001. Source data are provided as a Source Data file.
Fig. 4
Fig. 4. Changes in PBMCs during therapy.
A Changes in the frequency of PDL1 positive monocytes at baseline and after each of the first 3 cycles of atezolizumab (n = 19, 19, 17, 16 patients at baseline, C1–C3). The left panel is a box and whisker plot where each dot represents the value for an individual patient, the line represents the median, the box represents the interquartile range, and the whiskers represent the spread of the data. The overlayed line graph demonstrates the trend for the individual patients across cycles. The right panel is representative flow cytometry staining for an individual patient at baseline and after cycle 3, as well as the fluorescence minus one (FMO) negative gating control. B Changes in the frequency of PDL1 positive myeloid-derived suppressor cells (MDSC) at baseline and after each of the first 3 cycles of atezolizumab atezolizumab (n = 19, 19, 17, 16 patients at baseline, C1–C3). The left panel is a box and whisker plot representing the median, interquartile range, and data spread with an overlayed line graph demonstrating the trend for the individual patients across cycles. C Changes in the mean fluorescence intensity (MFI) of ICOS on PD1/Ki67 double positive memory CD8 T cells at baseline and after each of the first 3 cycles of atezolizumab atezolizumab (n = 14, 17, 13, 11 patients at baseline, C1–C3). The left panel is a box and whisker plot representing the median, interquartile range, and data spread with an overlayed line graph demonstrating the trend for the individual patients across cycles. Error bars represent the spread of the data. The right panel is a representative flow cytometry histogram for an individual patient at baseline and after cycle 3, as well as the corresponding FMO negative gating control. D Changes in the MFI of ICOS on PD1/Ki67 double positive CD4 T cells at baseline and after each of the first 3 cycles of atezolizumab (n = 18, 18, 16, 14 patients at baseline, C1–C3). The left panel is a box and whisker plot representing the median, interquartile range, and data spread with an overlayed line graph demonstrating the trend for the individual patients across cycles. Statistical comparisons across the course of therapy were performed by ANOVA. Source data are provided as a Source Data file.
Fig. 5
Fig. 5. Baseline PBMC transcriptomic differences in progressors versus non-progressors.
Transcriptomic analysis was performed on eight samples with sufficient tissue for analysis (non-progressor, NP: n = 5, progressor, P: n = 3). A Heat map demonstrating expression of genes from the BIOCARTA T cell receptor signaling gene set with clustering analysis separating progressors from non-progressors. B Principal components analysis (PCA) demonstrates the separation of progressors from non-progressors based on the expression of 12 genes. C Whisker plots depicting the expression of individual genes from the BIOCARTA T cell receptor signaling gene set with significant differential expression at baseline. The whisker plot represents the mean and 95% confidence interval. The points represent individual patient values. P values are from a two-sided t-test. Source data are provided as a Source Data file.
Fig. 6
Fig. 6. Differences in CD8+ T cell functionality in progressors versus non-progressors.
A Box and whisker plots demonstrating differences in the frequency of circulating CD8+ T cells between progressors (P, n = 4 patients) and non-progressors (NP, n = 12 patients) at baseline. The panel below depicts representative flow staining for CD4+ T cells and CD8+ T cells on CD3+ gated lymphocytes in NP (left panel) and P (right panel). B ROC curve evaluating the ability to classify P vs. NP based on baseline levels of circulating CD8+ T cells. C Box and whisker plots demonstrating differences in the frequency of circulating CD8+ PD1+ T cells in P vs. NP at baseline (n = 16). D Representative flow staining for PD1 on CD8+ gated T cells in FMO negative control (top), NP (bottom left), and P (bottom right). E ROC curve evaluating the ability to classify P vs. NP based on baseline levels of circulating CD8+ PD1+ T cells. F Box and whisker plots demonstrating differences in the frequency of circulating CD8+Tim3+ T cells in P vs. NP at baseline (n = 16). G Representative flow staining for Tim3 on CD8+ gated T cells in FMO negative control (top), NP (bottom left), and P (bottom right). H ROC curve evaluating the ability to classify P vs. NP based on baseline levels of circulating CD8+ Tim3+ T cells. I Schema of ex-vivo T cell stimulation assay. Box plots and line graphs (left depicting the frequency of interferon-gamma (J, K, N, O) and TNF-α (L, M, P, Q) after ex-vivo PMA/ionomycin stimulation on PD1- (JM) and PD1+ (NQ) CD8+ T cells collected at baseline or after 1 cycle of ICI (n = 8 per timepoint; NP, n = 5; P, n = 3). For box and whisker plots, each dot represents the value for an individual patient, the line represents the median, the box represents the interquartile range, and the whiskers represent the spread of the data. For line graphs, dots represent the mean, and error bars represent the standard deviation. Patients free from progression are represented in blue, and patients who progressed are represented in red. P values are from a two-sided t-test, * = p < 0.05. Source data are provided as a Source Data file.

References

    1. West H, et al. Atezolizumab in combination with carboplatin plus nab-paclitaxel chemotherapy compared with chemotherapy alone as first-line treatment for metastatic non-squamous non-small-cell lung cancer (IMpower130): a multicentre, randomised, open-label, phase 3 trial. Lancet Oncol. 2019;20:924–937. doi: 10.1016/S1470-2045(19)30167-6. - DOI - PubMed
    1. von Pawel J, et al. Long-term survival in patients with advanced non-small-cell lung cancer treated with atezolizumab versus docetaxel: results from the randomised phase III OAK study. Eur. J. Cancer. 2019;107:124–132. doi: 10.1016/j.ejca.2018.11.020. - DOI - PubMed
    1. Antonia Scott J, et al. Overall survival with durvalumab after chemoradiotherapy in stage III NSCLC. N. Engl. J. Med. 2018;379:2342–2350. doi: 10.1056/NEJMoa1809697. - DOI - PubMed
    1. Antonia, S. J. et al. Durvalumab after chemoradiotherapy in stage III non-small-cell lung cancer. N. Engl. J. Med.10.1056/NEJMoa1709937 (2017). - PubMed
    1. Felip E, et al. Adjuvant atezolizumab after adjuvant chemotherapy in resected stage IB-IIIA non-small-cell lung cancer (IMpower010): a randomised, multicentre, open-label, phase 3 trial. Lancet. 2021;398:1344–1357. doi: 10.1016/S0140-6736(21)02098-5. - DOI - PubMed

Publication types

MeSH terms