. 2023 Sep 1;14(1):5325.
doi: 10.1038/s41467-023-41167-z.

Acquired miR-142 deficit in leukemic stem cells suffices to drive chronic myeloid leukemia into blast crisis

Affiliations

Acquired miR-142 deficit in leukemic stem cells suffices to drive chronic myeloid leukemia into blast crisis

Bin Zhang et al. Nat Commun. .

Abstract

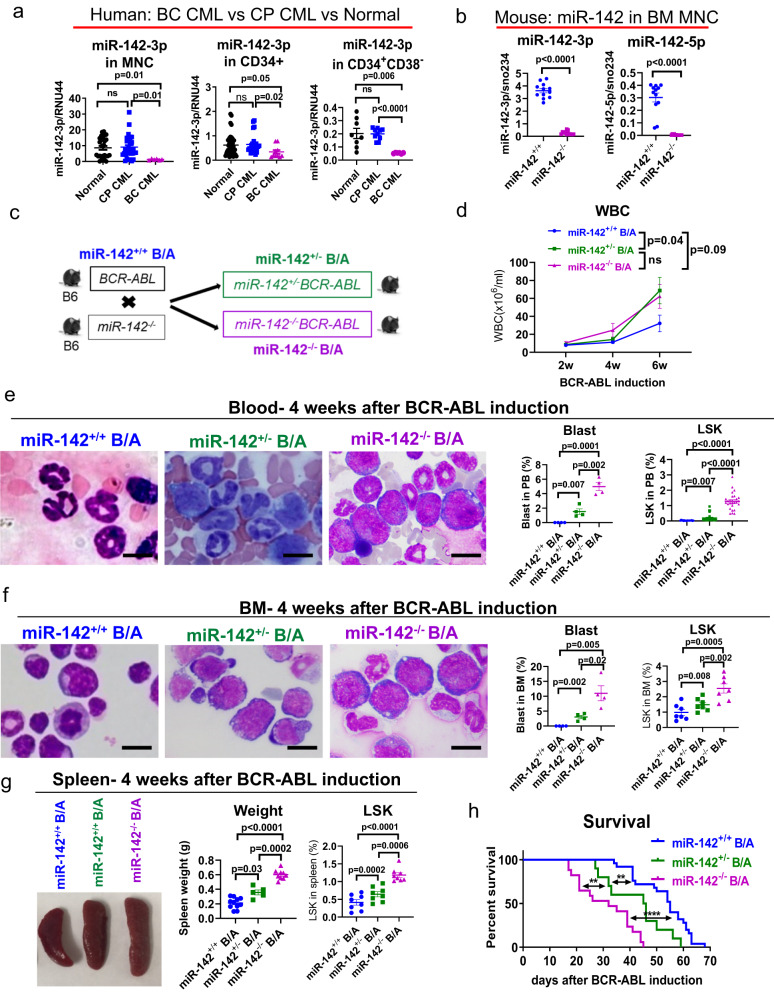
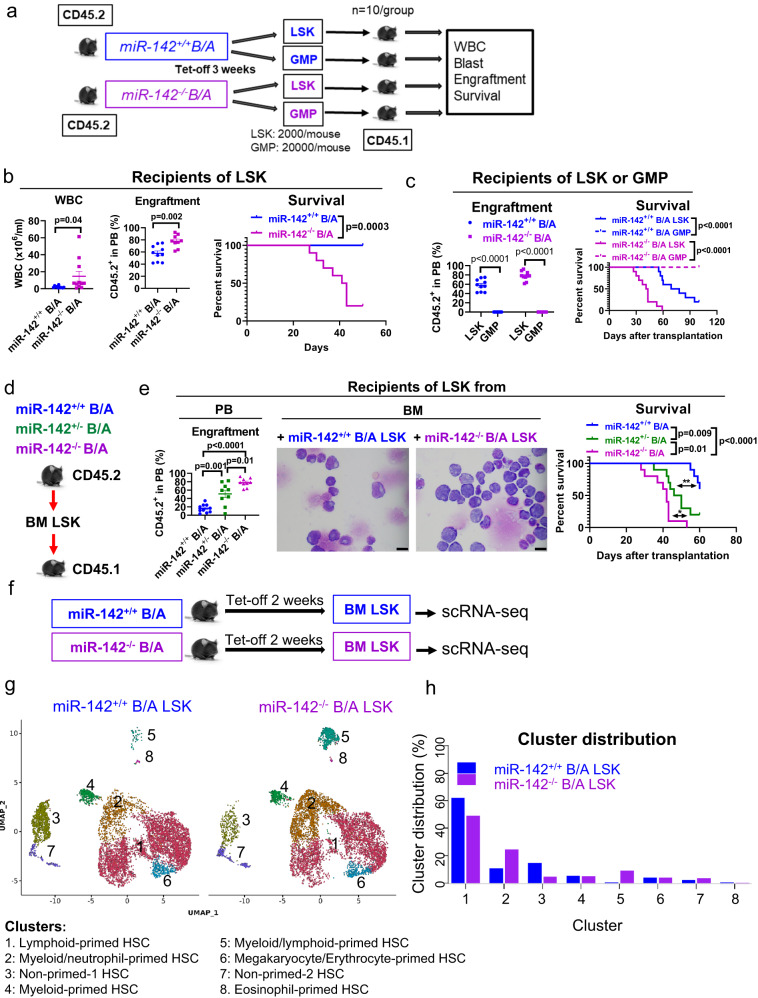
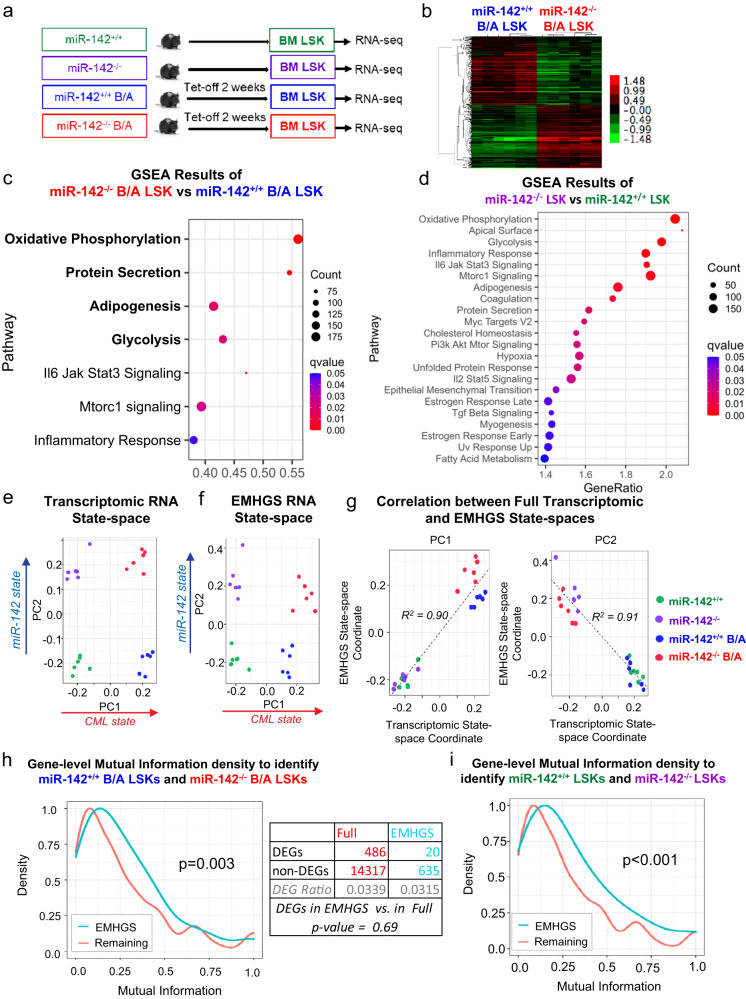
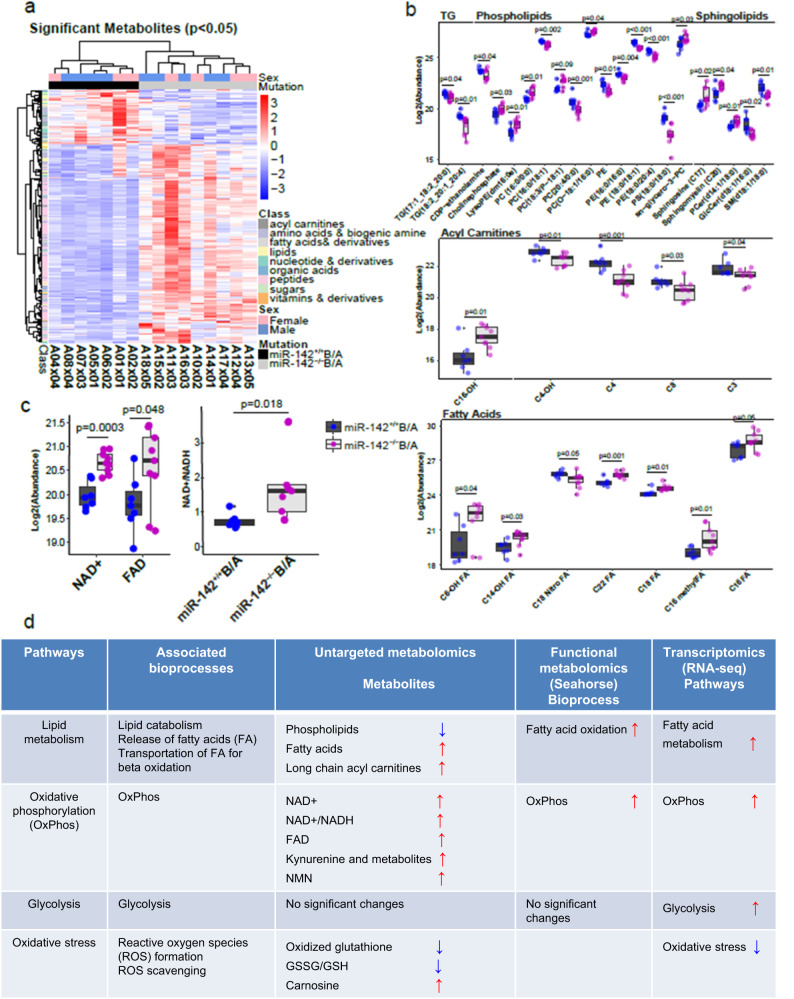
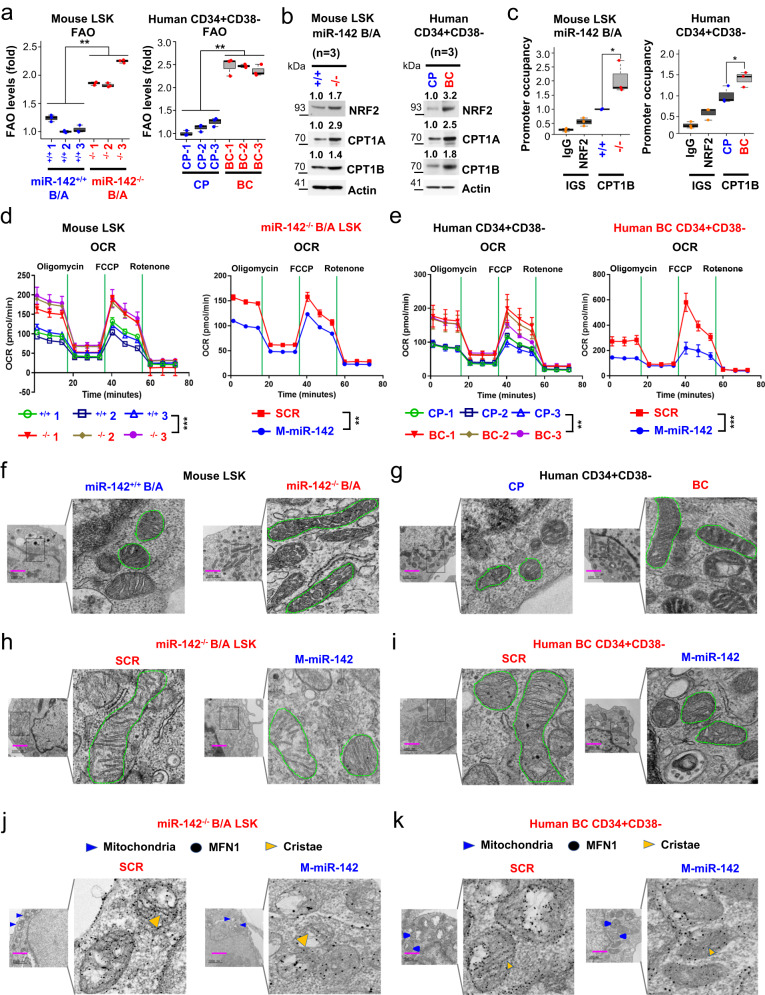
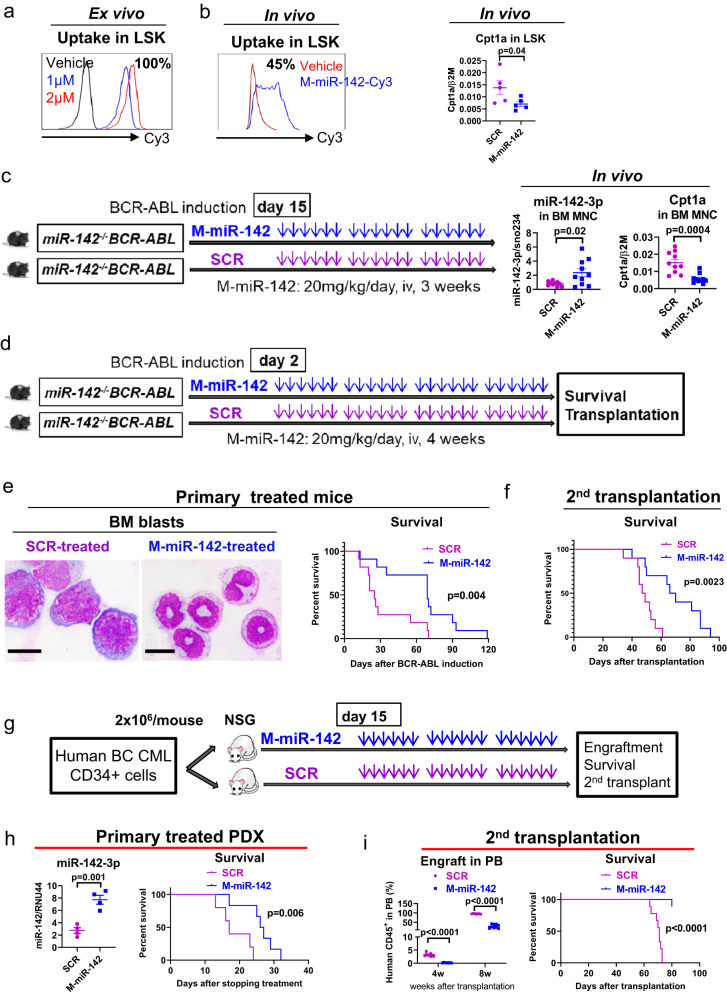
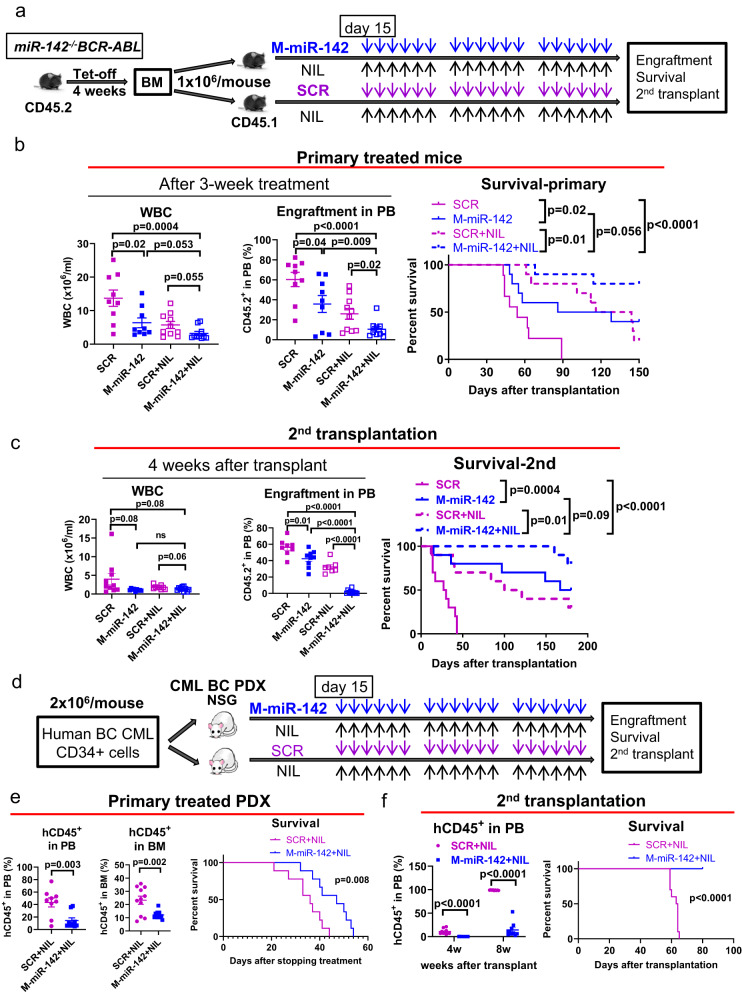
The mechanisms underlying the transformation of chronic myeloid leukemia (CML) from chronic phase (CP) to blast crisis (BC) are not fully elucidated. Here, we show lower levels of miR-142 in CD34+CD38- blasts from BC CML patients than in those from CP CML patients, suggesting that miR-142 deficit is implicated in BC evolution. Thus, we create miR-142 knockout CML (i.e., miR-142-/-BCR-ABL) mice, which develop BC and die sooner than miR-142 wt CML (i.e., miR-142+/+BCR-ABL) mice, which instead remain in CP CML. Leukemic stem cells (LSCs) from miR-142-/-BCR-ABL mice recapitulate the BC phenotype in congenic recipients, supporting LSC transformation by miR-142 deficit. State-transition and mutual information analyses of "bulk" and single cell RNA-seq data, metabolomic profiling and functional metabolic assays identify enhanced fatty acid β-oxidation, oxidative phosphorylation and mitochondrial fusion in LSCs as key steps in miR-142-driven BC evolution. A synthetic CpG-miR-142 mimic oligodeoxynucleotide rescues the BC phenotype in miR-142-/-BCR-ABL mice and patient-derived xenografts.


Conflict of interest statement

The authors declare no competing interests.

Figures

Fig. 1
Fig. 1. miR-142 deficit induces BC-like transformation in the CP CML mouse.
a MiR-142 levels in bone marrow (BM) mononuclear cells (MNCs), CD34+ hematopoietic stem and progenitor cells (HSPCs), or CD34+CD38 hematopoietic stem cells (HSCs) from healthy individuals (normal; n = 14 biologically independent samples for MNCs and n = 8 for CD34+ and CD34+CD38), chronic phase (CP) CML patients (n = 17 biologically independent samples for MNCs and n = 10 for CD34+ and CD34+CD38), or blast crisis (BC) CML patients (n = 6 biologically independent samples for all three cell populations), analyzed by Q-RT-PCR. b MiR-142 levels in BM MNCs from miR-142−/− and miR-142+/+ mice (n = 12 each), analyzed by Q-RT-PCR. c Schematic design of the mouse crossings. Upon tetracycline withdrawal to induce BCR-ABL expression, miR-142−/−BCR-ABL, miR-142+/−BCR-ABL and miR-142+/+BCR-ABL mice were monitored for d white blood cell (WBC) counts (n = 20, 13 and 15 mice respectively) every two weeks, e blood (n = 4 mice per strain for blasts and n = 18 mice per strain for LSK) and f BM leukemic blasts (n = 4 mice per strain for blasts and n = 7 mice per strain for LSK) assessed by microscopy (left, scale bar: 10 µM) and LinSca-1+c-Kit+ (LSKs) by flow cytometry (right), g spleen size and weight (left) and LSKs by flow cytometry (right) four weeks post BCR-ABL induction (n = 8 mice per strain). h Survival of miR-142−/−BCR-ABL (n = 17), miR−142+/−BCR-ABL (n = 10) and miR-142+/+BCR-ABL (n = 25) mice after BCR-ABL induction (Log-rank test, miR−142/−BCR-ABL vs miR-142+/−BCR-ABL: p = 0.004; miR-142+/−BCR-ABL vs miR-142+/+BCR-ABL: p = 0.007; miR-142−/−BCR-ABL vs miR-142+/+BCR-ABL: p < 0.0001). For ah, source data are provided as a Source Data file. For e and f, results from one of the three independent experiments are shown (n = 3). Abbreviation: miR-142+/+B/A: miR-142+/+BCR-ABL; miR-142−/−B/A: miR-142−/−BCR-ABL; CP: chronic phase; BC: blast crisis. Comparison between groups was performed by two-tailed, unpaired t-test. Results shown represent mean ± standard error of the mean (SEM). Significance values: **p < 0.01; ****p < 0.0001; ns, not significant.
Fig. 2
Fig. 2. Identification and single cell gene expression profiles of BC-LSCs vs CP-LSCs.
a–c Schematic design and results of the experiment. a LSK (2000/mouse, n = 10 mice per group) and GMP (20,000/mouse, n = 10 mice per group) populations from CD45.2 miR-142−/−BCR-ABL and miR-142+/+BCR-ABL mice (BCR-ABL were induced for 3 weeks) were transplanted into congenic CD45.1 wt recipients. b White blood cell (WBC) counts (p = 0.04), peripheral blood (PB) engraftment rates (CD45.2+, p = 0.002) by flow cytometry measured at four weeks after transplantation, and survival (Log-rank test, p = 0.001) of recipients transplanted with LSKs from miR-142−/−BCR-ABL or miR-142+/+BCR-ABL mice (n = 10 mice per strain) are shown. c PB engraftment rates (CD45.2+, p < 0.0001) at four weeks post transplantation and survival (Log-rank test, p < 0.0001) of recipients transplanted with LSKs or GMPs from miR-142+/+BCR-ABL and miR-142−/−BCR-ABL mice (n = 10 per group) are shown. d, e Schematic design and results of the experiment. d LSKs from CD45.2 miR-142−/−BCR-ABL, miR-142+/−BCR-ABL and miR-142+/+BCR-ABL mice (BCR-ABL were induced for 3 weeks) were transplanted into congenic CD45.1 wt recipients. e PB engraftment rates at 4 weeks post transplantation, BM blasts assessed by microscopy (scale bar: 10 µM), and survival of these recipient mice are shown (n = 10 mice per group; Log-rank test, miR-142−/−B/A vs miR-142+/−B/A: p = 0.01; miR-142+/−B/A vs miR-142+/+B/A: p = 0.009; miR-142−/−B/A vs miR-142+/+B/A: p < 0.0001). For b, c, e, h, source data are provided as a Source Data file. For e, results from one of the three independent experiments are shown (n = 3). For b, c, e, comparison between groups was performed by two-tailed, unpaired t-test. Results shown represent mean ± SEM. Significance values: *p < 0.05; **p < 0.01. f–h Schematic design and results of the experiment. f BM LSK cells from miR-142−/−BCR-ABL and miR-142+/+BCR-ABL mice (BCR-ABL were induced for two weeks) were sorted for scRNA-seq. g LSK clusters and h cluster cell distribution are shown. B/A BCR-ABL, tet-off tetracycline withdrawal, GMP granulocyte-macrophage progenitors, PB peripheral blood, BM bone marrow, scRNA-seq single cell RNA sequencing, SEM standard error of the mean.
Fig. 3
Fig. 3. State-transition of CP-LSCs to BC-LSCs is characterized by changes in the expression of genes involved in the bioenergetic oxidative metabolism.
a Experimental design. BM LSKs from miR-142+/+ (wt), miR-142−/− (miR-142 KO), miR-142+/+BCR-ABL (CP CML) and miR-142−/−BCR-ABL (BC CML) mice (2 weeks after Tet-off and BCR-ABL induction) were sorted for RNA-seq. b 506 differentially expressed genes, 211 upregulated and 295 downregulated, were identified in miR-142−/−/BCR-ABL LSKs vs miR-142+/+/BCR-ABL LSKs. c, d The upregulated gene sets by GSEA using Hallmark gene sets in c miR-142−/−BCR-ABL LSKs vs miR-142+/+BCR-ABL LSKs and d miR-142−/− LSKs vs miR-142+/+ LSKs. For GSEA, see methods for details. e Using singular value decomposition (SVD) on the whole transcriptome, a state-space was constructed that separates the four experimental conditions. PC1 separated CML from non-CML samples, whereas PC2 separated miR-142 KO from wt samples. f By performing SVD on the 655 genes of the EMHGS, the EMHGS state-space was constructed and found to be highly similar to the whole transcriptome state-space. g Plotting the whole transcriptome and EMHGS state-space coordinates for both PC1 and PC2 confirmed that the state-spaces were similar (R2 = 0.90 and R2 = 0.91 respectively). h The density of mutual information (MI) of the EMHGS genes vs the remaining transcriptome (whole transcriptome minus EMHGS) was determined by calculating the MI for each gene using the miR-142+/+BCR-ABL LSK (CP-LSK) and miR-142−/−BCR-ABL LSK (BC-LSK) samples. The one-sided Wilcoxon rank sum test was used to determine that the EMHGS had higher MI density (MI distribution shifted toward higher values) compared to the remaining transcriptome (p = 0.003). The table compared the number of BC-LSK vs CP-LSK differentially expressed genes (DEGs) found in the “remaining” transcriptome (full transcriptome minus the EMHGS genes) with the number of DEGs found in the EMHGS. DEGs contained in the EMHGS showed no significant difference compared to the DEGs contained in the “remaining” transcriptome (hypergeometric p-value = 0.69). i The MI density of the EMHGS genes vs the remaining transcriptome (whole transcriptome minus EMHGS) was determined by calculating the MI for each gene using the miR-142+/+ LSK (WT) and miR-142−/− LSK (KO) samples (one-sided Wilcoxon rank sum test, p < 0.001). For ei, source data are provided as a Source Data file.
Fig. 4
Fig. 4. Metabolomic differences between CP-LSCs and BC-LSCs.
a Hierarchical unsupervised clustering represents 301 differently abundant (p < 0.05) metabolites (acyl carnitines, fatty acids, fatty alcohols, lipids, amino acids and biogenic amines, nucleotides and derivatives, organic acids and sugars) in BM Lin-c-Kit+ cells isolated from miR-142−/−BCR-ABL and miR-142+/+BCR-ABL mice (BCR-ABL were induced for 4 weeks by tetracycline withdrawal). Comparison between groups was performed by two-tailed, paired Student’s t-test. b Box and Whisker plots depicting relative log2 abundances of significantly different complex lipids including triglycerides (TG), phospholipids and sphingolipids, fatty acyl carnitines and free fatty acids in miR-142−/−BCR-ABL (n = 9 biologically independent samples) vs miR-142+/+BCR-ABL (n = 7 biologically independent samples) Lin-c-Kit+ cells. Individual p-values for all 33 metabolites are available in Supplementary Data 2. c Box and Whisker plots showing the log2 relative abundances of NAD+ (complex I product) (p = 0.00025), FAD (complex II product, p = 0.048), and the NAD+/NADH ratio (Complex I product/substrate ratio, p = 0.018) in miR-142−/−BCR-ABL (n = 9 biologically independent samples) vs miR-142+/+BCR-ABL (n = 7 biologically independent samples) Lin-c-Kit+ cells. For b, c, a two-sided Student’s t-test was used to compare KO versus WT cells. Data presented in boxplots show the median as represented by the center line, with the range of the box from the 25th percentile to the 75th percentile, and whisker lines stretching to 1.5× the IQR below the 25th percentile and 1.5× the IQR above the 75th percentile. Any points in the boxplot not represented within these ranges (above 1.5× the 75th percentile or below 1.5× the 25th percentile) are represented as individual black points. All individual data points are overlayed on the boxplots for miR-142+/+ (blue) and miR-142−/− (purple) cells. For b, c, source data are provided as a Source Data file. d Table describing significant changes observed in metabolic pathways and biochemical processes upon comparing miR-142−/−BCR-ABL with miR-142+/+BCR-ABL cells using untargeted metabolomic analysis (Lin-c-Kit+ cells), functional seahorse analysis (LSK), and transcriptomic analysis (LSK).
Fig. 5
Fig. 5. Effects of miR-142 expression on mitochondrial morphology and metabolism in leukemic stem cells.
a–c LSKs and CD34+CD38 cells were respectively isolated from miR-142+/+BCR-ABL vs miR-142−/−BCR-ABL mice (left) or from human CP vs BC CML patients (right). a Levels of FAO (left, p = 0.0048; right, p = 0.0023). b Immunoblotting of NRF2, CPT1A and CPT1B protein. Three samples of each group were pooled for the assay (n = 3 biologically independent samples). Densitometry quantifications (fold) are shown on the top. Source data are provided as a Source Data file. c ChIP assay to measure NRF2 binding to CPT1B promoter levels (left, p = 0.016; right, p = 0.0307). Box plot with median value and first/third quartiles and whiskers together with minimum and maximum values are shown (n = 3 biologically independent samples). d, e Levels of OxPhos (as indicated by OCR levels in Seahorse assay) in d LSKs from miR-142+/+BCR-ABL vs miR-142−/−BCR-ABL mice (d, left) or e CD34+CD38 cells from human CP vs BC CML patients (e, left). Mouse miR-142−/−BCR-ABL LSKs (d, right, n = 3 biologically independent samples) or human CD34+CD38 BC CML cells (e, right, n = 3 biologically independent samples) were treated with SCR control or CpG-M-miR-142 (2 µM) for 24 h (d: left, p = 0.0008; right, p = 0.0014; e: left, p = 0.0054; right, p = 0.0009). For ae, results from one of the three independent experiments are shown (n = 3). Comparison between groups was performed by one-tailed, unpaired t-test. Results shown represent mean ± SD. Significance values: *p < 0.05; **p < 0.01; ***p < 0.001; ****p < 0.0001; ns, not significant. Effects of miR-142 expression on mitochondria fusion in LSCs. Evidence of mitochondria fusion in f LSKs from miR-142+/+BCR-ABL vs miR-142−/−BCR-ABL mice and g CD34+CD38 cells from human CP vs BC CML patients. hk Effects of correction of miR-142 deficit on mitochondria fusion. Indicated cells were treated with SCR control or CpG-M-miR-142 (500 nm) for 24 h. h, i Mitochondria morphology was shown by electron microscope. j, k Levels of MFN1 protein expression (black dots) inside mitochondria and effect of CpG-M-miR-142 visualized by immunolabeling-electron microscope. For a–e, source data are provided as a Source Data file. For f–k, scale bar, 1000 nm, results from one of the three independent experiments are shown (n = 3). miR-142+/+B/A miR-142+/+BCR-ABL, miR-142−/−B/A miR-142−/−BCR-ABL, CP chronic phase, BC blast crisis, FAO fatty acid oxidation, ChIP chromatin immunoprecipitation, OCR oxidative consumption rate, M-miR-142 CpG-M-miR-142, SD standard deviation.
Fig. 6
Fig. 6. In vivo delivery of miR-142 mimic reduced BC CML burden in GEMMs and PDXs.
In vivo a Ex vivo uptake of Cy3-labeled CpG-M-miR-142 in LSK cells by flow cytometry. b In vivo uptake of Cy3-labeled CpG-M-miR-142 by flow cytometry and mRNA expression of the miR-142 target Cpt1a by Q-RT-PCR in LSKs from normal mice treated with a single dose of Cy3-labeled CpG-M-miR-142 (20 mg/kg) (n = 5 biologically independent samples per group). c MiR-142−/−BCR-ABL CML mice (BCR-ABL were induced for two weeks by tet-off) were treated with CpG-M-miR-142 or SCR (20 mg/kg/day, IV) for 3 weeks, then levels of miR-142 and its target Cpt1a in BM MNCs from these treated mice were measured by Q-RT-PCR (n = 10 biologically independent samples per group). d Experimental design. To determine the impact of in vivo rescuing of miR-142 deficit on the BC transformation rate, a cohort of miR-142−/−BCR-ABL mice were treated with CpG-M-miR-142 (20 mg/kg/day, iv) or SCR for 4 weeks, starting on the day after tet-off induced BCR-ABL induction. e At treatment completion, white blood cell (WBC) counts, circulating LSKs by flow cytometry, BM blasts by microscopy (scale bar: 10 µM), and survival of the CpG-M-miR-142-treated vs SCR-treated mice are shown. f To assess the impact of CpG-M-miR-142 treatment on the LSC burden, 106 BM cells from the above CpG-M-miR-142- or SCR-treated mice (CD45.2) were transplanted into secondary (2nd) recipient mice (CD45.1). WBC counts, engraftment (CD45.2+) rates, and survival of the 2nd recipients are shown. g Experimental design. BC CML patient-derived xenograft (PDX) mice were generated by transplanting 2 × 10⁶ CD34+ cells from BC CML patients into NSG mice. Upon detecting engraftment (>5% blood human CD45+ cells) at two weeks post transplantation, these mice were treated with CpG-M-miR-142 (20 mg/kg/day, iv) or SCR for 3 weeks. h BM miR-142 levels (n = 4 biologically independent samples per group) and survival of these treated mice (n = 6 mice per group) are shown. i BM cells from these treated mice were transplanted into 2nd NSG recipient mice (106/mouse) and PB engraftment (human CD45+) rates and survival of the 2nd recipient mice (n = 9 mice per group) are shown. For b, c, e, f and h, i, source data are provided as a Source Data file. For a, b, e, results from one of the three independent experiments are shown (n = 3). Comparison between groups was performed by two-tailed, unpaired t-test. Survival curve was compared by Log-rank test. Results shown represent mean ± SEM.
Fig. 7
Fig. 7. CpG-M-miR-142 sensitizes BC CML to TKIs.
a–c Experimental design and results. a A cohort of BC CML mice were generated by transplanting 106 BM MNCs from diseased miR-142−/−BCR-ABL mice (CD45.2) into congenic wt recipient mice (CD45.1). At 2 weeks post transplantation, these mice were treated with CpG-M-miR-142 (20 mg/kg/day, IV), NIL (50 mg/kg/day, gavage), CpG-M-miR-142 + NIL, or SCR + NIL for 3 weeks. b WBC counts, PB engraftment rates, and survival (n = 10 mice per group). c WBC counts, PB engraftment rates, and survival of the 2nd recipient mice transplanted with BM MNCs from the treated donors (n = 10 mice per group). d–f Experimental design and results. d BC CML PDX mice were generated by transplanting 2 × 10⁶ CD34+ cells from BC CML patients into NSG mice. Upon detecting >5% human CD45+ cell engraftment in PB, these PDX mice were treated with CpG-M-miR-142 (20 mg/kg/day, iv) + NIL (50 mg/kg/day, oral garage) or SCR + NIL for 3 weeks. e PB and BM engraftment rates and survival (n = 10 mice per group). f PB engraftment rates and survival of the 2nd recipients transplanted with BM MNCs from the treated donors (n = 10 mice per group). For b, c and e, f, source data are provided as a Source Data file. M-miR-142 CpG-M-miR-142, NIL Nilotinib, SCR CpG-scramble miRNA control, WBC white blood cell, PB peripheral blood. Comparison between groups was performed by two-tailed, unpaired t-test. Survival curves were compared by Log-rank test. Results shown represent mean ± SEM.

References

    1. Cortes J, Pavlovsky C, Saussele S. Chronic myeloid leukaemia. Lancet. 2021;398:1914–1926. - PubMed
    1. Copland, M. Treatment of blast phase chronic myeloid leukaemia: a rare and challenging entity. Br. J. Haematol.199, 665–678 (2022). - PMC - PubMed
    1. Mojtahedi H, Yazdanpanah N, Rezaei N. Chronic myeloid leukemia stem cells: targeting therapeutic implications. Stem Cell Res. Ther. 2021;12:603. - PMC - PubMed
    1. Houshmand M, et al. Chronic myeloid leukemia stem cells. Leukemia. 2019;33:1543–1556. - PMC - PubMed
    1. Vetrie D, Helgason GV, Copland M. The leukaemia stem cell: similarities, differences and clinical prospects in CML and AML. Nat. Rev. Cancer. 2020;20:158–173. - PubMed

Publication types