Comparative Study
. 2024 Jan;31(1):173-189.
doi: 10.1007/s43032-023-01334-5. Epub 2023 Sep 1.

Comparison of Four Protocols for In Vitro Differentiation of Human Embryonic Stem Cells into Trophoblast Lineages by BMP4 and Dual Inhibition of Activin/Nodal and FGF2 Signaling

Affiliations
Comparative Study

Comparison of Four Protocols for In Vitro Differentiation of Human Embryonic Stem Cells into Trophoblast Lineages by BMP4 and Dual Inhibition of Activin/Nodal and FGF2 Signaling

Zahra Anvar et al. Reprod Sci. 2024 Jan.

Abstract

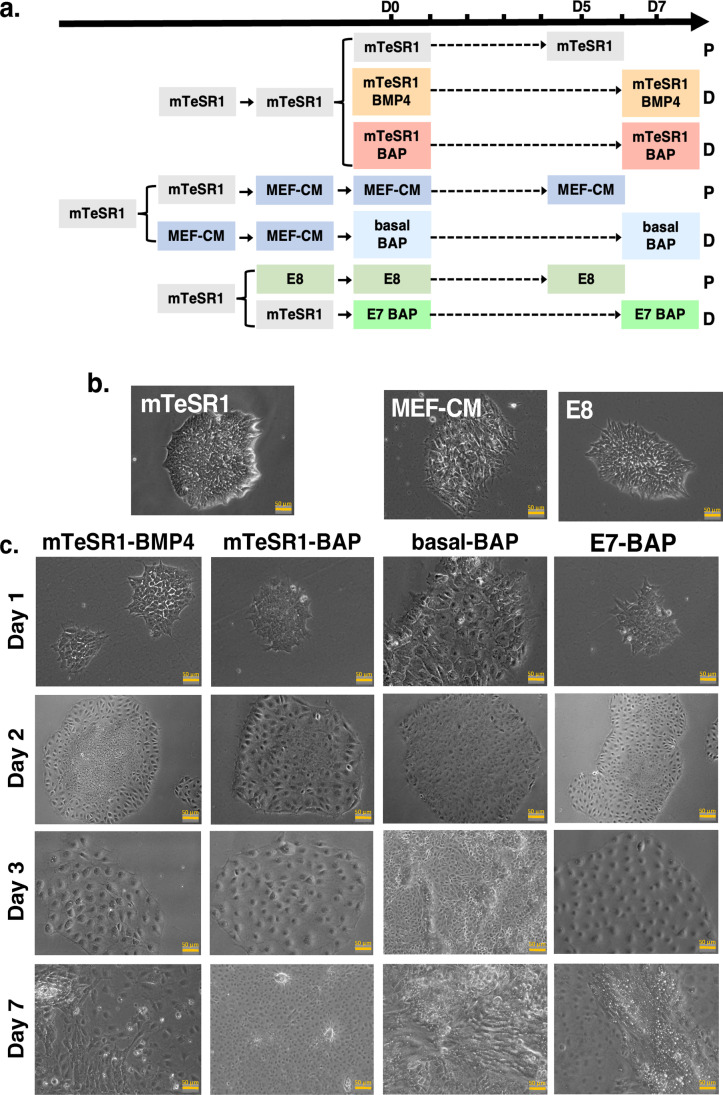
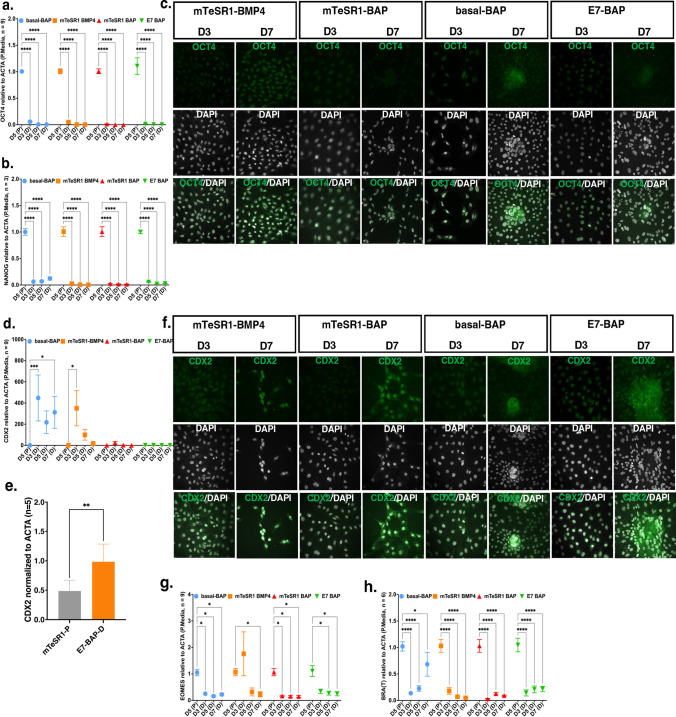
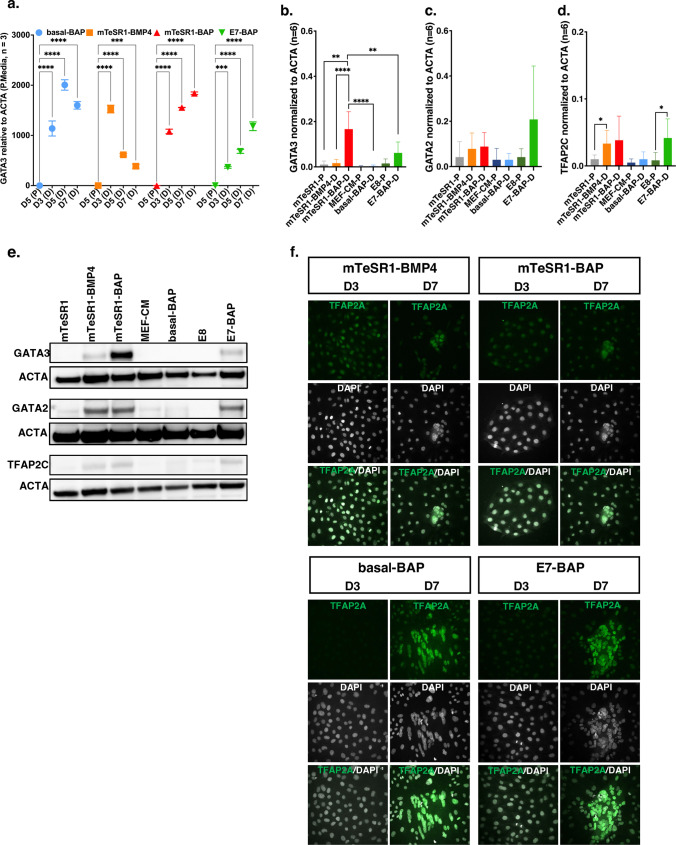
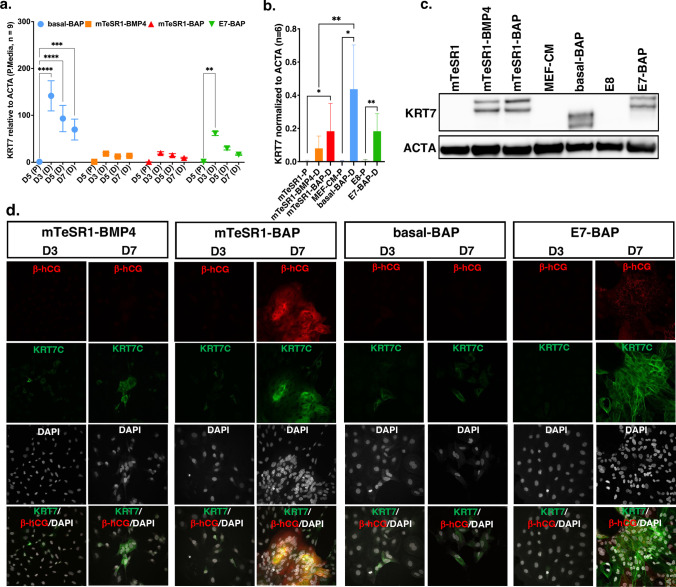
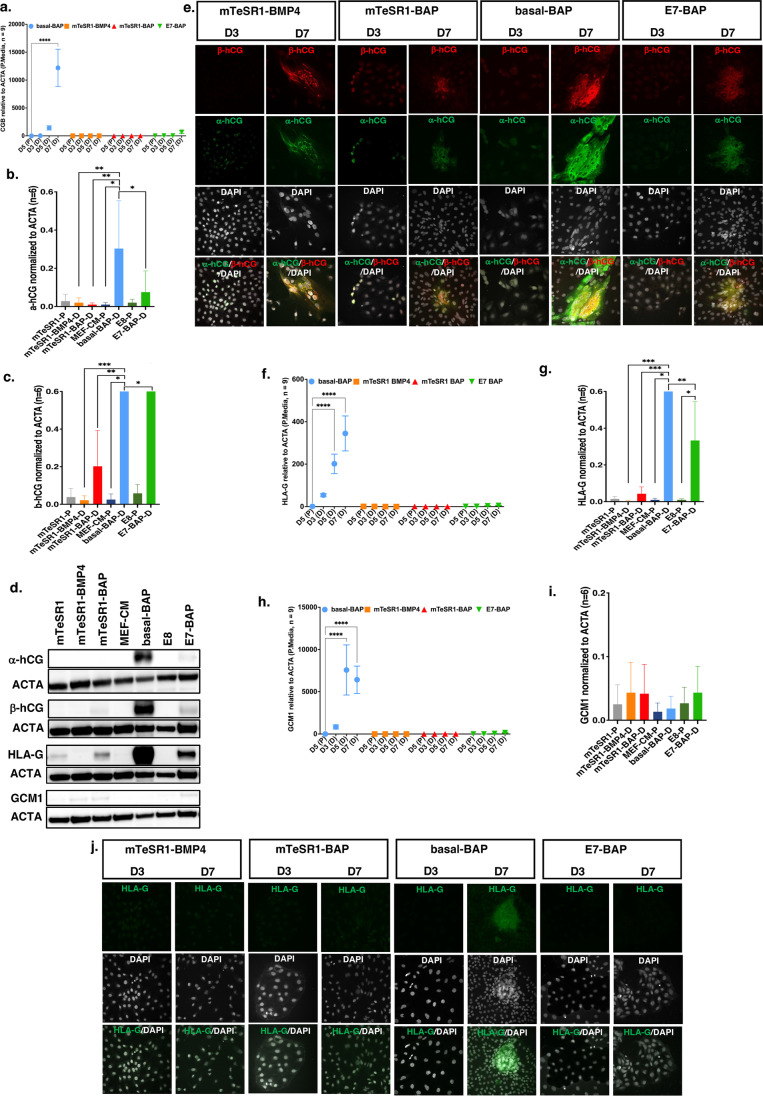
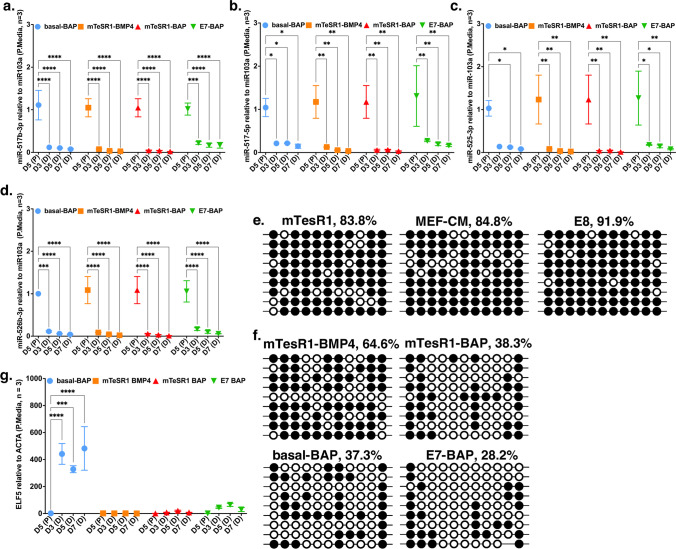
Human embryonic stem cells (hESCs) cultured in media containing bone morphogenic protein 4 (BMP4; B) differentiate into trophoblast-like cells. Supplementing media with inhibitors of activin/nodal signaling (A83-01) and of fibroblast growth factor 2 (PD173074) suppresses mesoderm and endoderm formation and improves specification of trophoblast-like lineages, but with variable effectiveness. We compared differentiation in four BMP4-containing media: mTeSR1-BMP4 only, mTeSR1-BAP, basal medium with BAP (basal-BAP), and a newly defined medium, E7-BAP. These media variably drive early differentiation towards trophoblast-like lineages with upregulation of early trophoblast markers CDX2 and KRT7 and downregulation of pluripotency markers (OCT4 and NANOG). As expected, based on differences between media in FGF2 and its inhibitors, downregulation of mesendoderm marker EOMES was variable between media. By day 7, only hESCs grown in E7-BAP or basal-BAP expressed HLA-G protein, indicating the presence of cells with extravillous trophoblast characteristics. Expression of HLA-G and other differentiation markers (hCG, KRT7, and GCM1) was highest in basal-BAP, suggesting a faster differentiation in this medium, but those cultures were more inhomogeneous and still expressed some endodermal and pluripotency markers. In E7-BAP, HLA-G expression increased later and was lower. There was also a low but maintained expression of some C19MC miRNAs, with more CpG hypomethylation of the ELF5 promoter, suggesting that E7-BAP cultures differentiate slower along the trophoblast lineage. We conclude that while all protocols drive differentiation into trophoblast lineages with varying efficiency, they have advantages and disadvantages that must be considered when selecting a protocol for specific experiments.

Keywords: Differentiation; Human embryonic stem cells; Syncytiotrophoblast, extravillous trophoblast; Trophoblast lineage.


Conflict of interest statement

The authors declare no competing interests.

Figures

Fig. 1
Fig. 1
Human embryonic stem cell (hESC) differentiation protocols and colony morphology. a Schematic of culture conditions and timeline of the differentiation protocol. The pluripotency media (P), mTeSR1, MEF-CM, and E8, are color-coded to match the related differentiation media (D), mTeSR1-BMP4, mTeSR1-BAP, basal-BAP, and E7-BAP. The bar on top shows the timeline in days (D0-D7). b Phase contrast images of colony morphology of hESCs cultured in pluripotency media. c Phase contrast images of hESC colony morphology of cells cultured in differentiation media from day 1 to day 7. Scale bars on images are 50 μm
Fig. 2
Fig. 2
Transcript levels for OCT4, NANOG, CDX2, Brachyury (T), and EOMES and Immunofluorescence (IF) staining for OCT4 and CDX2 and western blot quantification of protein levels for CDX2. a, b, d, g, h Graphs of relative transcript levels of OCT4 (a), NANOG (b), CDX2 (d), EOMES (g), and Brachyury (T) (h) assayed by qRT-PCR and quantified using ΔΔCt normalized to ACTA in differentiation media (D) compared to the corresponding pluripotency media (P). D5, D3, D5, and D7 on the X-axis represent days in culture in each differentiation medium and matching pluripotency medium. Relative transcript levels and the number of replicates for each gene are on the Y-axis. Data are presented as mean ± standard error of the mean (SEM); *p < 0.05, **p < 0.01, ***p < 0.001, ****p < 0.0001. c, f Images of cultured cells stained on day 3 (D3) and day 7 (D7) for markers OCT4 (c) and CDX2 (f) (left images) and for each marker co-stained with nuclear marker DAPI (right images) in differentiation media. Each IF staining was performed in triplicate from two independent rounds of differentiation. e Western blot quantification of protein levels of CDX2. Lysates were collected on day 7 from cells cultured in E7-BAP and on day 5 from cells cultured in mTeSR1 as the pluripotent media; the Graph shows the relative protein levels assayed by densitometry normalized to ACTA (Y-axis). Number of replicates is shown on Y-axis (n = 5), **p < 0.01
Fig. 3
Fig. 3
Transcript levels for GATA3, western blot quantification of protein levels for GATA3, GATA2, and TFAP2C and Immunofluorescence (IF) staining for TFAP2A. a Relative transcript levels of GATA3 assayed by qRT-PCR and quantified using ΔΔCt normalized to ACTA in differentiation media (D) compared to the corresponding pluripotency media (P). D5, D3, D5, and D7 on the X-axis represent days in culture in each differentiation medium and matching pluripotency medium. Relative transcript levels and number of replicates are on the Y-axis. Data are presented as mean ± standard error of the mean (SEM); ***p < 0.001, ****p < 0.0001. b–d Western blot quantification of protein levels of GATA3, GATA2 and TFAP2C and corresponding western blot image (e). Lysates were collected on day 7 from cells cultured in differentiation media and on day 5 from cells cultured in matching pluripotent media. The graph shows the relative protein levels assayed by densitometry normalized to ACTA (Y-axis) in the respective media (X-axis). Data are obtained from two independent rounds of differentiation (n = 6). *p < 0.05, **p < 0.01, ***p < 0.001, ****p < 0.0001. f Images of cultured cells stained on day 3 (D3) and day 7 (D7) for TFAP2A (left images) and co-stained with nuclear marker DAPI (right images) in differentiation media. IF staining was performed in triplicate from two independent rounds of differentiation
Fig. 4
Fig. 4
Transcript levels, and Western blot quantification of protein levels for KRT7 and Immunofluorescence (IF) staining for KIRT7 and β-hCG. a Relative transcript levels of KRT7 assayed by qRT-PCR and quantified using ΔΔCt normalized to ACTA in differentiation media (D) compared to the corresponding pluripotency media (P). D5, D3, D5, and D7 on the X-axis represent days in culture in each differentiation medium and matching pluripotency medium. Relative transcript levels and number of replicates are on the Y-axis. Data are presented as mean ± standard error of the mean (SEM); *p < 0.05, **p < 0.01, ***p < 0.001, ****p < 0.0001. b Western blot quantification of protein levels of KRT7 and corresponding western blot image (c). Lysates were collected on day 7 from cells cultured in differentiation media and on day 5 from cells cultured in matching pluripotent media. The graph shows the relative protein levels assayed by densitometry normalized to ACTA (Y-axis) in the respective media (X-axis). Data are obtained from two independent rounds of differentiation (n = 6). *p < 0.05, **p < 0.01. d Images of cultured cells stained on day 3 (D3) and day 7 (D7) for KRT7 and β-hCG (left and middle images) and co-stained with nuclear marker DAPI (right images) in differentiation media. IF staining was performed in triplicate from two independent rounds of differentiation
Fig. 5
Fig. 5
Transcript levels for CGB, HLA-G, and GCM1, Immunofluorescence (IF) staining for α-hCG, β-hCG, and HLA-G and Western blot quantification of protein levels for α-hCG, β-hCG, HLA-G, and GCM1. a, f, h relative transcript levels of CGB (a), HLA-G (f), and GCM1 (h) assayed by qRT-PCR and quantified using ΔΔCt normalized to ACTA in differentiation media (D) compared to the corresponding pluripotency media (P). D5, D3, D5, and D7 on the X-axis represent days in culture in each differentiation medium and matching pluripotency medium. Relative transcript levels and number of replicates are on the Y-axis. Data are presented as mean ± standard error of the mean (SEM); ****p < 0.0001. b, c, g, i Western blot quantification of protein levels of α-hCG (b), β-hCG (c), HLA-G (g), and GCM1 (i) and corresponding western blot image (d). Lysates were collected on day 7 from cells cultured in differentiation media and on day 5 from cells cultured in matching pluripotent media. Each graph shows the relative protein levels assayed by densitometry normalized to ACTA (Y-axis) in the respective media (X-axis). Data are obtained from two independent rounds of differentiation (n = 6). *p < 0.05, **p < 0.01, ***p < 0.001, ****p < 0.0001. e, j Images of cultured cells stained on day 3 (D3) and day 7 (D7) for α-hCG, β-hCG (left and middle images) and co-stained with nuclear marker DAPI (right images) (e) and for HLA-G (j) in differentiation media. IF staining was performed in triplicate from two independent rounds of differentiation
Fig. 6
Fig. 6
Abundance of selected miRNAs from the C19MC complex and promoter CpG methylation and transcript levels of ELF5. ad Graphs of relative transcript levels of four C19MC miRNAs (a miR517b-3p; b miR517b-5p; c miR525-3p; d miR526b-3p) assayed by qRT-PCR and quantified using ΔΔCt normalized to miR103a in corresponding pluripotency media in hESCs grown in differentiation media (D) on days 3, 5, and 7 of differentiation, compared to hESC cultured in matching pluripotent media (P) collected on day 5. Days in culture in each differentiation medium and matching pluripotency medium are shown on the X-axis. Relative miRNA levels and number of replicates for each gene are on the Y-axis. Data are presented as mean ± standard error of the mean (SEM) and each experiment was performed in triplicate (n = 3). *p < 0.05, **p < 0.01, ***p < 0.001, ****p < 0.0001. e, f ELF5 promoter methylation analysis by bisulfite sequencing of individual clones in cells cultured in pluripotency media (e) and differentiation media (f) on day 7. Each row represents an individual sequenced clone; methylated and unmethylated CpG dinucleotides are represented as open and filled circles, respectively. Percentages show the proportion of methylated to non-methylated CpG sites for each set of cloned PCR products. g Relative transcript levels of ELF5 assayed by qRT-PCR and quantified using ΔΔCt normalized to ACTA in differentiation media (D) compared to the corresponding pluripotency media (P). D5, D3, D5, and D7 on the X-axis represent days in culture in each differentiation medium and matching pluripotency medium. Relative transcript levels and number of replicates are on the Y-axis. Data are presented as mean ± standard error of the mean (SEM); ***p < 0.001, ****p < 0.0001

Similar articles

References

    1. Sun C, Groom KM, Oyston C, Chamley LW, Clark AR, James JL. The placenta in fetal growth restriction: What is going wrong? Placenta. 2020 doi: 10.1016/j.placenta.2020.05.003. - DOI - PubMed
    1. Rana S, Lemoine E, Granger JP, Karumanchi SA. Preeclampsia: pathophysiology, challenges, and perspectives. Circ Res. 2019 doi: 10.1161/CIRCRESAHA.118.313276. - DOI - PubMed
    1. Knofler M, Haider S, Saleh L, Pollheimer J, Gamage T, James J. Human placenta and trophoblast development: key molecular mechanisms and model systems. Cell Mol Life Sci. 2019 doi: 10.1007/s00018-019-03104-6. - DOI - PMC - PubMed
    1. James JL, Carter AM, Chamley LW. Human placentation from nidation to 5 weeks of gestation. Part I: What do we know about formative placental development following implantation? Placenta. 2012 doi: 10.1016/j.placenta.2012.01.020. - DOI - PubMed
    1. Turco MY, Moffett A. Development of the human placenta. Development. 2019 doi: 10.1242/dev.163428. - DOI - PubMed

Publication types

MeSH terms