. 2023 Oct;42(42):3142-3156.
doi: 10.1038/s41388-023-02803-6. Epub 2023 Sep 1.

GREB1 isoform 4 is specifically transcribed by MITF and required for melanoma proliferation

Affiliations

GREB1 isoform 4 is specifically transcribed by MITF and required for melanoma proliferation

Koei Shinzawa et al. Oncogene. 2023 Oct.

Abstract

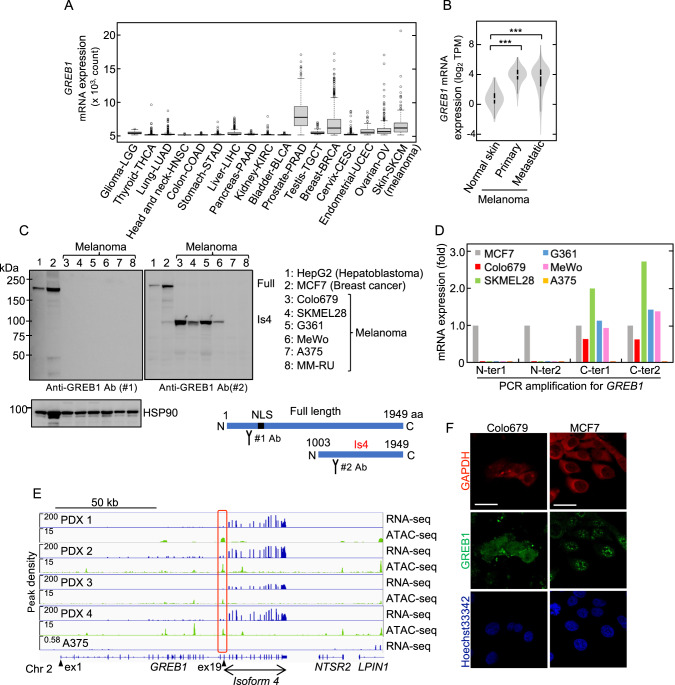
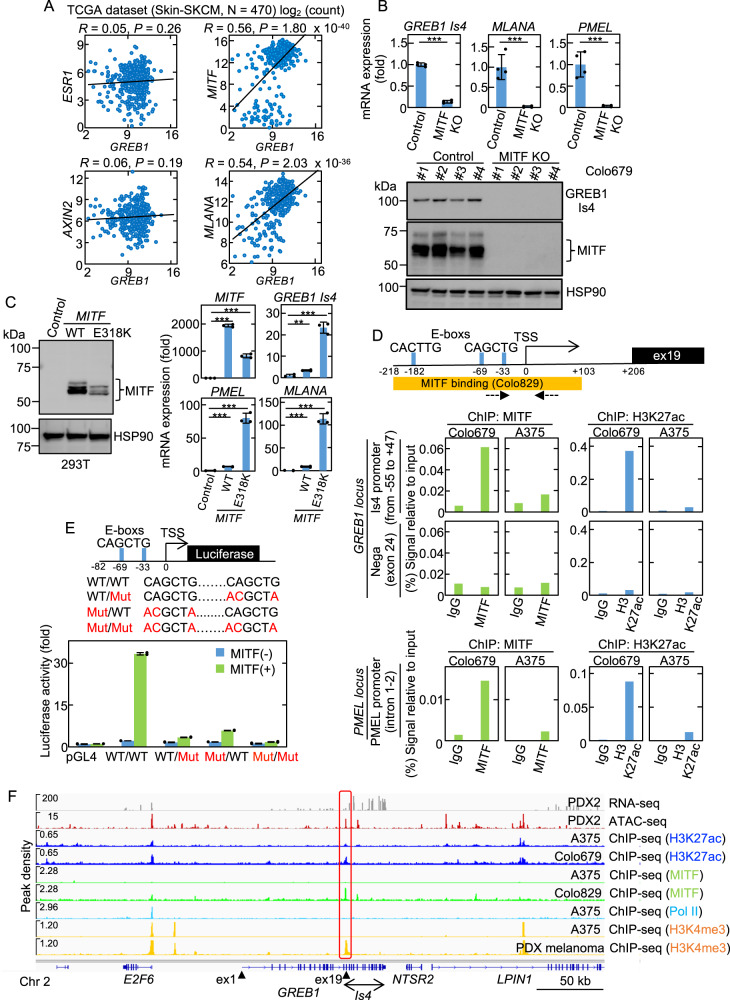
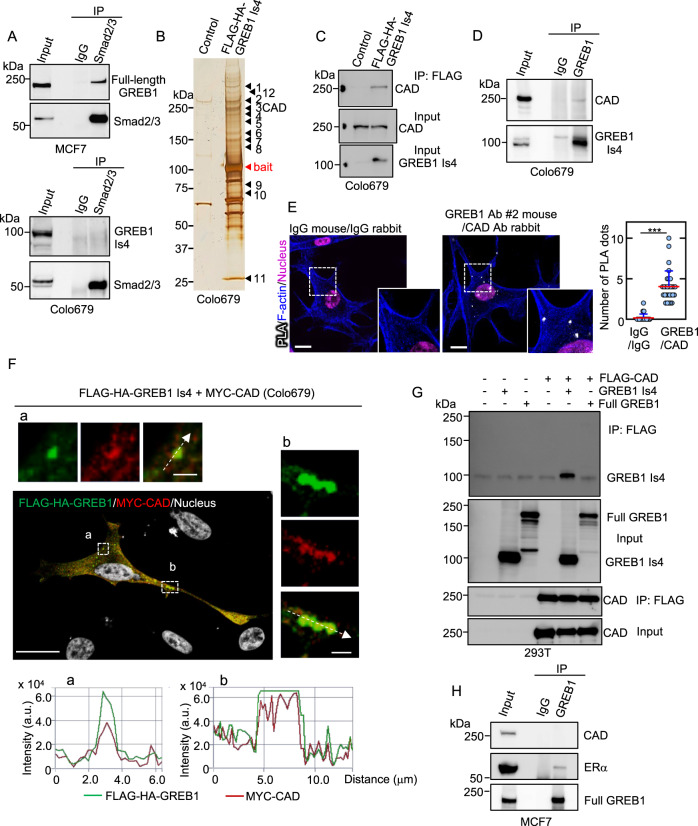
Growth regulation by estrogen in breast cancer 1 (GREB1) is involved in hormone-dependent and -independent tumor development (e.g., hepatoblastoma). In this study, we found that a GREB1 splicing variant, isoform 4 (Is4), which encodes C-terminal half of full-length GREB1, is specifically expressed via microphthalmia-associated transcription factor (MITF) in melanocytic melanoma, and that two MITF-binding E-box CANNTG motifs at the 5'-upstream region of GREB1 exon 19 are necessary for GREB1 Is4 transcription. MITF and GREB1 Is4 were strongly co-expressed in approximately 20% of the melanoma specimens evaluated (17/89 cases) and their expression was associated with tumor thickness. GREB1 Is4 silencing reduced melanoma cell proliferation in association with altered expression of cell proliferation-related genes in vitro. In addition, GREB1 Is4 targeting by antisense oligonucleotide (ASO) decreased melanoma xenograft tumor formation and GREB1 Is4 expression in a BRAFV600E; PTENflox melanoma mouse model promoted melanoma formation, demonstrating the crucial role of GREB1 Is4 for melanoma proliferation in vivo. GREB1 Is4 bound to CAD, the rate-limiting enzyme of pyrimidine metabolism, and metabolic flux analysis revealed that GREBI Is4 is necessary for pyrimidine synthesis. These results suggest that MITF-dependent GREB1 Is4 expression leads to melanoma proliferation and GREB1 Is4 represents a new molecular target in melanoma.


Conflict of interest statement

The authors declare no competing interests.

Figures

Fig. 1
Fig. 1. GREB1 Is4 is expressed in melanoma cells.
A GREB1 mRNA expression in 17 cancer types was obtained from the TCGA database. The normal distribution across the dataset is visualized with box plots, showing the median and 25th and 75th percentiles. Points are displayed as outliers if they were above or below 1.5 times the interquartile range. The abbreviations used for all cancers are shown in https://gdc.cancer.gov/resources-tcga-users/tcga-code-tables/tcga-study-abbreviations. B GREB1 mRNA expression in normal skin (n = 556), primary sites (N = 102), or metastatic cutaneous melanoma (N = 367) from the GTEx and the TCGA datasets. The distribution of the data is visualized with violin plot. Black boxes span the first quartile to the third quartile; white lines in the black boxes indicate the median; the width of a violin plot indicates the kernel density of the expression values (***P < 0.001 by the Student’s t test). C Lysates from various cancer cells were probed with the indicated antibodies. Full or Is4 refer to full-length GREB1 or GREB1 Is4, respectively. GREB1 and GREB1 Is4 protein structure and antibody recognition sites were illustrated. Specificity of anti-GREB1antibodies (#1) and (#2) was checked in Supplementary Fig. S1B. HSP90 was used as a loading control. D Melanoma-specific GREB1 Is4 mRNA transcription in various cancer cells was examined by qPCR using region-specific primers. The amplified regions are depicted in Supplementary Fig. S1D. The data are presented as the fold-change relative to the GREB1 mRNA levels detected in MCF7 cells. E Transcribed regions and open chromatin loci of the GREB1 gene locus in PDX established from four melanoma tissues from three patients were plotted. PDX1 and 2 were established from the same patient. The peak levels of human GREB1 mRNA transcription and chromatin accessibility were obtained from the RNA- and ATAC-seq data, respectively. The RNA-seq data of A375 cells derived from GEO datasets (GSM1138787) was plotted as a negative control. The closed triangles or red box show exon 1 and 19 or putative GREB1 Is4 promoter, respectively. Exon numbers were assigned based on the GREB1 transcription ID: ENST00000381486.7 (GREB1-204). F Colo679 and MCF7 cells were stained with anti-GREB1 (#2) or anti-GAPDH antibody and counterstained with Hoechst33342. GAPDH or Hoechst33342 was used as cytosolic or nuclear marker, respectively. Scale bars in F, 20 μm.
Fig. 2
Fig. 2. MITF stimulates GREB1 Is4 gene expression.
A Scatter plots between the GREB1 gene (x-axis) and ESR1, AXIN2, MITF, or MLANA (y-axis) from TCGA Skin-SKCM (N = 470). The solid line indicates a linear fit. R and P represent the Pearson’s correlation coefficient and P-value, respectively. B GREB1 Is4, MLANA and PMEL mRNA expression in control and MITF KO Colo679 clones. The qPCR data are shown as the fold to control and presented as the mean ± s.d. from four independent clones (***P < 0.001, Student’s t test). Lysates from control vector and MITF KO Colo679 clones were probed with the indicated antibodies. HSP90 was used as a loading control. C Left panel, 293T cell lysate expressing WT MITF or MITFE318K was probed with the indicated antibodies. Right panels, MITF, GREB1 Is4, PMEL, and MLANA mRNA expression in 293T cells expressing WT MITF or MITFE318K. The qPCR data are shown as the fold to control and presented as the mean ± s.d. from three independent experiments (**P < 0.01; ***P < 0.001, Student’s t test). D Top panel, schematic representation of the putative GREB1 Is4 promoter region. TSS and MITF binding sites were predicted as described in Materials and Methods. The dashed arrows indicate the primer set of ChIP. Bottom panels, ChIP qPCR by anti-MITF or H3K27ac antibody of Is4 promoter (from −55 to +47) or control region (exon 24) at GREB1 locus, or PMEL promoter (Intron 1-2) at PMEL locus in Colo679 and A375 cells. The signals were presented as percentage of inputs. E. Top panel, schematic representation of the GREB1 Is4 promoter constructs for transcriptional reporter assay. The WT and Mut constructs of MITF-binding E-box CANNTG motif are shown. Bottom panels, WT/WT, WT/Mut, Mut/WT, or Mut/Mut GREB1 Is4 promoter (-82-0) activity without or with MITF. The luciferase activities are shown as the fold-change relative to the pGL4 vector control and presented as the mean ± s.d. from two independent experiments. F. RNA- and ATAC-seq from Japanese PDX, and ChIP-seq of H3K27ac, MITF, Pol II, and H3K4me3 from public ChIP data in the putative GREB1 Is4 promoter. The closed triangles or red box show exons 1 and 19 or putative GREB1 Is4 promoter, respectively.
Fig. 3
Fig. 3. GREB1 and MITF expression is correlated with melanoma cases.
A Serial sections of nevi were stained with hematoxylin-eosin (HE) (a), anti-GREB1(#2) (b, c) or anti-MITF (d) antibody. The boxed region in (b) was enlarged in (c). To distinguish from melanin pigment, the staining was visualized using the Warp Red Chromogen Kit, and sections counterstained with hematoxylin. Scale bars, 500 μm (a, b); 100 μm (c, d). B Primary melanoma tissues were stained with HE (a), anti-GREB1(#2) (b, c), or anti-MITF (d) antibody. The boxed region in (b) was enlarged in c. The staining was visualized as in A. Scale bars, 500 μm (a, b); 100 μm (c, d). C, D The distributions of the IHC scores (0–3) for GREB1 or MITF in the nevi and primary melanoma sections are shown as percentages (C). The melanoma samples were classified into two groups, depending on tumor thickness – smaller (N = 26) or larger (N = 63) than 1.5 mm. The distributions of the IHC scores for GREB1 or MITF are shown as percentages (D). E Scatter plots depict the relationship between the GREB1 and MITF scores in melanoma (N = 89). The size of the dots indicates the number of identical scores. The solid line indicates a linear fit. R and P represent the Pearson’s correlation coefficient and P-value, respectively. F Serial sections of a single melanoma specimen were stained with anti-GREB1(#2) (a) or anti-MITF antibody (b), and the respective staining intensities for individual cells were quantified with HALO soft and pseudo-colored into four levels: absent, weak, intermediate, and strong (c, d). Scale bars, 500 μm (a–d).
Fig. 4
Fig. 4. GREB1 Is4 stimulates melanoma cell proliferation in vitro.
A Colo679 and SKMEL28 cells with 10 nM control or two GREB1 siRNAs were subjected to the 2D cell proliferation assay using CyQUANT NF. The data are presented as the mean ± s.d. from three independent experiments. B Morphology of Colo679 cells treated with control or GREB1 siRNAs. Scale bars, 50 μm. C Cell death or senescence of Colo679 cells with control or two GREB1 siRNAs were visualized with PI/Hoechst33342 or β-galactosidase staining, respectively. The white and black arrows indicate dead and senescent cells, respectively. The positive cells are shown as the percentage to total cells per field (n = 100–200). The data are presented as the mean ± s.d. from two independent experiments. Scale bars, 100 μm (top); 50 μm (bottom). D Colo679 cells expressing GFP or GREB1 Is4 were plated in soft agar. After 14 days, the colony areas were determined. The distribution was visualized using a bee swarm plot. The bars show the median of the colony areas. Scale bars, 60 μm. E A375 cells expressing Dox-inducible GREB1 Is4 or vector control were plated in soft agar with or without Dox 20 ng/ml. GREB1 Is4 induction was checked (Supplementary Fig. S6E). After 7 days, the colony areas were determined and shown as above. Scale bar, 50 μm. F Colo679 cells expressing vector or GREB1 Is4 were transfected with control or two GREB1 siRNAs and subjected to the 2D cell proliferation assay. The data are presented as the mean ± s.d. from three independent experiments. In A and CF, (*P < 0.05; **P < 0.01; ***P < 0.001, Student’s t test). G SKMEL28 and Colo679 cells were transfected with 10 nM control or GREB1 #1 siRNA for 48 h. The mRNA expression was analyzed by qPCR. The data were normalized to GAPDH and expressed as fold-change (white number), relative to the control siRNA. The results were standardized by min-max normalization and are presented as a heat map. H The scatter plots indicate the correlation between the mRNA levels of GREB1 (x-axis) and proliferative (CDK2, MYC, CCND1, LIG1) and CDK inhibitor (CDKN1B) genes (y-axis) in TCGA Skin-SKCM. The solid lines indicate a linear fit. R and P represent the Pearson’s correlation coefficient and P-value, respectively.
Fig. 5
Fig. 5. GREB1 Is4 promotes melanoma proliferation in vivo.
A Colo679 cells (2.5 × 106 cells) were subcutaneously implanted into the dorsal flank of nude mice on day 0. After four weeks, mice were subcutaneously injected with saline or 6-carboxyfluorescein (FAM)-ASO (150 μg). After 6 h, the mice were euthanized, and the fluorescence intensities in the various organs were measured using the IVIS imaging system. B Colo679 cells (2.5 × 106 cells) in 50% Matrigel were subcutaneously implanted into the dorsal flank of nude mice (N = 6 per group) on day 0. After three weeks, the tumor-bearing mice received subcutaneous injections of 100 μg control ASO or GREB1 ASO-7724 every three days. IVIS images are shown for subcutaneous tumors six weeks after inoculation. The major integrated radiance is presented in dot plots (***P < 0.001, Student’s t test). C Nude mice bearing the melanoma tumors used in B were euthanized six weeks after tumor inoculation. Images of the resected subcutaneous tumors are shown. The weights of the tumors were measured and presented in dot plots (***P < 0.001, Student’s t test). Scale bar, 1 cm. D The xenograft tumors from C were fixed with paraformaldehyde. Tumor sections were stained with anti-Ki-67 or anti-GREB1 (#2) antibody. The GREB1- or Ki-67-positive cells were counted by HALO software. The data are presented as the percentage of positively stained cells compared to the total number of cells (**P < 0.01; ***P < 0.001, Student’s t test). Scale bars, 100 μm. E The schema of the Tyr-CreER, BRAFV600E, PTENflox and GREB1 Is4 allele is shown. F A schematic representation of melanoma induction in control and GREB1 Is4 mice is presented. A 4-OHT solution was applied topically to the whole back of neonatal mice on days 2–6 after birth. 49 days after 4-OHT administration, representative photographs were taken for the shaved dorsal skin of control and GREB1 Is4 melanoma mice. The white arrow heads indicate melanoma nodules. The number in the upper left of the picture indicate the number of tumor nodules. G The number of tumor nodules per mouse and the percentage of the tumor incidence at 49 days are shown (N = 12–13 mice per genotype). H Tumor-free survival rates were compared between control (blue) and GREB1 Is4 (red) melanoma mice. The log-rank test was used for statistical analysis.
Fig. 6
Fig. 6. CAD is identified as a GREB1 Is4-binding protein.
A Lysates of MCF7 and Colo679 cell were immunoprecipitated with anti-Smad2/3 antibody, and the immunoprecipitates were probed with anti-GREB1(#2) or anti-Smad2/3 antibody. B Lysates from Colo679 cells expressing GFP (control) or FLAG-HA-GREB1 Is4 were immunoprecipitated with an anti-FLAG antibody. The immunoprecipitates were eluted using a FLAG peptide, and FLAG-HA-GREB1 Is4-interacting proteins were detected by silver staining and subjected to LC-MS/MS analysis. FLAG-HA-GREB1 Is4 (bait) and CAD are indicated by a red arrowhead and No.3 band, respectively. The other identified bands are listed in Supplementary Table S3. C Colo679 cell lysates were immunoprecipitated with control IgG and anti-FLAG antibody, and the immunoprecipitates were probed with anti-CAD or anti-GREB1(#2) antibody. D Lysates from Colo679 cells were immunoprecipitated with an anti-GREB1(#3) antibody and the immunoprecipitates were probed with anti-CAD or anti-GREB1(#2) antibody. E Colo679 cells were incubated with mouse anti-GREB1(#2) and rabbit anti-CAD antibodies, which were then combined with secondary PLA probes. Interaction events are shown as white dots. Cells with PLA dots were counted, and the results are expressed as the percentage of total cells per field (n > 100) (***P < 0.001 by the Student’s t test). The regions in the solid squares are shown enlarged. Phalloidin or Hoechst33342 was used as a F-actin or nucleus staining marker, respectively. Scale bars, 10 μm. F Colo679 cells expressing FLAG-HA-GREB1 Is4 and MYC-CAD were stained with the anti-FLAG and anti-MYC antibodies, and counterstained with Hoechst33342. Scale bar, 20 μm. The boxed region in a and b was enlarged to show monochromatic stained images above and to the right, respectively. Scale bar, 2 μm. The fluorescence intensities of FLAG-HA-GREB1 Is4 (green) and MYC-CAD (red) at the white arrow sections are shown in a and b below. G Lysates from 293T cells expressing FLAG-CAD and full-length GREB1 or GREB1 Is4 were immunoprecipitated with anti-FLAG antibody, and the immunoprecipitates and input lysates were probed with the indicated antibodies. H Lysates from MCF7 cells were immunoprecipitated with an anti-GREB1 (#3) antibody and the immunoprecipitates were probed with anti-CAD, anti-ERα, or anti-GREB1(#2) antibody.
Fig. 7
Fig. 7. GREB1 Is4 is involved in de novo pyrimidine synthesis.
A The schematic diagram depicts the de novo pyrimidine synthesis pathway and the pyrimidine base ring incorporating the nitrogen and carbon atoms from glutamine and CO2, respectively. CAP carbamoyl phosphate, CAA carbamoyl aspartic acid, DHOA dihydroorotate, OA orotate, OMP orotidine monophosphate. B Colo679 cells transfected with control or GREB1 #1 siRNA for 60 min were labeled with 15N213C5-glutamine, and the intracellular concentrations of the indicated metabolite concentrations were measured using IC- and LC-QEMS analysis. Experiments were performed in quadruplicate and the data are presented as the mean ± s.d. (*P < 0.05; **P < 0.01; ***P < 0.001, Student’s t test). C FLAG-HA-GREB1 Is4 and FLAG-HA-CAD were purified from 293T cells and subjected to SDS-PAGE followed by CBB staining. D The CPSase activity of FLAG-HA-CAD in the presence or absence of 0.2 mM PRPP or 0.5 mM UTP. The results shown are representative of three independent experiments. E Left panel, the CPSase activity of purified FLAG-HA-CAD (0.5 μg) in the presence of the indicated amounts of purified FLAG-HA-GREB1 Is4. Right panel, the CPSase activity of FLAG-HA-CAD Is4 (0.5 μg) and FLAG-HA-GREB1 (0.5 μg) with the indicated concentrations of PRPP. The results are shown as the fold increase. F The CPSase activity in lysate from Colo679 cells treated with control or GREB1 #1 siRNA. G Left panel, Colo679 cells were labeled with 4.3 mM 14C-labeled sodium bicarbonate (74 kBq) in the presence or absence of 10 μM actinomycin D (ActD) (transcriptional inhibitor) for the indicated times. The incorporated radioactivity into total RNA was counted with a liquid scintillation counter. ActD was used for positive control of this assay. Right panel, the incorporated radioactivity into total RNA from Colo679 cells transfected with control or GREB1 siRNA was counted as described above. The data are presented as the mean ± s.d. from three independent experiments (***P < 0.001, Student’s t test). H The equal number of Colo679 cells transfected with control or two GREB1 siRNAs was treated with the indicated concentrations of A771726 (DHODH inhibitor) for 4 days. Cell viability was measured by the CellTiter-Glo kit. The results are shown as a percentage compared to those of cells treated with vehicle (DMSO) only, and expressed as the mean ± s.d. of three independent experiments. X axis is described in log scale. I Colo679 cells expressing control vector or exogenous GREB1 Is4 were treated with control or GREB1 #1 siRNA for 2 days and then the equal number of Colo679 cells was incubated with 20 μM A771726 for 4 days and cell viability was measured as described in H. The results are shown as a percentage compared to those of cells treated with vehicle (DMSO) only, and expressed as the mean ± s.d. of three independent experiments. **P < 0.01, Student’s t test.

Similar articles

Cited by

References

    1. Miller AJ, Mihm MC., Jr Melanoma. N Engl J Med. 2006;355:51–65. doi: 10.1056/NEJMra052166. - DOI - PubMed
    1. Damsky WE, Bosenberg M. Melanocytic nevi and melanoma: unraveling a complex relationship. Oncogene. 2017;36:5771–92. doi: 10.1038/onc.2017.189. - DOI - PMC - PubMed
    1. Shain AH, Bastian BC. From melanocytes to melanomas. Nat Rev Cancer. 2016;16:345–58. doi: 10.1038/nrc.2016.37. - DOI - PubMed
    1. Curtin JA, Fridlyand J, Kageshita T, Patel HN, Busam KJ, Kutzner H, et al. Distinct sets of genetic alterations in melanoma. N Engl J Med. 2005;353:2135–47. doi: 10.1056/NEJMoa050092. - DOI - PubMed
    1. Steininger J, Gellrich FF, Schulz A, Westphal D, Beissert S, Meier F. Systemic therapy of metastatic melanoma: on the road to cure. Cancers. 2021;13:1430. doi: 10.3390/cancers13061430. - DOI - PMC - PubMed