

Objective analysis of partial three-dimensional rotator cuff muscle volume and fat infiltration across ages and sex from clinical MRI scans
- PMID: 37658220
- PMCID: PMC10474276
- DOI: 10.1038/s41598-023-41599-z
Objective analysis of partial three-dimensional rotator cuff muscle volume and fat infiltration across ages and sex from clinical MRI scans
Abstract
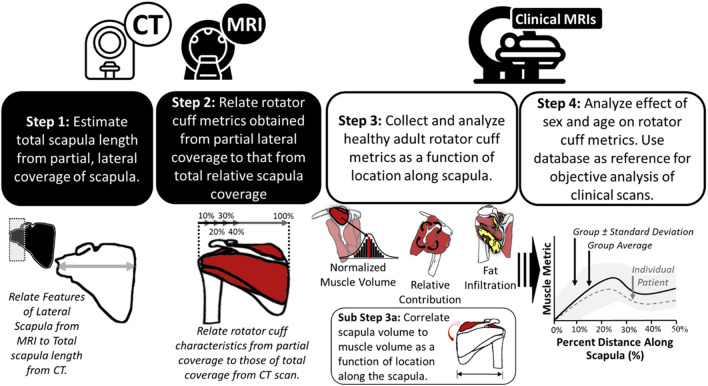
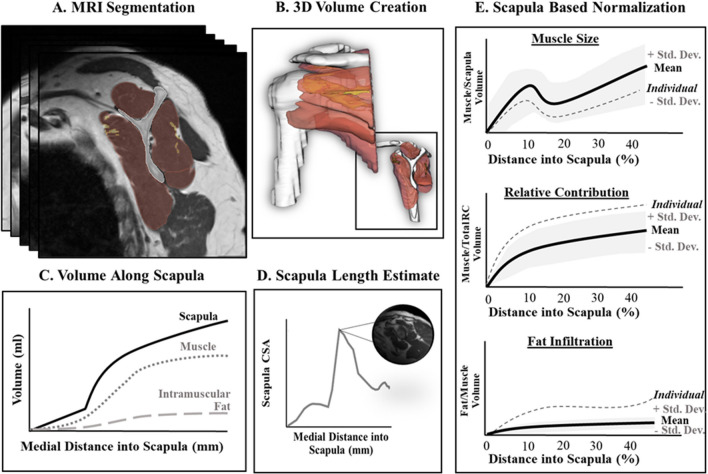
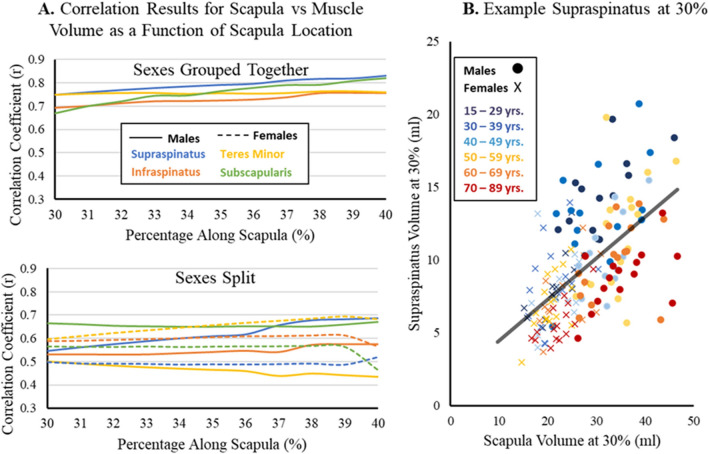
Objective analysis of rotator cuff (RC) atrophy and fatty infiltration (FI) from clinical MRI is limited by qualitative measures and variation in scapular coverage. The goals of this study were to: develop/evaluate a method to quantify RC muscle size, atrophy, and FI from clinical MRIs (with typical lateral only coverage) and then quantify the effects of age and sex on RC muscle. To develop the method, 47 full scapula coverage CTs with matching clinical MRIs were used to: correct for variation in scan capture, and ensure impactful information of the RC is measured. Utilizing this methodology and automated artificial intelligence, 170 healthy clinical shoulder MRIs of varying age and sex were segmented, and each RC muscle's size, relative contribution, and FI as a function of scapula location were quantified. A two-way ANOVA was used to examine the effect of age and sex on RC musculature. The analysis revealed significant (p < 0.05): decreases in size of the supraspinatus, teres minor, and subscapularis with age; decreased supraspinatus and increased infraspinatus relative contribution with age; and increased FI in the infraspinatus with age and in females. This study demonstrated that clinically obtained MRIs can be utilized for automatic 3D analysis of the RC. This method is not susceptible to coverage variation or patient size. Application of methodology in a healthy population revealed differences in RC musculature across ages and FI level between sexes. This large database can be used to reference expected muscle characteristics as a function of scapula location and could eventually be used in conjunction with the proposed methodology for analysis in patient populations.
© 2023. Springer Nature Limited.
Conflict of interest statement
NIH-NIAMS Grant # 5R41AR078720. Financial competing interests: Brian C. Werner, Lara Riem, Matthew Cousins, Olivia DuCharme, and Silvia Blemker received research support from the funding source (NIH Phase 1 STTR Grant). Lara Riem, Matthew Cousins, Olivia DuCharme, and Silvia Blemker are employees of Springbok Analytics and own stock in the company.
Figures


Similar articles
-
MRI-based 3-dimensional volumetric assessment of fatty infiltration and muscle atrophy in rotator cuff tears.J Shoulder Elbow Surg. 2022 Jun;31(6):1272-1281. doi: 10.1016/j.jse.2021.12.037. Epub 2022 Jan 31. J Shoulder Elbow Surg. 2022. PMID: 35101606
-
Three-dimensional muscle loss assessment: a novel computed tomography-based quantitative method to evaluate rotator cuff muscle fatty infiltration.J Shoulder Elbow Surg. 2022 Jan;31(1):165-174. doi: 10.1016/j.jse.2021.07.029. Epub 2021 Aug 31. J Shoulder Elbow Surg. 2022. PMID: 34478865
-
Rotator cuff fatty infiltration and muscle atrophy: relation to glenoid deformity in primary glenohumeral osteoarthritis.J Shoulder Elbow Surg. 2022 Feb;31(2):286-293. doi: 10.1016/j.jse.2021.07.007. Epub 2021 Aug 12. J Shoulder Elbow Surg. 2022. PMID: 34390840
-
Deep learning for the rapid automatic quantification and characterization of rotator cuff muscle degeneration from shoulder CT datasets.Eur Radiol. 2021 Jan;31(1):181-190. doi: 10.1007/s00330-020-07070-7. Epub 2020 Jul 22. Eur Radiol. 2021. PMID: 32696257 Free PMC article.
-
Shoulder muscle activity and function in common shoulder rehabilitation exercises.Sports Med. 2009;39(8):663-85. doi: 10.2165/00007256-200939080-00004. Sports Med. 2009. PMID: 19769415 Review.
Cited by
-
Developing a three-dimensional convolutional neural network for automated full-volume multi-tissue segmentation of the shoulder with comparisons to Goutallier classification and partial volume muscle quality analysis.J Shoulder Elbow Surg. 2025 Sep;34(9):2224-2238. doi: 10.1016/j.jse.2024.12.033. Epub 2025 Feb 5. J Shoulder Elbow Surg. 2025. PMID: 39921123
-
The impact of supraspinatus tear on subscapularis muscle atrophy and fatty infiltration.Clin Shoulder Elb. 2024 Dec;27(4):437-446. doi: 10.5397/cise.2024.00521. Epub 2024 Nov 15. Clin Shoulder Elb. 2024. PMID: 39558566 Free PMC article.
-
Artificial intelligence powered advancements in upper extremity joint MRI: A review.Heliyon. 2024 Mar 25;10(7):e28731. doi: 10.1016/j.heliyon.2024.e28731. eCollection 2024 Apr 15. Heliyon. 2024. PMID: 38596104 Free PMC article. Review.
References
Publication types
MeSH terms
Grants and funding
LinkOut - more resources
Full Text Sources
Research Materials
