. 2023 Sep 1;13(1):14401.
doi: 10.1038/s41598-023-41535-1.

CD31 defines a subpopulation of human adipose-derived regenerative cells with potent angiogenic effects

Affiliations

CD31 defines a subpopulation of human adipose-derived regenerative cells with potent angiogenic effects

Pratibha Dhumale et al. Sci Rep. .

Abstract

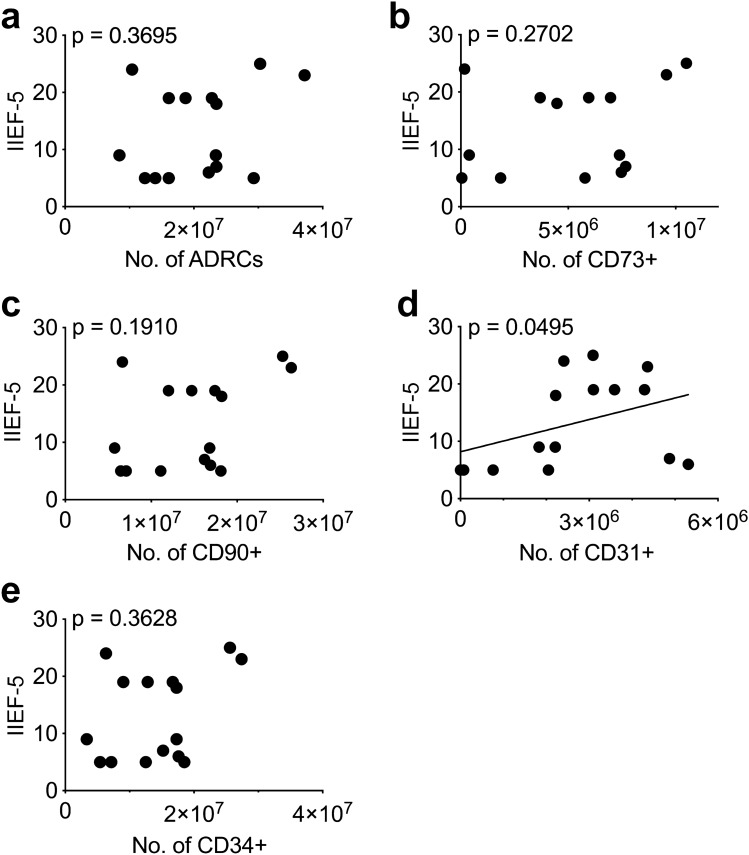
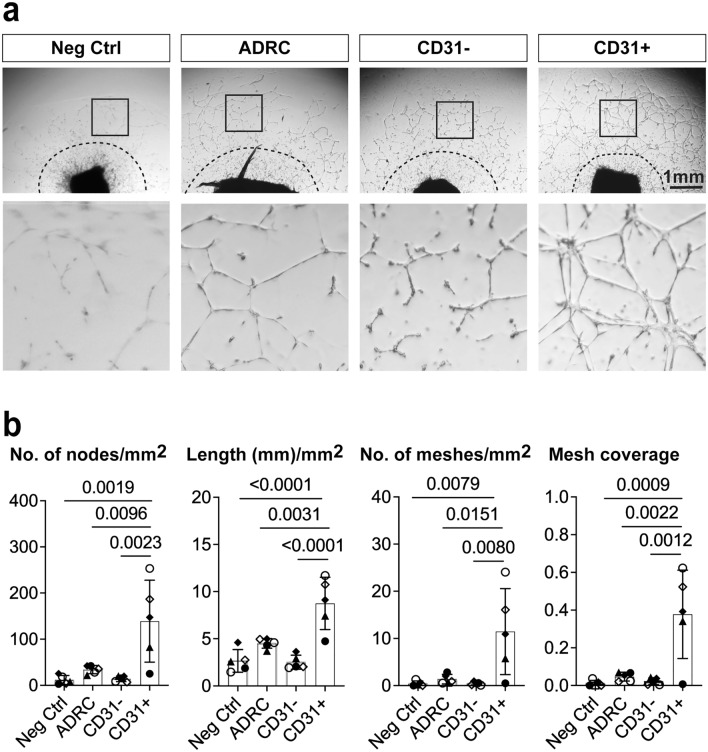
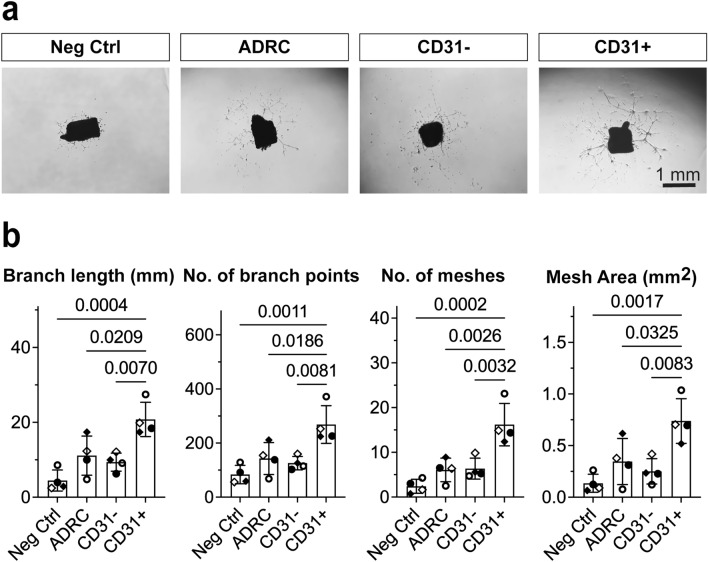
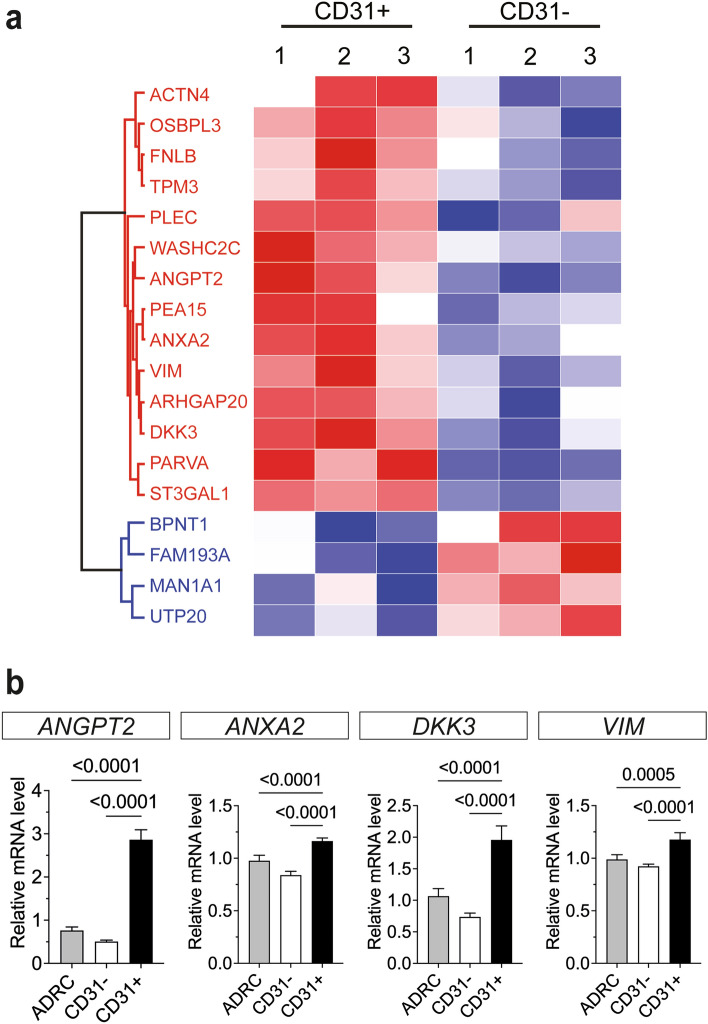
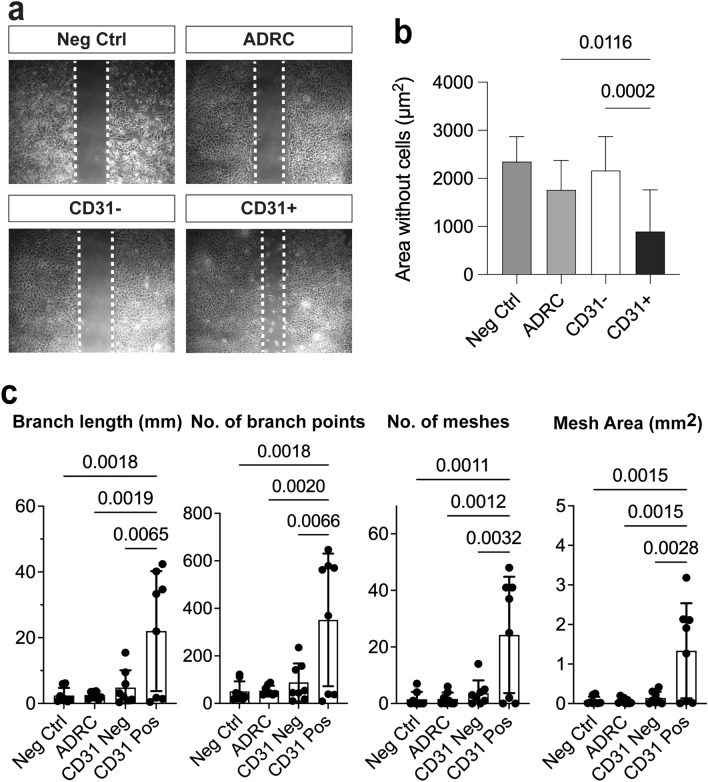
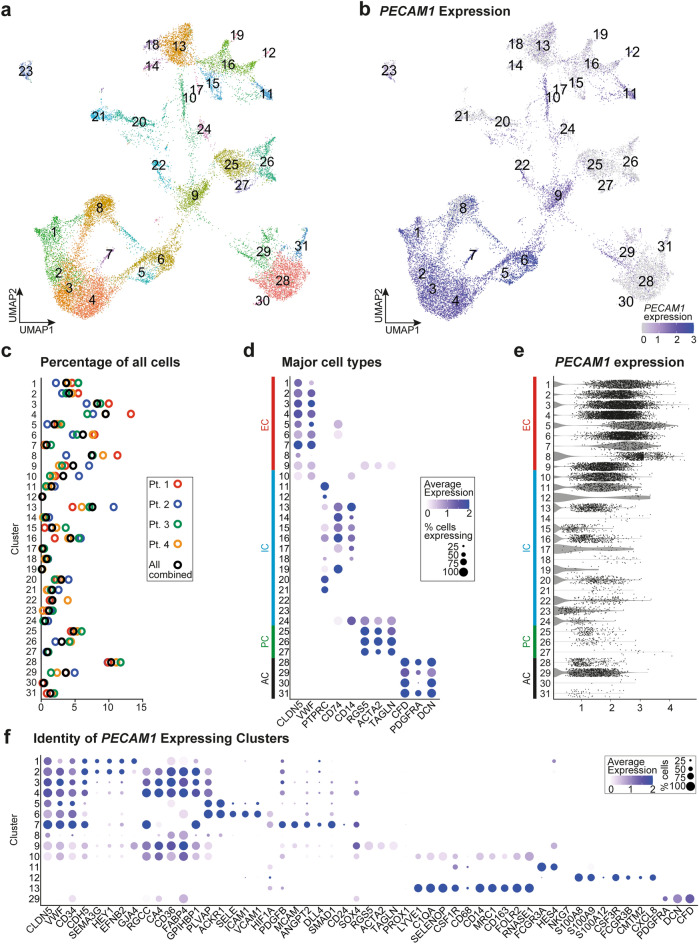
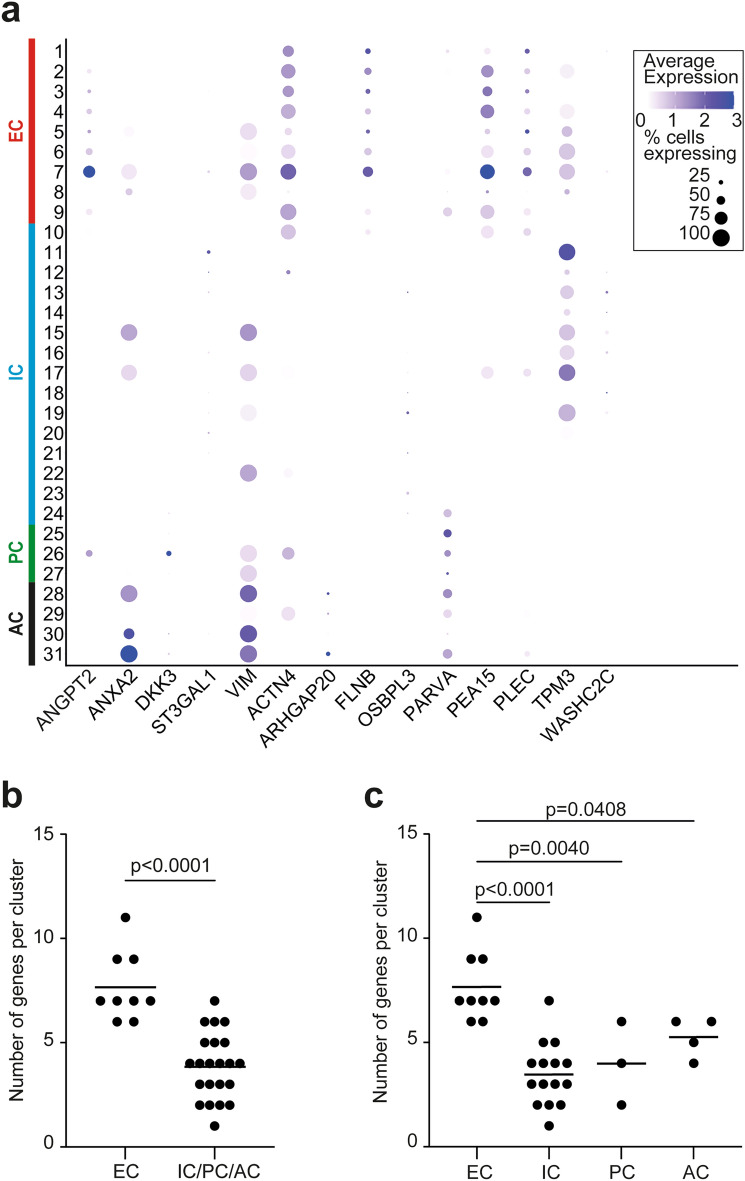
Cellular heterogeneity represents a major challenge for regenerative treatment using freshly isolated Adipose Derived Regenerative Cells (ADRCs). Emerging data suggest superior efficacy of ADRCs as compared to the ex vivo expanded and more homogeneous ADRCs (= ASCs) for indications involving (micro)vascular deficiency, however, it remains unknown which ADRC cell subtypes account for the improvement. Surprisingly, we found regarding erectile dysfunction (ED) that the number of injected CD31+ ADRCs correlated positively with erectile function 12 months after one bolus of autologous ADRCs. Comprehensive in vitro and ex vivo analyses confirmed superior pro-angiogenic and paracrine effects of human CD31+ enriched ADRCs compared to the corresponding CD31- and parent ADRCs. When CD31+, CD31- and ADRCs were co-cultured in aortic ring- and corpus cavernous tube formation assays, the CD31+ ADRCs induced significantly higher tube development. This effect was corroborated using conditioned medium (CM), while quantitative mass spectrometric analysis suggested that this is likely explained by secretory pro-angiogenic proteins including DKK3, ANGPT2, ANAX2 and VIM, all enriched in CD31+ ADRC CM. Single-cell RNA sequencing showed that transcripts of the upregulated and secreted proteins were present in 9 endothelial ADRC subsets including endothelial progenitor cells in the heterogenous non-cultured ADRCs. Our data suggest that the vascular benefit of using ADRCs in regenerative medicine is dictated by CD31+ ADRCs.


Conflict of interest statement

SPS is the CEO and owner of Blue Cell Therapeutics, Copenhagen, Denmark. The rest of the authors declare no competing interests.

Figures

Figure 1
Figure 1
Patient-reported outcomes following cell therapeutic treatment for radical prostatectomy-related erectile dysfunction, correlate positively with the number of injected CD31+  ADRCs. Fifteen urine-continent patients suffering from erectile dysfunction following radical prostatectomy were treated with a single intra-cavernousal injection of autologous ADRCs and the patient-related outcomes (i.e., recovery of erectile function) were evaluated according to the IIEF-5 score 12-months post-treatment. The individual IIEF-5 scores are plotted against: (a) the corresponding total numbers of injected ADRCs and the numbers of the (b) CD73+ subpopulation, (c) CD90+ subpopulation, (d) CD31+  subpopulation as well as (e) CD34+ subpopulation of ADRCs, respectively, and analyzed for correlation using Spearman r correlation test. p-values are shown in the figure panels. Only the number of injected CD31+  ADRCs significantly correlated with higher, improved IIEF-5 scores.
Figure 2
Figure 2
Test of potential paracrine angiogenic effects of human ADRCs, CD31- and CD31+  ADRCs in ex vivo co-culture assays with mouse corpus cavernosum explants. (a) Representative pictures of the sprouting from mouse corpus cavernosum explants after 15 days of co-culture with 20,000 ADRCs, CD31−, and CD31+  ADRCs, respectively. Two structurally distinct regions can be identified by visual inspection: (1) in proximity to the corpus cavernosum explants an unstructured area is characterized by high cell numbers but low structural organization; (2) more distally, a well-developed area is characterized with higher structural organization of tubes and establishment of mesh-like structures. The border between these areas is indicated with a stippled line. Quantification of the sprouting was done in three fixed-sized squares, one of these is indicated by a solid-lined box and shown at higher magnification in the lower line of figure panels. (b) Quantification and statistical analyses of the sprouting from mouse corpus cavernosum explants, evaluated based on number of nodes/mm2, total length (mm)/mm2, number of meshes/mm2, and mesh coverage i.e., mesh area per area analyzed. Data is based on five experiments, using cells from three male donors and two female donors. Each experiment consisted of triplicates for each tested cell type. Statistical analysis: For each experiment and condition, outliers were identified by the Rout method before normal distribution was confirmed using D’Agostino-Pearson or Kolmogorov–Smirnov normality tests as appropriate. The means of each of the 4 conditions (Negative control, ADRC, CD31− and CD31+  ADRCs) for each experiment were calculated and subsequently compared using one-way ANOVA. Depiction of data: Each data point represents a mean from one experiment. The box represents the mean of 5 means ± standard deviation (SD). Statistically significant p-values are shown in the figure panels.
Figure 3
Figure 3
Test of potential paracrine angiogenic effects of human ADRCs, CD31− and CD31+  ADRCs in ex vivo co-culture assays with mouse aortic ring explants. (a) Representative pictures of the sprouting from mouse aortic ring explants after 8 days of co-culture with 50,000 ADRCs, CD31− and CD31+  ADRCs, respectively. (b) Quantification and statistical analyses of sprouting from aortic rings evaluated based on the total branch length (mm), number of branch points, number of meshes and total mesh area (mm2). Data is based on four experiments, using cells from three male donors and one female donor. Each experiment consisted of 6–8 replicates for each tested cell type. For each experiment and condition, outliers were identified by the Rout method before normal distribution was confirmed using D’Agostino–Pearson or Kolmogorov–Smirnov normality tests as appropriate. The means of each of the 4 conditions (Negative control, ADRC, CD31− and CD31+  ADRCs) for each experiment were calculated and subsequently compared using one-way ANOVA. Depiction of data: Each data point represents a mean from one experiment. The box represents the mean of 4 means ± standard deviation (SD). Statistically significant p-values are shown in the figure panels.
Figure 4
Figure 4
Mass spectrometry reveals significantly different secretomes of CD31+  and CD31− ADRCs. ADRCs, and CD31− and CD31+  ADRCs, respectively, were cultured for 15 days and the isolated proteins from the corresponding conditioned media were analyzed by RP‐nanoLC‐MS/MS analysis. Data is based on cells from three donors (one male and two females). (a) Heat map showing 14 significantly upregulated and 4 significantly downregulated proteins in the CD31+  ADRC vs CD31− ADRC conditioned media, as identified by individual t-tests with a p-value of 0.05. Upregulated and downregulated proteins are indicated by red and blue colors, respectively. A volcano-plot-representation of the differentially expressed proteins can be seen in Supplementary Fig. 5. (b) Relative mRNA levels of ANGPT2, ANXA2, DKK3, and VIM in ADRC, and CD31− and CD31+  ADRCs after 8 days of co-culture with mouse aortic ring explants confirming the upregulation of these transcripts under the conditions in the ex vivo assay. The data was based on cells from one donor, and eight replicates for each of the three populations. To obtain sufficient material, two replicates were pooled in relation to RNA extraction and RT-qPCR performed (in technical triplicates) on the resulting 4 replicates per population. The mRNA expression was normalized to the expression of the reference genes B2M and TBP, based on the geNorm analysis performed in qBase+ (CV = 0.066, M = 0.191). Statistical analyses were performed using ordinary one-way ANOVA. Statistically significant p-values are shown in the figure panel.
Figure 5
Figure 5
Confirmation of the superior paracrine effects of conditioned medium from CD31+  ADRCs. (a) Migration assay of primary mouse cavernosum pericytes (MCP)s after culture for 24 h in the MS-analyzed conditioned media obtained from ADRCs, CD31− and CD31+  ADRCs, respectively. Representative images for each condition are shown (Magnification × 2.5). The stippled lines indicate the boarder of the cell free area, representing a measure of the migration abilities of the MCPs. (b) MCP migration expressed as a function of the cell free area (µm2) following culture in CM from ADRCs, CD31− and CD31+  ADRCs, respectively. Quantification and statistical analyses were based on data from three experiments, using the MS-analyzed CMs obtained from three different donors. Each experiment consisted of 3 replicates for each tested cell type. Statistical analyses were performed using ordinary one-way ANOVA. Statistically significant p-values are shown in the figure panel. (c) Quantification and statistical analyses of the sprouting from mouse aortic ring explants after culture for 8 days in conditioned media from ADRCs, and CD31− and CD31+  ADRCs, respectively, evaluated based on total branch length (mm), number of branch points, number of meshes, and total mesh area (mm2). To overcome limitations in the amount of available MS-analyzed CM, equal volumes of the different CMs obtained from the three donors were pooled and used in one experiment with eight replicates for each CM-pool. Data are presented as means ± standard deviation (SD). Statistical analyses were performed using ordinary one-way ANOVA. Statistically significant p-values are shown in the figure panels.
Figure 6
Figure 6
Single-cell RNA sequencing of 24,403 CD31+  ADRCs from 4 donors. (a) Uniform manifold approximation and projection (UMAP) 2D visualization of 24,403 CD31+  enriched ADRCs in 31 clusters. (b) Expression of the CD31-encoding PECAM1-gene in cells visualized in a 2D UMAP plot. (c) Percentage of total cells in each of the 31 clusters visualized for each of the four patient samples (Pt. 1–4) and for all four samples combined. (d) Dot plot showing marker-based assignment of the 31 clusters to four major groups: endothelial cells (EC)s (markers CLDN5 and VWF), immune cells (IC)s (PTPRC, CD74, and CD14), perivascular mural cells (PC)s (RGS5, ACTA2, and TAGLN), and adipose stem and progenitor cells (AC)s (CFD, PDGFRA, and DCN). Color saturation of a dot indicates the average gene expression level in positive cells, while dot size reflects the percentage of cells in each cluster expressing the gene. (e) Violin plot of PECAM1 expression levels in cells of the 31 clusters. (f) Dot plot of marker genes revealing the molecular identities of clusters 1–13 and 29, which were selected based on high average PECAM1 expression and/or high percentages of PECAM1 expressing cells.
Figure 7
Figure 7
Several clusters of CD31+  selected ADRCs express genes encoding the 14 proteins that were significantly upregulated in the conditioned media from cultured CD31+  selected ADRCs. (a) Dot plot showing expression of the genes encoding the 14 proteins that were significantly upregulated in the conditioned media from cultured CD31+  selected ADRCs. Color saturation of a dot indicates the average gene expression level in positive cells, while dot size reflects the percentage of cells in each cluster expressing the gene. Note that particularly clusters 5 (presumptive postcapillary venule endothelial cells) and 7 (presumptive immature angiogenic endothelial cells) express high numbers of the genes, 9 and 11 genes, respectively, including the 4 genes encoding the secreted proteins ANGPT2, ANAX2, ST3GAL1 and VIM. (b) Number of genes, encoding proteins that were significantly upregulated in the conditioned media from cultured CD31+  selected ADRCs, expressed in EC clusters 1–9 compared to the remaining combined clusters 10–31 using the Mann–Whitney test. (c) Number of genes expressed in EC clusters 1–9 compared to the groups of IC clusters (10–24), PC clusters (25–27), and AC clusters (28–31), respectively using one-way ANOVA followed by the Dunnett test comparing every mean to the EC mean. The bars in panels b and c represent means. AC adipose stem and progenitor cells, EC endothelial cells, IC immune cells, PC perivascular mural cells.

References

    1. Alt EU, et al. Towards a comprehensive understanding of UA-ADRCs (uncultured, autologous, fresh, unmodified, adipose derived regenerative cells, isolated at point of care) in regenerative medicine. Cells. 2020;9:1097. - PMC - PubMed
    1. Haahr MK, et al. A 12-month follow-up after a single intracavernous injection of autologous adipose-derived regenerative cells in patients with erectile dysfunction following radical prostatectomy: An open-label phase I clinical trial. Urology. 2018;121(203):e203–e206. - PubMed
    1. Haahr MK, et al. Safety and potential effect of a single intracavernous injection of autologous adipose-derived regenerative cells in patients with erectile dysfunction following radical prostatectomy: An open-label phase I clinical trial. EBioMedicine. 2016;5:204–210. - PMC - PubMed
    1. Serrero M, et al. Long-term safety and efficacy of local microinjection combining autologous microfat and adipose-derived stromal vascular fraction for the treatment of refractory perianal fistula in crohn’s disease. Gastroenterology. 2019;156:2335–2337. - PubMed
    1. Sørensen KM, Jensen CH, Sheikh SP, Qvist N, Sørensen JA. Treatment of fistulizing perianal crohn’s disease by autologous microfat enriched with adipose-derived regenerative cells. Inflamm. Bowel Dis. 2021;28:967–970. - PubMed

Publication types