Review
. 2023 Nov;53(12):2355-2368.
doi: 10.1007/s00247-023-05753-z. Epub 2023 Sep 2.

Diffusion tensor imaging of the physis: the ABC's

Affiliations
Review

Diffusion tensor imaging of the physis: the ABC's

Laura A Santos et al. Pediatr Radiol. 2023 Nov.

Abstract

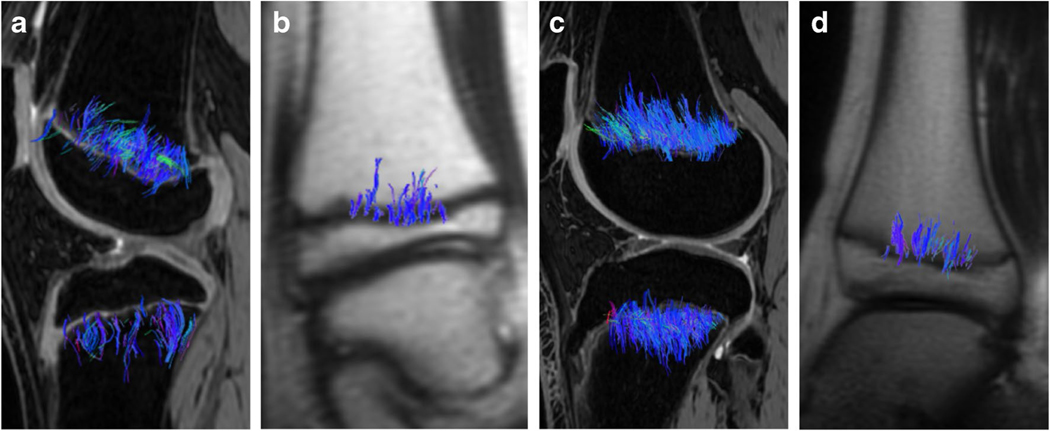
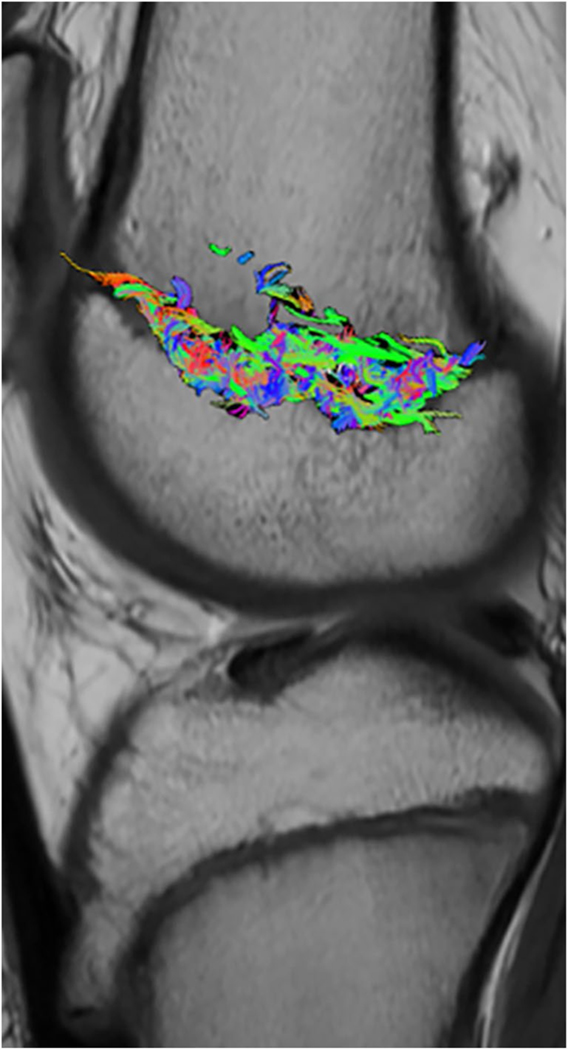
The physis, or growth plate, is the primary structure responsible for longitudinal growth of the long bones. Diffusion tensor imaging (DTI) is a technique that depicts the anisotropic motion of water molecules, or diffusion. When diffusion is limited by cellular membranes, information on tissue microstructure can be acquired. Tractography, the visual display of the direction and magnitude of water diffusion, provides qualitative visualization of complex cellular architecture as well as quantitative diffusion metrics that appear to indirectly reflect physeal activity. In the growing bones, DTI depicts the columns of cartilage and new bone in the physeal-metaphyseal complex. In this "How I do It", we will highlight the value of DTI as a clinical tool by presenting DTI tractography of the physeal-metaphyseal complex of children and adolescents during normal growth, illustrating variation in qualitative and quantitative tractography metrics with age and skeletal location. In addition, we will present tractography from patients with physeal dysfunction caused by growth hormone deficiency and physeal injury due to trauma, chemotherapy, and radiation therapy. Furthermore, we will delineate our process, or "DTI pipeline," from image acquisition to data interpretation.

Keywords: Anisotropy; Child; Diffusion tensor imaging; Growth plate; Magnetic resonance imaging; Physis; Tractography.


Conflict of interest statement

Conflicts of interest None

Figures

Fig. 1
Fig. 1
Normal anatomy of the physis. The area of anatomy depicted by diffusion tensor imaging (DTI) is the physeal-metaphyseal complex. The left side of the physeal-metaphyseal complex is a line drawing representation and the right side is a superimposed safranin O stain highlighting the columnar architecture of cartilage and bone at the physeal-metaphyseal complex. The primary physis contains chondrocytes arranged in zones: reserve cells (Resting Zone) and proliferative cells arranged in columns (Proliferative Zone) which increase in size to become hypertrophic (Hypertrophic Zone) resulting in height gain. Histologically, the “palisading” arrangement of chondrocyte columns in the proliferative and hypertrophic zones allows for organized diffusion of water. At the end of the hypertrophic zone, decreasing oxygen levels triggers chondrocyte apoptosis and subsequent mineralization to form the primary spongiosa, which maintains the parallel arrangement of the physis
Fig. 2
Fig. 2
Isotropic versus anisotropic diffusion. In this diagram, the beaker filled with water (top) represents an isotropic system; when a drop of blue dye is added to the beaker, the dye diffuses freely in all directions. In the bottom row of images, the beaker contains water and acrylic rods. When a drop of dye is added, it rapidly diffuses in a vertical direction along the columns of water between the acrylic rods, but is much slower to diffuse horizontally. The acrylic rods are analogous to cells arranged in a parallel and vertical configuration, with the cellular membranes limiting horizontal diffusion. This is an anisotropic system
Fig. 3
Fig. 3
Standard convention for color coding of tractographic reconstruction. Blue tracts represent diffusion in the superior-inferior direction, red tracts in the left-to-right direction, and green tracts in the antero-posterior direction [10]. In this image, blue fiber tracts run perpendicular to the physis, corresponding to the direction of least restricted diffusion which is parallel to the cartilage columns within the physis and adjacent metaphysis. The right side is a superimposed safranin O stain highlighting the columnar architecture explain on Fig. 1
Fig. 4
Fig. 4
Image superimposition. a A screenshot of the femur and tibia tractography is obtained. b The tractography screenshot is processed using any software for background removal; subsequently, a screenshot of any conventional 3D MR image in the coronal plane is obtained. Please note, we take a screenshot from one single coronal slice of the 3D image. c With the available background-less tractography, superimpose the tractography over the screenshot of the conventional MR images
Fig. 5
Fig. 5
Femur versus tibia fiber tract patterns. Femur and tibial fiber tract patterns in three 11-year-old boys. There are qualitative differences in the tract patterns of the distal femoral physis versus the proximal tibial physis. (a) The femoral fiber tracts are longer and thicker than the tibial tracts (b, c) and femoral tracts are predominantly located peripherally (a) along the physis. (b, c) Tibial fiber tracts are either homogeneously distributed along the physis or predominantly central
Fig. 6
Fig. 6
Tractography on early pubescent children. Fiber tractography overlaid on conventional MR images, in three coronal T1 scans (a-c, e-g) and a sagittal proton-density (PD) image (d, h) in children transitioning into puberty, 8-year-old girls (a-d) and 10-year-old boys (e-h). The fiber tractography depicts the physeal-metaphyseal complex in both femur and tibia. Fiber tractography in both physes is scant, short, and parallel to the long axis of the bone in males and females. Females experience earlier appearance of fibers due to earlier growth spurt and during the growth spurt fiber tracts are overall finer and visibly less dense in females than in males
Fig. 7
Fig. 7
Tractography of young adolescents during the growth spurt. Fiber tractography superimposed on conventional MR images, including the first three coronal T1 scans and a sagittal proton-density (PD) image, in children at peak growth: (a-d) 10-year-old females and (e-h) 12-year-old males. Femoral and tibial fiber tracts are elongated, thick, dense, and organized in parallel to the long axis of the bone. The males tend to have more numerous and longer tracts
Fig. 8
Fig. 8
Tractography of older adolescents at the end of the growth spurt. Fiber tractography superimposed on conventional MR images, three coronal T1 images and a sagittal proton-density (PD), in adolescents at the end of growth: (a-d) 14-year-old females and (e-h) 15-year-old males. Femoral and tibial fiber tract patterns are not well-defined; tracts are short and multicolored indicating incoherent organization. Different degrees of physeal closure will be apparent at this phase, with some subjects demonstrating persistent remnant cartilage while others demonstrate complete closure. Figures 6a–h and 7a–h and (a-h) display similar qualitative tractographic patterns in both male and female subjects. The purpose of displaying these is to highlight the structural and organizational consistency of physeal tracts regardless of sex. The images show how the fiber tracts develop and change over time during the growth spurt according to sex under-scoring the earlier female growth spurt and the later appearance of the bulkier male fiber tractography. Both sexes initially have few fibers that grow, peak, and then decrease after the growth spurt
Fig. 9
Fig. 9
Tractography changes over time. Sequential results of DTI scans of the knee of a 12-year-old boy acquired over a 12-month span demonstrate the physeal changes that occur as the child progresses through puberty. a-b With the initial scan, tractography resulted in scant thin blue fiber tracts angled perpendicular to the femoral and tibial physes in coronal and sagittal planes. c-d At the 4-month follow-up, there was a visible increase in the number and volume of tracts, which corresponded to a 3.8-cm increase in the child’s height. e-f At the 12-month visit, the tracts had become progressively more widespread and volumetrically increased, corresponding to 5 cm of growth––or an overall height gain of 8.8 cm over 1 year
Fig. 10
Fig. 10
Lower extremity PMC fiber tracts. a Tractography superimposed on sagittal MR images of the knee and coronal MR images of the ankle (b) from a 10-year-old girl during the growth spurt, versus tractography superimposed on sagittal MR images of the knee (c) and coronal MR images of the ankle (d) from a 12-year-old boy during peak growth. Comparing the images side by side showcases the generally more robust tractography patterns in males versus females, especially during peak growth. Note that the distal femoral tract count and volume are significantly larger than in the proximal tibia, which in turn has slightly larger tract count and volume than the distal tibia in both the female and male subjects; these differences are also qualitatively evident in the images
Fig. 11
Fig. 11
Fiber tracts correlate to height gain. Diffusion tensor imaging tractography overlaid on coronal MR-images in two 11-year-old males shows a male with larger tract volume and a dense tractography pattern who achieved a subsequent 4.4 cm of growth over 4-months (a) and a second male with a scant tract pattern who achieved only 1.2 cm of subsequent growth (b)
Fig. 12
Fig. 12
DTI correlation with other imaging modalities. “Coronal cross-section of the growth plate in multi-gradient echo 3D sequence on MRI, μCT, and histology (Masson’s trichrome staining) in each age group. The multi-gradient echo 3D sequence on MRI shows a high signal in the femoral (A) as well as the tibial (D) growth plate in the 16-wk-old rabbit; however, in the 24-wk-old, the growth plate is non-detectable (white arrows). μCT shows a low-attenuation growth plate in both the femur (B) and tibia (E). In the 20-wk-old rabbit, small bone bridging can be observed, and in the 24-wk-old rabbit, a completely fused growth plate is seen (red boxes). Histological representation shows the growth plate as a light blue line in 16- and 20-week-old rabbits in both the femur (C) and tibia (F). The light blue growth plate line cannot be seen in the 24-wk-old rabbit; instead, a dark blue sclerotic remnant of the growth plate is seen, which is sometimes referred to as a physeal scar (blue arrows).” From reference 19, open-access article permission not required [19]
Fig. 13
Fig. 13
DTI of the knee to evaluate GH response. Coronal MR images with diffusion tensor tractography superimposed in a 12-year-old male (a) and a 9-year-old female (b) before growth hormone was administered. Physes are intact in both patients on MR images; however, the fiber tractography was significantly different: tracts are abundant for the male (a) who grew 8 cm after 4 months of therapy, in contrast, to the scarce and thin fibers in the female (b) who achieved only 4 cm in the same time period
Fig. 14
Fig. 14
Longitudinal physeal-metaphyseal complex tractography changes in a growth hormone responder and representation of normalized tract volume and height. Growth hormone responder (Fig. 15a) displayed abundant and healthy-looking fiber tracts similar to those of healthy children after starting growth hormone treatment (Figs. 7, 8 and 9). Sagittal MR images with diffusion tensor tractography on a 12-year-old male before GH administration (left), and 4 months (center) and 8 months after (right). Tractography superimposed on sagittal 3D gradient echo images at the three times reveals scanty tracts before therapy (left). The number and density of the tracts increases progressively with growth hormone. Graphic representation of height and DTI changes. Values of stature and tract volume before therapy are normalized to 1. There is a 9% increase in height and a 220% increase in tract volume over an 8-month period
Fig. 15
Fig. 15
DTI in chronic repetitive physeal injury. DTI of the physis in an 11-year-old male with a medial femoral chronic repetitive physeal injury, genu varus deformity, and widening of the medial distal femoral physis shows femoral fiber tracts are abnormally scant and less dense than in the tibia
Fig. 16
Fig. 16
Salter-Harris fracture. a Sagittal proton-density (PD) image in a 12-year-old male with a Salter-Harris type 2 fracture affecting the medial distal femoral physis of the left knee. b Fiber tracts are absent where the fracture occurred and fiber tract length is decreased medially, adjacent to the fracture site. Longer tracts are seen laterally, farther from the fracture
Fig. 17
Fig. 17
Physeal segmentation using artificial intelligence. a An AI-generated femoral ROI (pink) versus (d) manually drawn ROI (turquoise) in a 14-year-old male. a-c Both AI-generated ROI and the resultant tractography are identical to the manually drawn ROI (d-f). The AI-generated ROI was obtained after training a U-net transformer model for automated segmentation of the femur physis
Fig. 18
Fig. 18
Hypophosphatasia. DTI in a 14-year-old male with hypophosphatasia with mild genotypic expression, short stature, and a delayed bone age of 12.5 years-old. Radiographs and MR images were unremarkable. Fiber tract pattern consists of predominantly green fibers interspersed with blue and red fiber tracts, with no clear directional pattern, which reflects physeal-metaphyseal complex structural disorganization in the context of a child with defective bone mineralization

Comment in

References

    1. Nguyen JC, Markhardt BK, Merrow AC, Dwek JR (2017) Imaging of pediatric growth plate disturbances. RadioGraphics 37(6):1791–1812. 10.1148/rg.2017170029 - DOI - PubMed
    1. Jaimes C, Berman JI, Delgado J et al. (2014) Diffusion-tensor imaging of the growing ends of long bones: pilot demonstration of columnar structure in the physis and metaphysis of the knee. Radiology 273(2):491–501. 10.1148/radiol.14132136 - DOI - PubMed
    1. Kvist O (2022) Magnetic resonance imaging and advanced imaging assessment of the growth plate in the adolescent and young adult. Karolinska Institute Press, Stockholm
    1. Kvist O, Dorniok T, Sanmartin Berglund J et al. (2023) DTI assessment of the maturing growth plate of the knee in adolescents and young adults. Eur J Radiol. 162:110759. 10.1016/j.ejrad.2023.110759 - DOI - PubMed
    1. Bedoya MA, Delgado J, Berman JI et al. (2017) Diffusion-tensor imaging of the physis: a possible biomarker for skeletal growth-experience with 151 children. Radiology 284(1):210–218. 10.1148/radiol.2017160681 - DOI - PubMed

LinkOut - more resources