. 2023 Sep 1;20(1):114.
doi: 10.1186/s12984-023-01240-6.

Validating the measurement of upper limb sensorimotor behavior utilizing a tablet in neurologically intact controls and individuals with chronic stroke

Affiliations

Validating the measurement of upper limb sensorimotor behavior utilizing a tablet in neurologically intact controls and individuals with chronic stroke

Devin Sean Austin et al. J Neuroeng Rehabil. .

Abstract

Background: Intact sensorimotor function of the upper extremity is essential for successfully performing activities of daily living. After a stroke, upper limb function is often compromised and requires rehabilitation. To develop appropriate rehabilitation interventions, sensitive and objective assessments are required. Current clinical measures often lack precision and technological devices (e.g. robotics) that are objective and sensitive to small changes in sensorimotor function are often unsuitable and impractical for performing home-based assessments. Here we developed a portable, tablet-based application capable of quantifying upper limb sensorimotor function after stroke. Our goal was to validate the developed application and accompanying data analysis against previously validated robotic measures of upper limb function in stroke.

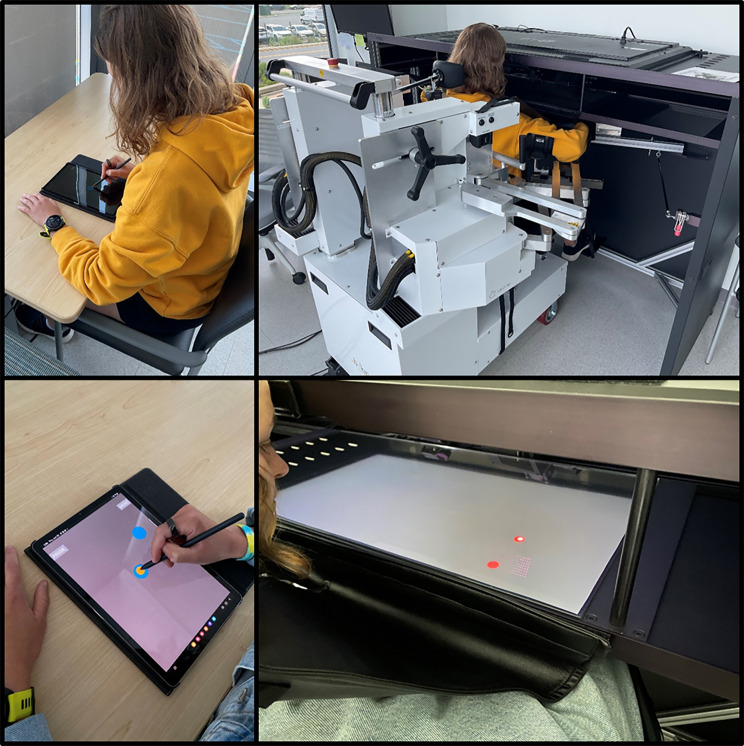
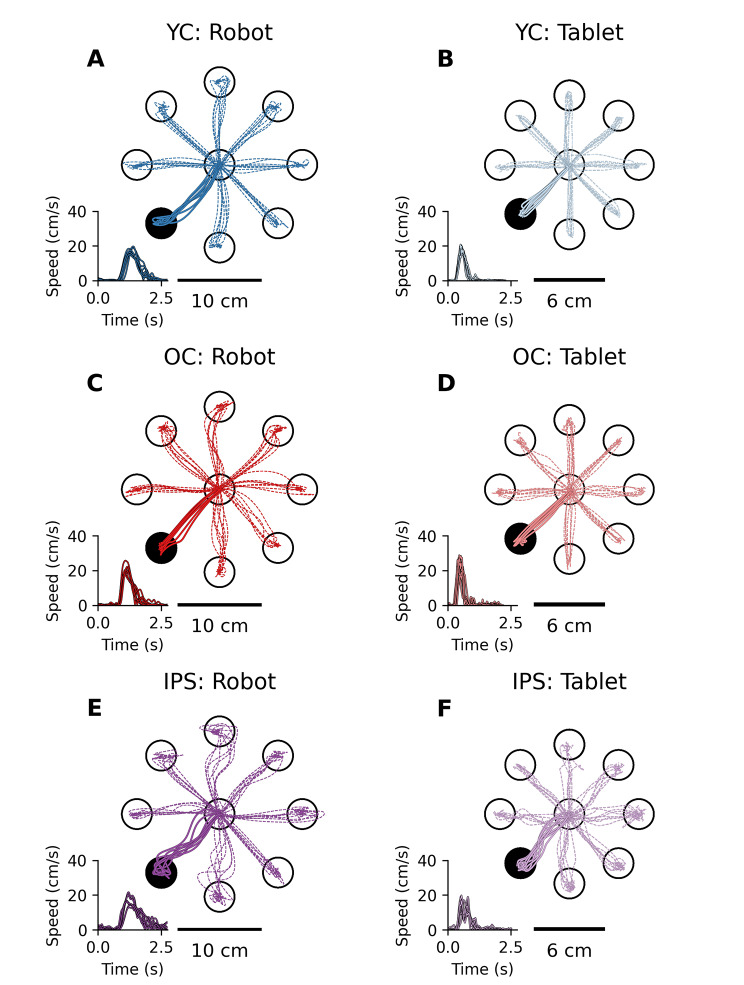
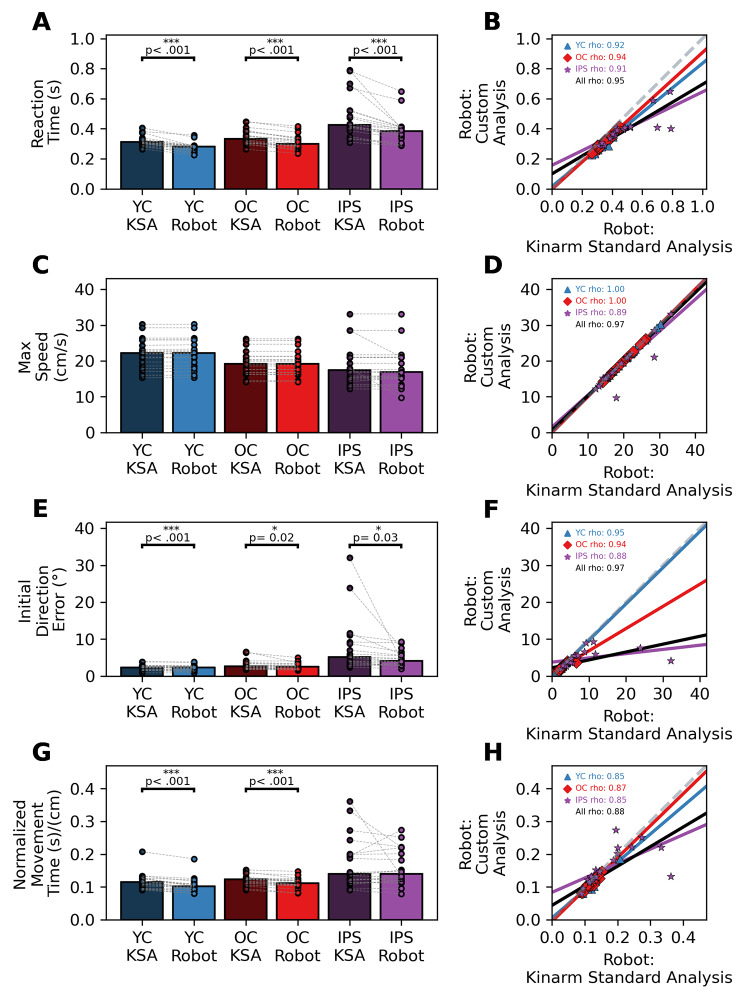
Methods: Twenty individuals with stroke, twenty age-matched older controls, and twenty younger controls completed an eight-target Visually Guided Reaching (VGR) task using a Kinarm Robotic Exoskeleton and a Samsung Galaxy Tablet. Participants completed eighty trials of the VGR task on each device, where each trial consisted of making a reaching movement to one of eight pseudorandomly appearing targets. We calculated several outcome parameters capturing various aspects of sensorimotor behavior (e.g., Reaction Time, Initial Direction Error, Max Speed, and Movement Time) from each reaching movement, and our analyses compared metric consistency between devices. We used the previously validated Kinarm Standard Analysis (KSA) and a custom in-house analysis to calculate each outcome parameter.

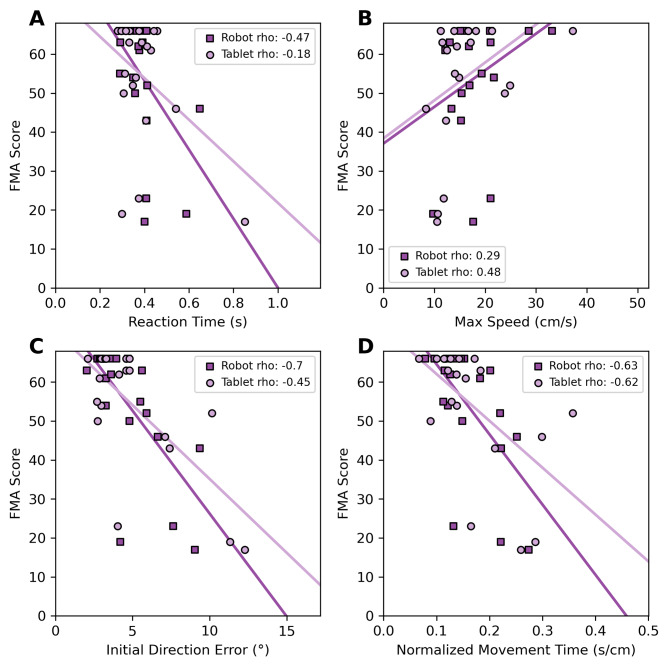
Results: We observed strong correlations between the KSA and our custom analysis for all outcome parameters within each participant group, indicating our custom analysis accurately replicates the KSA. Minimal differences were observed for between-device comparisons (tablet vs. robot) in our outcome parameters. Additionally, we observed similar correlations for each device when comparing the Fugl-Meyer Assessment (FMA) scores of individuals with stroke to tablet-derived metrics, demonstrating that the tablet can capture clinically-based elements of upper limb impairment.

Conclusions: Tablet devices can accurately assess upper limb sensorimotor function in neurologically intact individuals and individuals with stroke. Our findings validate the use of tablets as a cost-effective and efficient assessment tool for upper-limb function after stroke.

Keywords: Assessment; Reaching; Robotics; Sensorimotor; Stroke; Tablet.


Conflict of interest statement

The authors declare no competing interests.

Figures

Fig. 1
Fig. 1
Experimental setups for tablet and robot devices
Fig. 2
Fig. 2
Hand paths for 3 exemplar participants from each group using each device. The lines represent hand paths come from 80 trials of the VGR task with the Kinarm Robotic Exoskeleton (left column) and the Samsung Galaxy Tablet (right column). (A) Performance of a Young Control (YC) participant (24 years old, Right, M) in the Kinarm Robotic Exoskeleton (average Reaction Time = 0.26 s, average Initial Direction Error = 2.03°, Max Speed = 22 cm/s, Movement Time = 1.01 s). (B) Performance of the same YC participant in A, but with the VGR tablet task (Reaction Time = 0.28 s, Initial Direction Error = 2.67°, Max Speed = 20.40 cm/s, Movement Time = 0.68 s). (C) Performance of an Older Control (OC) participant (69 years old, Right, Female) in the Kinarm Robotic Exoskeleton (Reaction Time = 0.29 s, Initial Direction Error = 2.25°, Max Speed = 19.10 cm/s, Movement Time = 1.10 s). (D) Performance of the same OC participant in C, but with the VGR tablet task (Reaction Time = 0.29 s, Initial Direction Error = 2.15°, Max Speed = 25.20 cm/s, Movement Time = 0.48 s). (E) Performance of an Individual Post Stroke (IPS) participant (62 Years old, Right Hand Dominant, Male, Right hemisphere of stroke, FMA = 46) in the Kinarm Robotic Exoskeleton (Reaction Time = 0.65 s, Initial Direction Error = 6.62°, Max Speed = 13.36 cm/s, Movement Time = 2.52 s). (F) Performance of the same IPS participant in E, but with the VGR tablet task (Reaction Time = 0.30 s, Initial Direction Error = 7.10°, Max Speed = 8.33 cm/s, Movement Time = 1.79 s). Velocity profiles in the lower left corner of each axis represent hand speeds associated with reaches to the black target. The reported results in legend are from the custom VGR analysis
Fig. 3
Fig. 3
Differences and relationships between outcome measures obtained by the Kinarm Standard Analyses (KSA) and our custom analyses (Robot) for younger controls (YC), older controls (OC), and individuals post-stroke (IPS). The left column shows bar graphs and individual markers to represent both group and individual performance. Dashed lines between markers are used connect participants between devices. Differences between analyses were determined using Paired Permutation Tests. If differences between analyses are observed, p values are shown above the comparison. The right column shows correlations between both analyses’ outcome measures for each group. All in the figure legend represents collapsed groups. Markers represent an individual’s performance and solid lines represent fits using bootstrapped parameters obtained from performing Ordinary Least Squares on each group. (A) Average Reaction Time comparisons between the KSA and custom analysis for YC (KSA: 0.32 s, Robot: 0.28 s), OC (KSA: 0.35 s, Robot: 0.31 s), and IPS (KSA: 0.48 s, Robot: 0.39 s). (C) Average Max Speed comparisons between the KSA and custom analysis for YC (KSA: 22.17 cm/s, Robot: 22.18 cm/s), OC (KSA: 19.45 cm/s, Robot: 19.45 cm/s), and IPS (KSA: 18.89 cm/s, Robot: 18.18 cm/s). (E) Average Initial Direction Error comparisons between the KSA and custom analysis for YC (KSA: 2.38°, Robot: 2.26°), OC (KSA: 3.02°, Robot: 2.67°), and IPS (KSA: 7.89°, Robot: 4.74°). (G) Average Normalized Movement Time comparisons between the KSA and custom analysis for YC (KSA: 0.12 s/cm, Robot: 0.11 s/cm), OC (KSA: 0.12 s/cm, Robot: 0.11 s/cm), and IPS (KSA: 0.17 s/cm, Robot: 0.16 s/cm)
Fig. 4
Fig. 4
The relationships between outcome measures of the Kinarm Robotic Exoskeleton (Robot) and a Samsung Galaxy Tablet (Tablet) for younger controls (YC), older controls (OC), and individuals with stroke (IPS). The left column shows bar graphs and individual markers to represent both group and individual performance respectfully. Dashed lines between markers are used to track outcome measures calculated across devices. Differences between devices were determined using Paired Permutation Tests. If differences between devices were observed, p values are shown above the comparison. The right column shows correlations between both devices’ outcome measures for each group. All in the figure legend represents collapsed groups. Markers represent an individual’s performance and solid lines represent fits using bootstrapped parameters obtained from performing Ordinary Least Squares on each group. (A) Average Reaction Time comparisons between devices for YC (Robot: 0.28 s, Tablet: 0.27 s), OC (Robot: 0.31 s, Tablet: 0.31 s), and IPS (Robot: 0.39 s, Tablet: 0.39 s). (C) Average Max Speed comparisons between devices for YC (Robot: 22.18 cm/s, Tablet: 25.16 cm/s), OC (Robot: 10.45 cm/s, Tablet: 17.43 cm/s), and IPS (Robot: 18.18 cm/s, Tablet: 16.09). (E) Average Initial Direction Error comparisons between devices for YC (Robot: 2.26°, Tablet: 2.53°), OC (Robot: 2.68°, Tablet: 2.82°), and IPS (Robot: 4.74°, Tablet: 5.05°). (G) Average Normalized Movement Time comparisons between the KSA and custom analysis for YC (Robot: 0.11 s/cm, Tablet: 0.09 s/cm), OC (Robot: 0.11 s/cm, Tablet: 0.12 s/cm), and IPS (Robot: 0.16 s/cm, Tablet: 0.17 s/cm)
Fig. 5
Fig. 5
The relationship between outcome parameters obtained from each device and FMA scores for our individuals with stroke. Markers represent individual performance from each device and solid lines represent fits using bootstrapped parameters obtained from performing Ordinary Least Squares on each group. Both the Spearman Correlation Coefficients and associated p values are reported for each device in the legend of the figure. While similarities in device performance are further evidenced by the similar correlations of each FMA score comparison, the influence of the FMA’s ceiling effect is highlighted

References

    1. Tsao CW, Aday AW, Almarzooq ZI, Alonso A, Beaton AZ, Bittencourt MS, Boehme AK, Buxton AE, Carson AP, Commodore-Mensah Y, Elkind MSV, Evenson KR, Eze-Nliam C, Ferguson JF, Generoso G, Ho JE, Kalani R, Khan SS, Kissela BM, Knutson KL, Levine DA, Lewis TT, Liu J, Loop MS, Ma J, Mussolino ME, Navaneethan SD, Perak AM, Poudel R, Rezk-Hanna M, Roth GA, Schroeder EB, Shah SH, Thacker EL, VanWagner LB, Virani SS, Voecks JH, Wang NY, Yaffe K, Martin SS, on behalf of the American Heart Association Council on Epidemiology and Prevention Statistics Committee and Stroke Statistics Subcommittee. Heart Disease and Stroke Statistics—2022 Update: A Report From the American Heart Association. Circulation [Internet]. 2022 Feb 22 [cited 2022 Jul 26];145(8). 10.1161/CIR.0000000000001052. - PubMed
    1. Rathore SS, Hinn AR, Cooper LS, Tyroler HA, Rosamond WD. Characterization of incident stroke signs and symptoms: findings from the atherosclerosis risk in Communities Study. Stroke. 2002;33(11):2718–21. - PubMed
    1. Kwakkel G, Kollen BJ, van der Grond J, Prevo AJH. Probability of regaining dexterity in the Flaccid Upper Limb: impact of severity of Paresis and Time since Onset in Acute Stroke. Stroke. 2003;34(9):2181–6. - PubMed
    1. Wade DT, Langton-Hewer R, Wood VA, Skilbeck CE, Ismail HM. The hemiplegic arm after stroke: measurement and recovery. J Neurol Neurosurg Psychiatry. 1983;46(6):521–4. - PMC - PubMed
    1. Heller A, Wade DT, Wood VA, Sunderland A, Hewer RL, Ward E. Arm function after stroke: measurement and recovery over the first three months. J Neurol Neurosurg Psychiatry. 1987;50(6):714–9. - PMC - PubMed

Publication types