. 2023 Sep 1;20(1):198.
doi: 10.1186/s12974-023-02865-z.

Chemogenetic activation of locus coeruleus neurons ameliorates the severity of multiple sclerosis

Affiliations

Chemogenetic activation of locus coeruleus neurons ameliorates the severity of multiple sclerosis

Alejandro Torrillas-de la Cal et al. J Neuroinflammation. .

Abstract

Background: Most current disease-modifying therapies approved for multiple sclerosis (MS) are immunomodulatory drugs that counteract the aberrant activity of the immune system. Hence, new pharmacological interventions that drive anti-inflammatory activity and neuroprotection would represent interesting alternative therapeutic approaches or complementary strategies to treat progressive forms of MS. There is evidence of reduced noradrenaline levels and alterations to locus coeruleus (LC) noradrenergic neurons in MS patients, as well as in animal models of this disease, potentially factors contributing to the pathophysiology. Drugs that enhance noradrenaline appear to have some beneficial effects in MS, suggesting their potential to dampen the underlying pathology and disease progression.

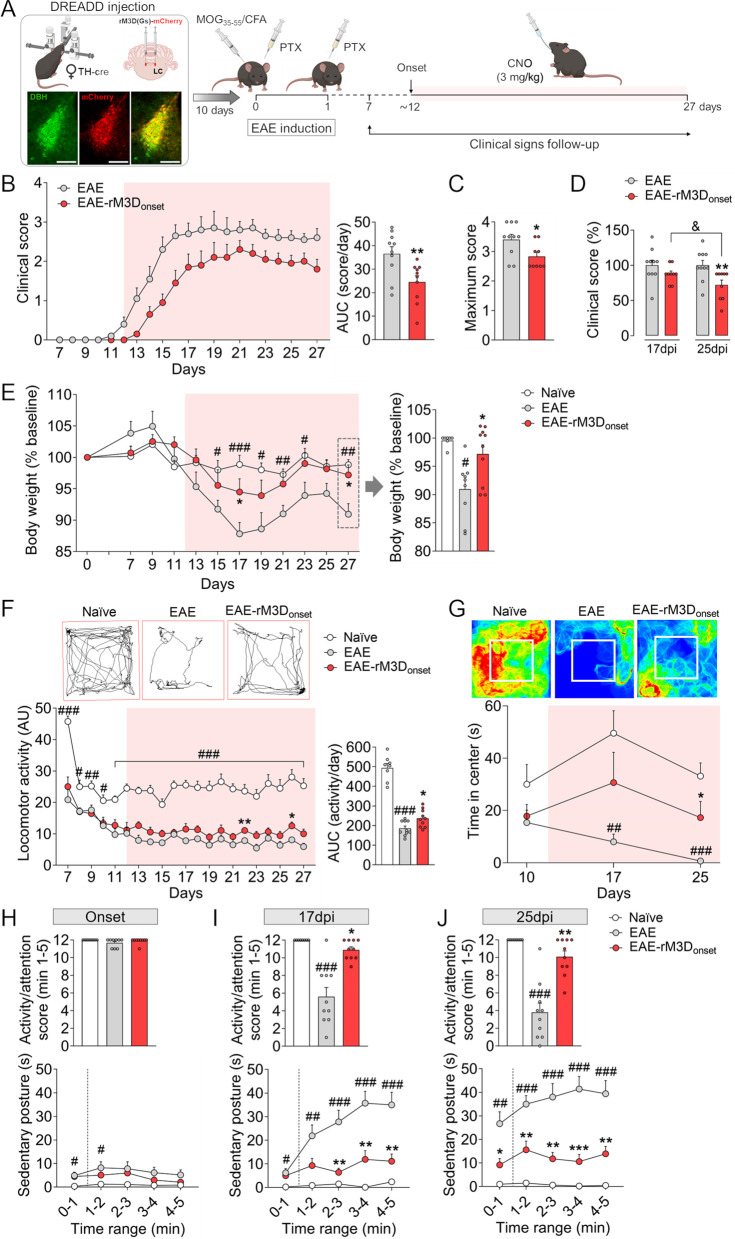
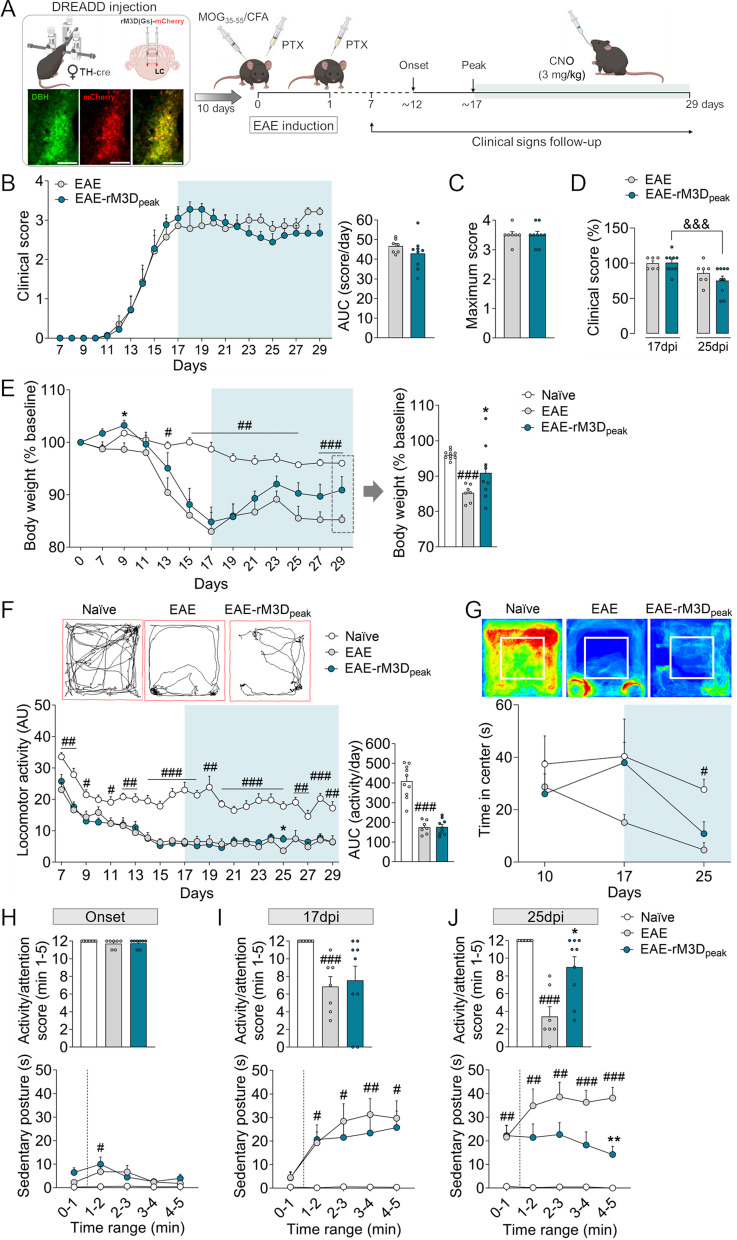
Methods: Therefore, we explored the consequences of chronic LC noradrenergic neurons activation by chemogenetics in experimental autoimmune encephalomyelitis (EAE) mice, the most widely used experimental model of MS. LC activation from the onset or the peak of motor symptoms was explored as two different therapeutic approaches, assessing the motor and non-motor behavioral changes as EAE progresses, and studying demyelination, inflammation and glial activation in the spinal cord and cerebral cortex during the chronic phase of EAE.

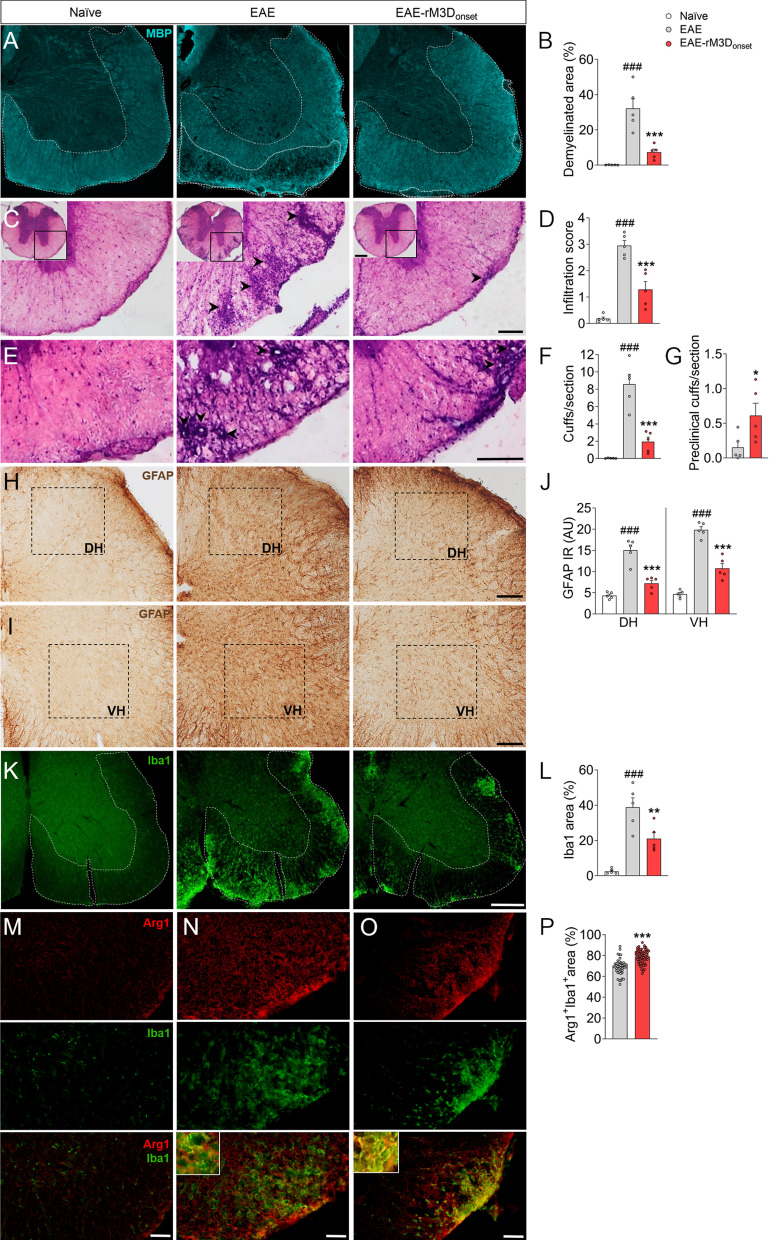
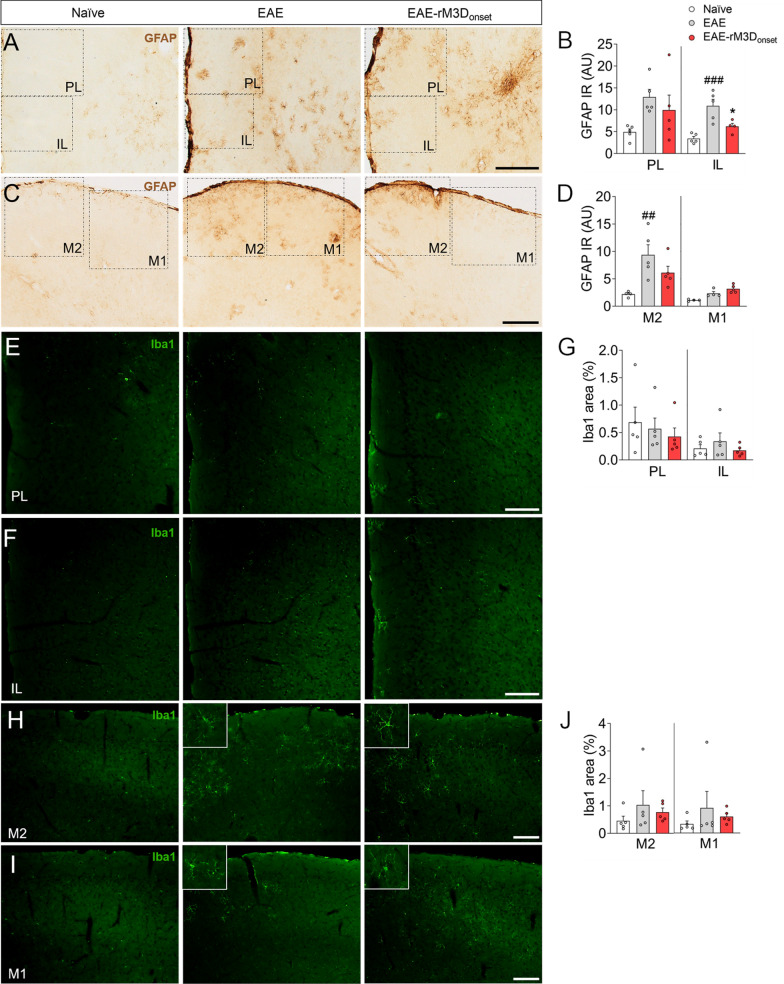
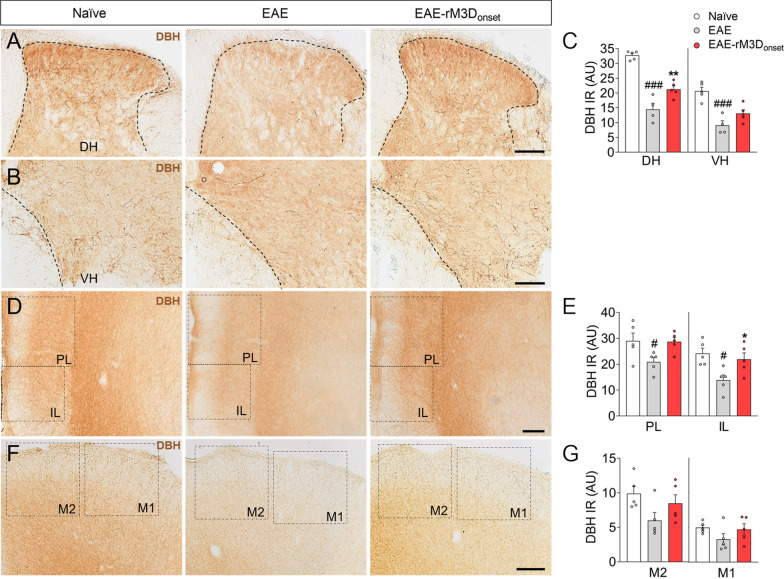
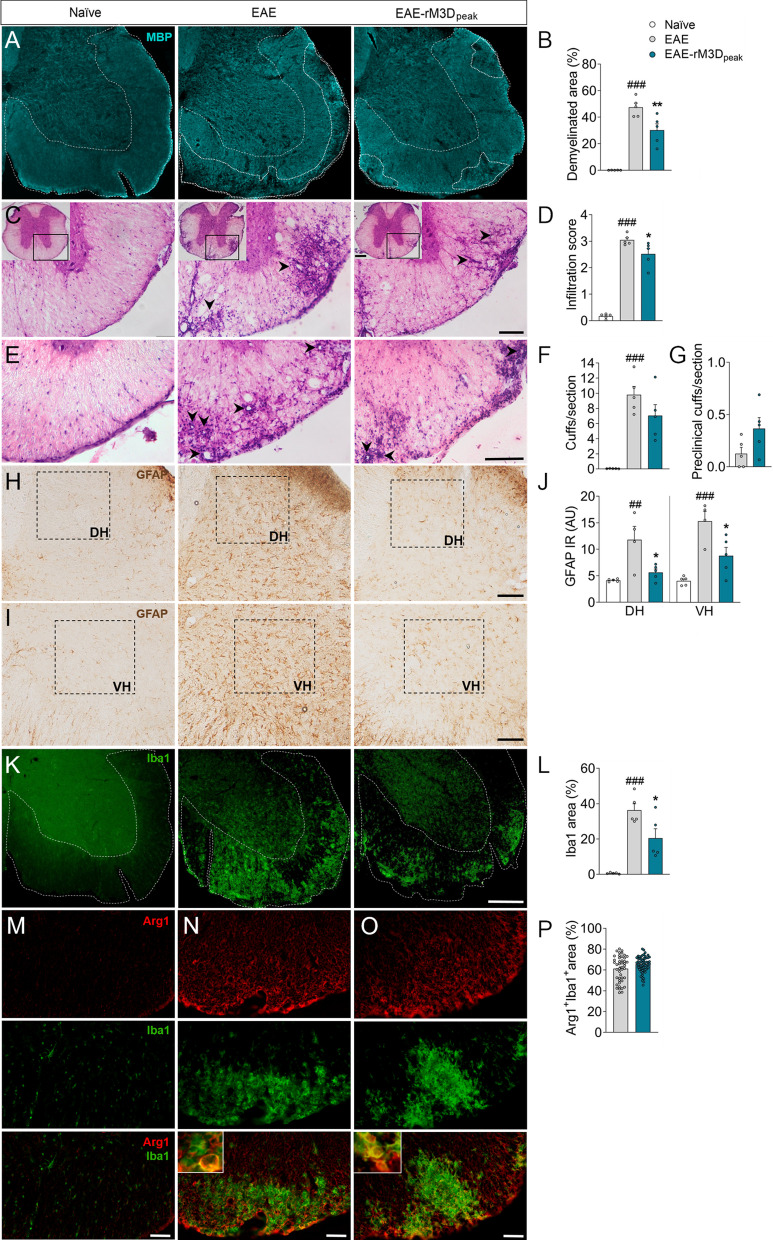
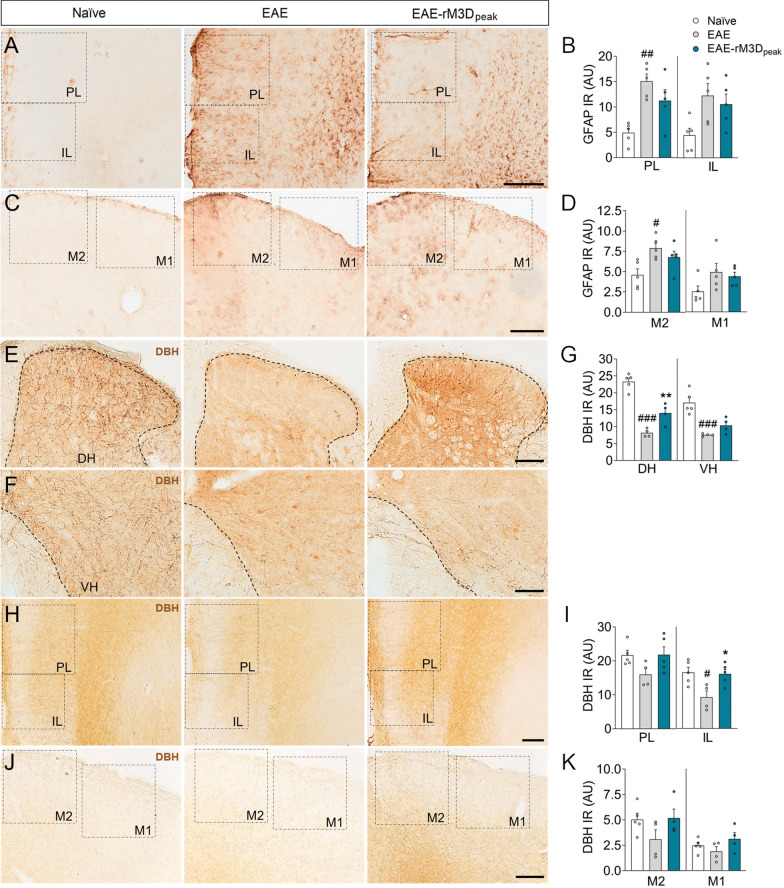
Results: LC activation from the onset of motor symptoms markedly alleviated the motor deficits in EAE mice, as well as their anxiety-like behavior and sickness, in conjunction with reduced demyelination and perivascular infiltration in the spinal cord and glial activation in the spinal cord and prefrontal cortex (PFC). When animals exhibited severe paralysis, LC activation produced a modest alleviation of EAE motor symptoms and it enhanced animal well-being, in association with an improvement of the EAE pathology at the spinal cord and PFC level. Interestingly, the reduced dopamine beta-hydroxylase expression associated with EAE in the spinal cord and PFC was reversed through chemogenetic LC activation.

Conclusion: Therefore, clear anti-inflammatory and neuroprotective effects were produced by the selective activation of LC noradrenergic neurons in EAE mice, having greater benefits when LC activation commenced earlier. Overall, these data suggest noradrenergic LC neurons may be targets to potentially alleviate some of the motor and non-motor symptoms in MS.

Keywords: Experimental autoimmune encephalomyelitis; Locus coeruleus; Multiple sclerosis; Noradrenaline; Spinal cord.


Conflict of interest statement

The authors declare that they have no competing interests.

Figures

Fig. 1
Fig. 1
Chronic LC activation from the onset of motor symptoms affects EAE-induced behavioral changes. A Experimental timeline showing the design of the study to assess the effect of chronic LC activation from the onset of motor symptoms in EAE. Representative images showing mCherry (red) expression in DBH (green) in the LC. Scale bars: 100 µm. B Clinical score recorded daily through the course of EAE and their area under the curve (AUC) from the onset of motor deficit and CNO administration (shaded area). C The severity of EAE is expressed as the maximum clinical score achieved and D the percentage change relative to the 17 dpi EAE group, for both the peak (17 dpi) and the chronic (25 dpi) phases of EAE. E Body weight over the course of EAE expressed as the relative change from baseline (at the beginning of experiments) and that at the end of experiments (27 dpi). F Representative activity traces (chronic phase) and the spontaneous locomotor activity expressed as the total distance travelled (arbitrary units, AU), and the AUC from the onset of motor deficit and CNO administration (shaded area). G Representative heat maps (chronic phase) and the relative time spent in the central area of the arena before the onset of motor deficit and CNO administration (10 dpi), and at the peak (17 dpi) and chronic (25 dpi) phases of EAE. HJ Activity/attention score (above) and time spent in the sedentary posture (below) at H the onset, I and at the peak (17 dpi) and J in the chronic (25 dpi) phase of EAE. The data represent the mean + SEM and each point corresponds to an individual mouse (n = 8–10 per group). #p < 0.05, ##p < 0.01, ###p < 0.001 EAE versus naïve; *p < 0.05, **p < 0.01, ***p < 0.001 EAE-rM3Donset versus EAE; &p < 0.05 EAE-rM3Donset 25 dpi versus 17 dpi (Additional file 1: Table S2). Some elements of this figure were created with BioRender.com
Fig. 2
Fig. 2
Chronic LC activation from the onset of motor symptoms affects EAE-associated damage in spinal cord. A Representative images showing the demyelination in the lumbar spinal cord (cyan, MBP) and B its quantification, expressed as the percentage of area free of MBP in the ventral white matter. CG Perivascular infiltration in the thoracic spinal cord analyzed from C, E hematoxylin and eosin staining images and reflected as the D infiltration score, F perivascular cuffs and G preclinical cuffs. HJ Representative images showing astrocyte activation in the H dorsal and I ventral horns (DH, VH) of the lumbar spinal cord and a graph of the J GFAP immunoreactivity (arbitrary units, AU). K Representative immunofluorescence images showing Iba1 (green) expression in the lumbar spinal cord and L its quantification, expressed as the relative area of the ventral white matter expressing Iba1. M–O Representative immunofluorescence images of Arg1 (red) and Iba1 (green) and corresponding magnifications in the lumbar spinal cord and P their quantification, expressed as the percentage of area of the ventral white matter in which Arg1 and Iba1 co-localize relative to the total area occupied by Iba1. The data represent the mean + SEM and each point corresponds to an individual mouse except for P that represents a section (n = 5 per group except for P, 15 sections/animal (n = 3–4)). ###p < 0.001 EAE versus naïve; *p < 0.05, **p < 0.01, ***p < 0.001 EAE-rM3Donset versus EAE (Additional file 1: Table S3). Scale bars: A, K, 200 µm; C, E, H, I, 100 µm; (M, N, O), 50 µm. 250 µm magnification for the insets in C
Fig. 3
Fig. 3
Chronic LC activation from the onset of motor symptoms affects the cortical EAE-associated glial response. Representative images showing astrocyte activation in the A PL/IL and C M2/M1 cortices, and B, D the quantification of GFAP immunoreactivity (IR) in arbitrary units (AU). E-J Microglial activation reflected by Iba1 immunofluorescence (green) in the E PL, F IL, H M2 and I M1 cortices, and G, J the relative area of these brain regions stained for Iba1. The data represent the mean + SEM and each point corresponds to an individual mouse (n = 4–5 per group). ##p < 0.01, ###p < 0.001 EAE versus naïve (Additional file 1: Table S4). Scale bars: A, C, 200 µm; E, F, H, I, 100 µm
Fig. 4
Fig. 4
The effect of early chronic chemogenetic LC activation on noradrenergic projections. Representative images showing DBH-positive fibers in the A dorsal and B ventral horns (DH, VH) of the lumbar spinal cord, D PL/IL and F M2/M1 cortices, and C, E, G the quantification of DBH immunoreactivity (IR) in arbitrary units (AU). The data represent the mean + SEM and each point corresponds to an individual mouse (n = 4–5 per group). #p < 0.05, ###p < 0.001 EAE versus naïve; *p < 0.05, **p < 0.01, EAE-rM3Donset versus EAE (Additional file 1: Table S5). Scale bars: A, B, D, F, 100 µm
Fig. 5
Fig. 5
Chronic LC activation from the peak of motor symptoms affects EAE-induced behavioral alterations. A Experimental timeline showing the design of the study to assess the effect of chronic LC activation from the peak of motor symptoms in EAE. Representative images showing mCherry (red) expression in DBH (green) in the LC. Scale bars: 100 µm. B Clinical score recorded daily through the course of EAE and their area under the curve (AUC) from the peak of motor deficit and CNO administration (shaded area). C The severity of EAE is expressed as the maximum clinical score achieved and D percentage change relative to the 17 dpi EAE group, for both the peak (17 dpi) and the chronic (25 dpi) phases of EAE. E Body weight over the course of EAE expressed as the relative change from baseline (at the beginning of experiments) and at the end of experiments (29 dpi). F The representative activity traces (chronic phase) and the spontaneous locomotor activity expressed as the total distance travelled (arbitrary units, AU), and the AUC from the peak of the motor deficit and CNO administration (shaded area). G Representative heat maps (chronic phase) and the relative time spent in the central area of the arena before the onset of motor deficit and CNO administration (10 dpi), at the peak (17 dpi) and chronic (25 dpi) phases of EAE. HJ Activity/attention score (above) and the time spent in the sedentary posture (below) at H the onset, I the peak (17 dpi) and J in the chronic (25 dpi) phase of EAE. The data represent the mean + SEM and each point corresponds to an individual mouse (n = 6–10 per group). #p < 0.05, ##p < 0.01, ###p < 0.001 EAE versus naïve; *p < 0.05, **p < 0.01 EAE-rM3Donset versus EAE; &&&p < 0.001 EAE-rM3Donset 25 dpi versus 17 dpi (Additional file 1: Table S6). Some elements of this figure were created with BioRender.com
Fig. 6
Fig. 6
Chronic LC activation from the peak of the EAE motor symptoms affects the spinal cord. A Representative images showing the demyelination in the lumbar spinal cord (cyan, MBP) and B its quantification expressed as the percentage of area free of MBP in the ventral white matter. CG Perivascular infiltration in the thoracic spinal cord analyzed from C, E hematoxylin and eosin staining images and reflected as the D infiltration score, F perivascular cuffs and G preclinical cuffs. HJ Representative images showing astrocyte activation in the H dorsal and I ventral horns (DH, VH) of the lumbar spinal cord, and a graph of the J GFAP immunoreactivity (IR) in arbitrary units (AU). K Representative immunofluorescence images showing Iba1 (green) expression in the lumbar spinal cord and L its quantification, expressed as the relative area of the ventral white matter expressing Iba1. M–O Representative immunofluorescence images of Arg1 (red) and Iba1 (green) and corresponding magnifications in the lumbar spinal cord and P their quantification, expressed as the percentage of area of the ventral white matter in which Arg1 and Iba1 co-localize relative to the total area occupied by Iba1. The data represent the mean + SEM and each point corresponds to an individual mouse for P that represents a section (n = 4–5 per group except for P, 15 sections/animal (n = 3–4)). ##p < 0.01; ###p < 0.001 EAE versus naïve; *p < 0.05, **p < 0.01 EAE-rM3Dpeak versus EAE (Additional file 1: Table S7). Scale bars: A, K, 200 µm; C, E, H, I, 100 µm; M, N, O, 50 µm. 250 µm insets in C
Fig. 7
Fig. 7
The effect of late chronic LC activation on cortical astrocyte activation and noradrenergic projections. Representative images showing astrocyte activation in the A PL/IL and C M2/M1 cortices, and B, D the quantification of GFAP immunoreactivity (IR) in arbitrary units (AU). Representative images showing DBH positive fibers in E the dorsal and F ventral horns (DH, VH) of the lumbar spinal cord, H PL/IL and J M2/M1 cortices, and G, I, K the quantification of DBH IR in AU. The data represent the mean + SEM and each point corresponds to an individual mouse (n = 4–5 per group). #p < 0.05; ###p < 0.001 EAE versus naïve; *p < 0.05, **p < 0.01 EAE-rM3Dpeak versus EAE (Additional file 1: Table S8). Scale bars: A, C, 200 µm; E, F, H, J, 100 µm

Similar articles

Cited by

References

    1. Murray TJ. Diagnosis and treatment of multiple sclerosis. BMJ. 2006;332(7540):525–527. - PMC - PubMed
    1. Walton C, King R, Rechtman L, Kaye W, Leray E, Marrie RA, et al. Rising prevalence of multiple sclerosis worldwide: Insights from the Atlas of MS, third edition. Mult Scler. 2020;26(14):1816–1821. - PMC - PubMed
    1. The Multiple Sclerosis International Federation. Atlas of MS. 3rd ed. 2020.
    1. Reich DS, Lucchinetti CF, Calabresi PA. Multiple sclerosis. N Engl J Med. 2018;378(2):169–180. - PMC - PubMed
    1. McGinley MP, Goldschmidt CH, Rae-Grant AD. Diagnosis and treatment of multiple sclerosis: a review. JAMA. 2021;325(8):765–779. - PubMed