. 2023 Sep 1;20(1):200.
doi: 10.1186/s12985-023-02167-z.

Studying temporal titre evolution of commercial SARS-CoV-2 assays reveals significant shortcomings of using BAU standardization for comparison

Collaborators, Affiliations

Studying temporal titre evolution of commercial SARS-CoV-2 assays reveals significant shortcomings of using BAU standardization for comparison

Inge Kroidl et al. Virol J. .

Abstract

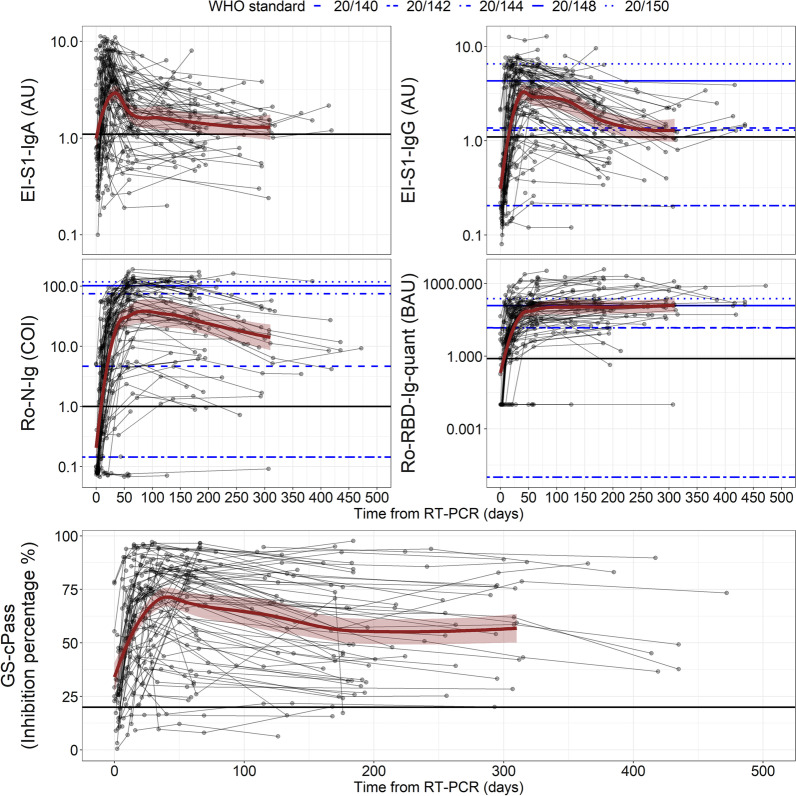
Background: Measuring specific anti-SARS-CoV-2 antibodies has become one of the main epidemiological tools to survey the ongoing SARS-CoV-2 pandemic, but also vaccination response. The WHO made available a set of well-characterized samples derived from recovered individuals to allow normalization between different quantitative anti-Spike assays to defined Binding Antibody Units (BAU).

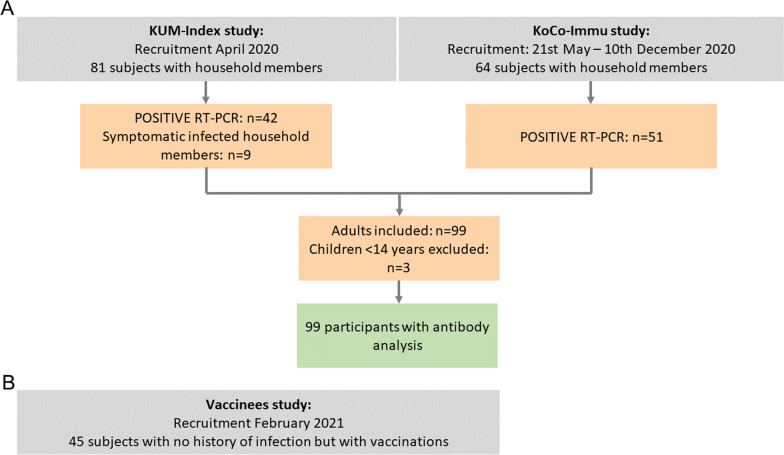
Methods: To assess sero-responses longitudinally, a cohort of ninety-nine SARS-CoV-2 RT-PCR positive subjects was followed up together with forty-five vaccinees without previous infection but with two vaccinations. Sero-responses were evaluated using a total of six different assays: four measuring anti-Spike proteins (converted to BAU), one measuring anti-Nucleocapsid proteins and one SARS-CoV-2 surrogate virus neutralization. Both cohorts were evaluated using the Euroimmun Anti-SARS-CoV-2-ELISA anti-S1 IgG and the Roche Elecsys Anti-SARS-CoV-2 anti-S1 assay.

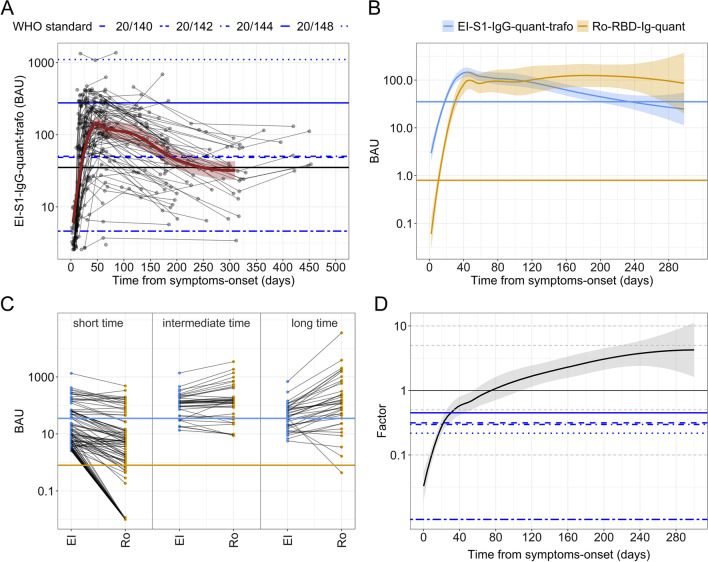
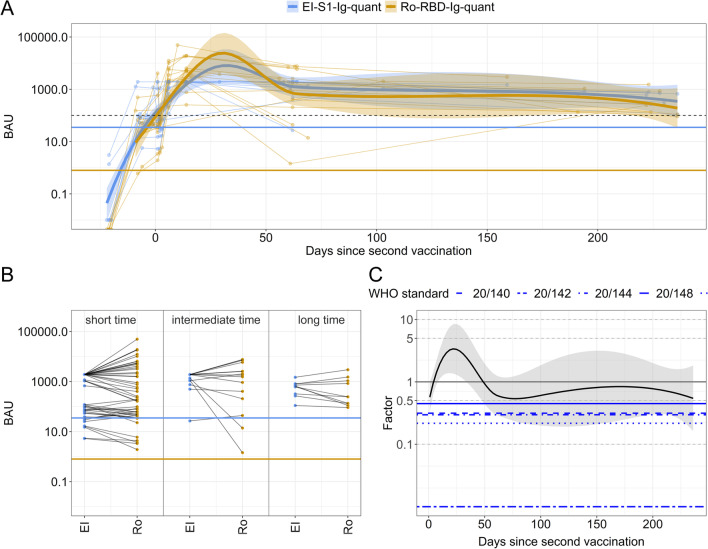
Results: In SARS-CoV-2-convalesce subjects, the BAU-sero-responses of Euroimmun Anti-SARS-CoV-2-ELISA anti-S1 IgG and Roche Elecsys Anti-SARS-CoV-2 anti-S1 peaked both at 47 (43-51) days, the first assay followed by a slow decay thereafter (> 208 days), while the second assay not presenting any decay within one year. Both assay values in BAUs are only equivalent a few months after infection, elsewhere correction factors up to 10 are necessary. In contrast, in infection-naive vaccinees the assays perform similarly.

Conclusion: The results of our study suggest that the establishment of a protective correlate or vaccination booster recommendation based on different assays, although BAU-standardised, is still challenging. At the moment the characteristics of the available assays used are not related, and the BAU-standardisation is unable to correct for that.

Keywords: Antibody; Binding antibody units; COVID-19; Nucleocapsid; RBD; SARS-CoV-2; Serology; Spike.


Conflict of interest statement

AW and MH report personal fees and non-financial support from Roche Diagnostics, LO reports non-financial support from Roche Diagnostics. AW, MH and LO report non-financial support from Euroimmun, non-financial support from Viramed, non-financial support from Mikrogen. AW, MH, LO report grants, non-financial support and other from German Centre for Infection Research DZIF, grants and non-financial support from Government of Bavaria, non-financial support from BMW, non-financial support from Munich Police, nonfinancial support and other from Accenture. MH and AW report personal fees and nonfinancial support from Dr. Box-Betrobox, non-financial support from Dr. Becker MVZ during the conduct of the study. AW is involved in other different patents and companies not in relation with the serology of SARS-CoV-2. AW reports personal fees and other from Haeraeus Sensors, nonfinancial support from Bruker Daltonics, all of which are outside the submitted work, and non-related to SARS-CoV-2.

Figures

Fig. 1
Fig. 1
Cohort flow chart. A Cohort of non-vaccinated SARS-CoV-2 RT-PCR positive subjects. Two recruitment strategies were used: fifty-one participants, who had a SARS CoV-2 infection in February/March 2020 were recruited in April 2020 together with their household members (KUM-Index-study). Forty-two of them had a positive PCR and additional 9 household members developed SARS CoV-2 specific antibodies. From 21 May till 10 December 2020 another fifty-one SARS-CoV-2 infected individuals were recruited as early as possible after their first positive RT-PCR (Koco19-Immu-Study). B Cohort of vaccinees. Forty-five participants with no history of infection but with two vaccinations were recruited
Fig. 2
Fig. 2
Longitudinal serological dynamics of SARS-CoV-2 RT-PCR positive cohort. Solid black horizontals line denote the cut-off for positivity. Blue lines represent the WHO reference panel for anti-SARS-CoV-2 immunoglobulin (NIBSC code 20/268). Each line represents one subject, the dots represent the individual samples. All assays were performed from the same sample in a head-to-head comparison. Top left: Euroimmun Anti Spike IgA; top right: Euroimmun Anti-Spike IgG; middle left: Roche Anti-Nucleocapsid; middle right: Roche Anti Spike/RBD; bottom: GenScript neutralization surrogate test
Fig. 3
Fig. 3
Comparison of quantitative serology of individual patients (PCR-positive cohort) over time for EI-S1-IgG-quant-trafo and Ro-RBD-Ig-quant. When assays are compared, the EI-S1-IgG-quant-trafo is represented in blue while Ro-RBD-Ig-quant in yellow. Blue lines represent the WHO reference panel for anti-SARS-CoV-2 immunoglobulin (NIBSC code 20/268). Solid horizontal lines represent the cut-off for positivity. A Longitudinal EI-S1-IgG-quant-trafo serology data over time. Each line represents one subject, the dots represent the individual samples. The red solid line shows the LOESS (locally estimated scatterplot smoothing or local regression) estimations with CI in translucent red. B Aggregated BAU value curves of the subjects over time for the two tests. EI-S1-IgG-quant-trafo rises faster, reaches similar values than Ro-RBD-Ig-quant between days 70 and 150 after infection and then drops to about 1/10th of the value observed in Ro-RBD-Ig-quant after one year (please note that here almost half of the samples measured in EI-S1-IgG-quant-trafo are already below the positivity threshold). C Parallel coordinate plot dividing the time from symptom onset into three intervals: short (0–20 days), intermediate (70–150 days) and long (170–250 days). EI denotes the EI-S1-IgG-quant-trafo assay while Ro represents the Ro-RBD-Ig-quant assay. D The Quotient of the two BAU values depicted in log10 scale over time (Ro-RBD-Ig-quant/EI-S1-IgG-quant-trafo). At the Factor Value of 1, the BAU values are identical. This occurs only in a short timeframe about 80 days post symptom onset
Fig. 4
Fig. 4
Comparison of individual Anti-S1 BAU values of vaccinees over time for EI-S1-IgG-quant and Ro-RBD-Ig-quant, respectively. The time zero denotes the day of the second vaccination. The EI-S1-IgG-quant is represented in blue while Ro-RBD-Ig-quant in yellow. Solid horizontal lines represent the cut-off for positivity. A Longitudinal serology data of subjects over time. Each line represents one subject, the dots represent the individual samples. The solid lines show the LOESSs (locally estimated scatterplot smoothing or local regressions) estimations with CI as a shadowed region. The dashed black lines denotes 250 BUS/mL. B Parallel coordinate plot dividing the time from symptom onset into three intervals: short (0–20 days), intermediate (70–150 days) and long (170–250 days). EI denotes the EI-S1-IgG-quant assay while RO the Ro-RBD-Ig-quant assay. C Quotient of the two BAU values depicted in log10 scale over time (Ro-RBD-Ig-quant/EI-S1-IgG-quant-trafo); at 1, the BAU values are identical. Blue lines represent the WHO reference panel for anti-SARS-CoV-2 immunoglobulin (NIBSC code 20/268)

References

    1. WHO. Coronavirus disease (COVID-19) pandemic. 01 July 2022. https://www.who.int/emergencies/diseases/novel-coronavirus-2019.
    1. CSSE. Center for Systems Science and Engineering (CSSE) at Johns Hopkins University (JHU) COVID-19 dashboard. 01 July 2022 https://coronavirus.jhu.edu/map.html.
    1. Lumley SF, et al. Antibody status and incidence of SARS-CoV-2 infection in health care workers. N Engl J Med. 2021;384(6):533–540. doi: 10.1056/NEJMoa2034545. - DOI - PMC - PubMed
    1. Letizia AG, et al. SARS-CoV-2 seropositivity and subsequent infection risk in healthy young adults: a prospective cohort study. Lancet Respir Med. 2021;9(7):712–720. doi: 10.1016/S2213-2600(21)00158-2. - DOI - PMC - PubMed
    1. Polack FP, et al. Safety and efficacy of the BNT162b2 mRNA Covid-19 vaccine. N Engl J Med. 2020;383(27):2603–2615. doi: 10.1056/NEJMoa2034577. - DOI - PMC - PubMed

Publication types