

Associations between anthropometric parameters and immune-phenotypical characteristics of circulating Tregs and serum cytokines
- PMID: 37659013
- PMCID: PMC10539435
- DOI: 10.1007/s00011-023-01777-1
Associations between anthropometric parameters and immune-phenotypical characteristics of circulating Tregs and serum cytokines
Abstract
Objective: To investigate the associations between several anthropometric parameters and regulatory T cells (Tregs) and circulating cytokines in a population-based cohort.
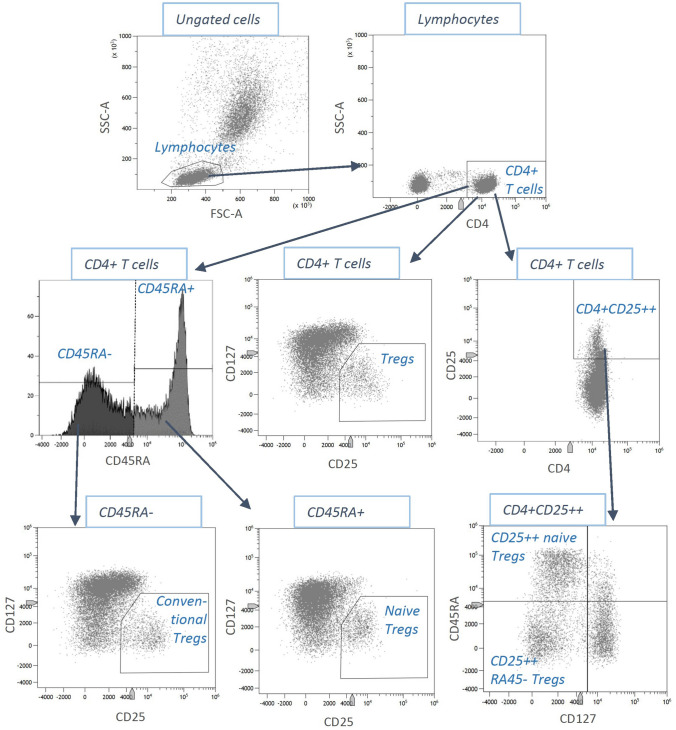
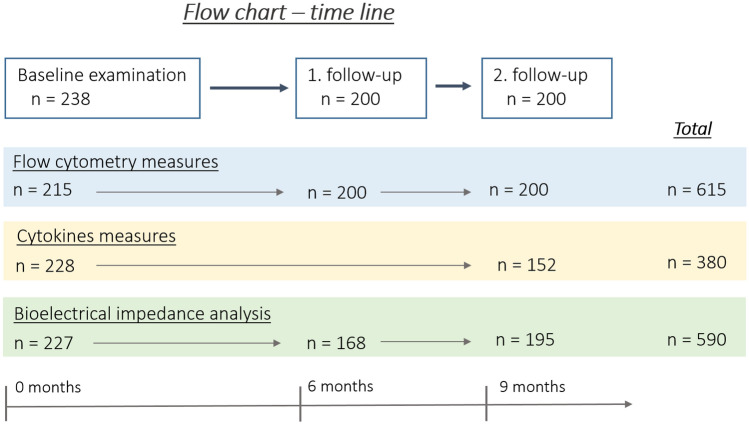
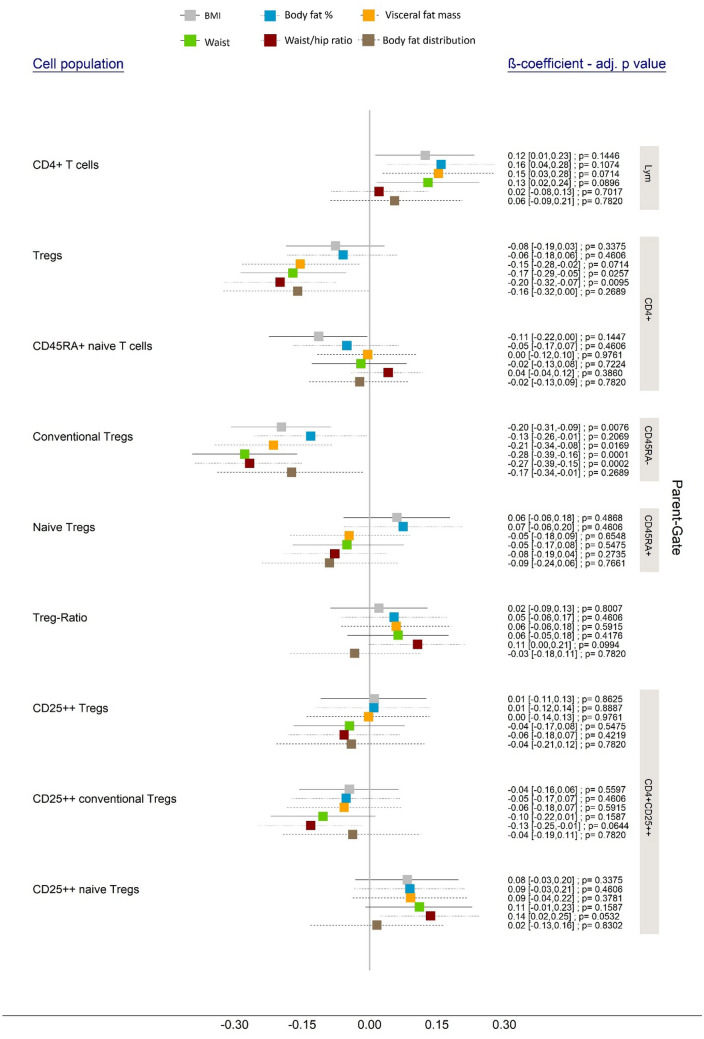
Methods: Between 2018 and 2021, a total of 238 participants were examined up to three times within the scope of the MEGA study in Augsburg, Germany. Tregs were analyzed using flow cytometry and the serum concentrations of 52 cytokines were determined. Anthropometric parameters were measured, using also bioelectrical impedance analysis: body mass index (BMI), relative total body fat, relative visceral adipose tissue (rVAT), waist circumference (WC), waist-to-hip ratio (WHR) and body fat distribution. Associations were analyzed using linear mixed models with random intercept (Tregs) and conventional linear regression models (cytokines).
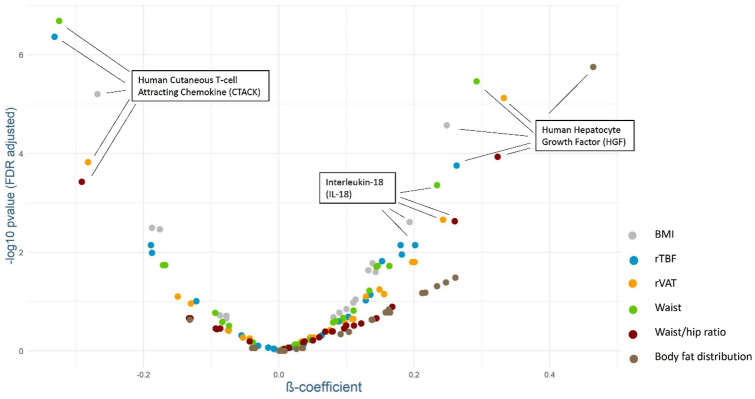
Results: WC and WHR were inversely associated with the general Treg subset. Four parameters (BMI, rVAT, WC, and WHR) were inversely associated with the conventional Treg population. Three cytokines showed a particularly strong association with several anthropometric parameters: the cutaneous T-cell attracting chemokine was inversely associated with anthropometric parameters, while hepatocyte growth factor and interleukine-18 showed positive associations.
Conclusions: Anthropometric measures are associated with Tregs and serum cytokine concentrations revealing new important interconnections between obesity and the adaptive immune system.
Keywords: BMI; Body fat; Cytokines; Flow cytometry; Regulatory T cells; Visceral fat.
© 2023. The Author(s).
Conflict of interest statement
None declared.
Figures
Similar articles
-
Obesity diagnosis and mortality risk based on a body shape index (ABSI) and other indices and anthropometric parameters in university students.Rocz Panstw Zakl Hig. 2019;70(3):267-275. doi: 10.32394/rpzh.2019.0077. Rocz Panstw Zakl Hig. 2019. PMID: 31515986
-
Longitudinal association of measures of adiposity with serum antioxidant concentrations in postmenopausal women.Eur J Clin Nutr. 2016 Jan;70(1):47-53. doi: 10.1038/ejcn.2015.74. Epub 2015 May 27. Eur J Clin Nutr. 2016. PMID: 26014267
-
Markers of adiposity in HIV/AIDS patients: Agreement between waist circumference, waist-to-hip ratio, waist-to-height ratio and body mass index.PLoS One. 2018 Mar 22;13(3):e0194653. doi: 10.1371/journal.pone.0194653. eCollection 2018. PLoS One. 2018. PMID: 29566089 Free PMC article.
-
New indexes of body fat distribution and sex-specific risk of total and cause-specific mortality: a prospective cohort study.BMC Public Health. 2018 Apr 2;18(1):427. doi: 10.1186/s12889-018-5350-8. BMC Public Health. 2018. PMID: 29609587 Free PMC article.
-
Anthropometric and adiposity indicators and risk of type 2 diabetes: systematic review and dose-response meta-analysis of cohort studies.BMJ. 2022 Jan 18;376:e067516. doi: 10.1136/bmj-2021-067516. BMJ. 2022. PMID: 35042741 Free PMC article.
Cited by
-
Dual-release hydrocortisone treatment improves serum and peripheral blood mononuclear cell inflammatory and immune profiles in patients with autoimmune primary adrenal insufficiency.Front Immunol. 2025 Jan 23;16:1489254. doi: 10.3389/fimmu.2025.1489254. eCollection 2025. Front Immunol. 2025. PMID: 39917303 Free PMC article.
References
-
- Muc Da Encarnacao M, NCD Risk Factor Collaboration Worldwide trends in body-mass index, underweight, overweight, and obesity from 1975 to 2016: a pooled analysis of 2416 population-based measurement studies in 128·9 million children, adolescents, and adults. Lancet (London, England) 2017;390:2627–2642. doi: 10.1016/S0140-6736(17)32129-3. - DOI - PMC - PubMed
-
- Apovian CM. Obesity: definition, comorbidities, causes, and burden. Am J Manag Care. 2016;22:s176–s185. - PubMed
-
- Pischon T, Nimptsch K. Obesity and risk of cancer: an introductory overview, recent results in cancer research. Fortschritte der krebsforschung. Progres Recherch Cancer. 2016;208:1–15. - PubMed
MeSH terms
Substances
LinkOut - more resources
Full Text Sources
Medical
