. 2023 Sep 26;42(9):113051.
doi: 10.1016/j.celrep.2023.113051. Epub 2023 Sep 1.

Autophagy-mediated surveillance of Rim4-mRNA interaction safeguards programmed meiotic translation

Affiliations

Autophagy-mediated surveillance of Rim4-mRNA interaction safeguards programmed meiotic translation

Rudian Zhang et al. Cell Rep. .

Abstract

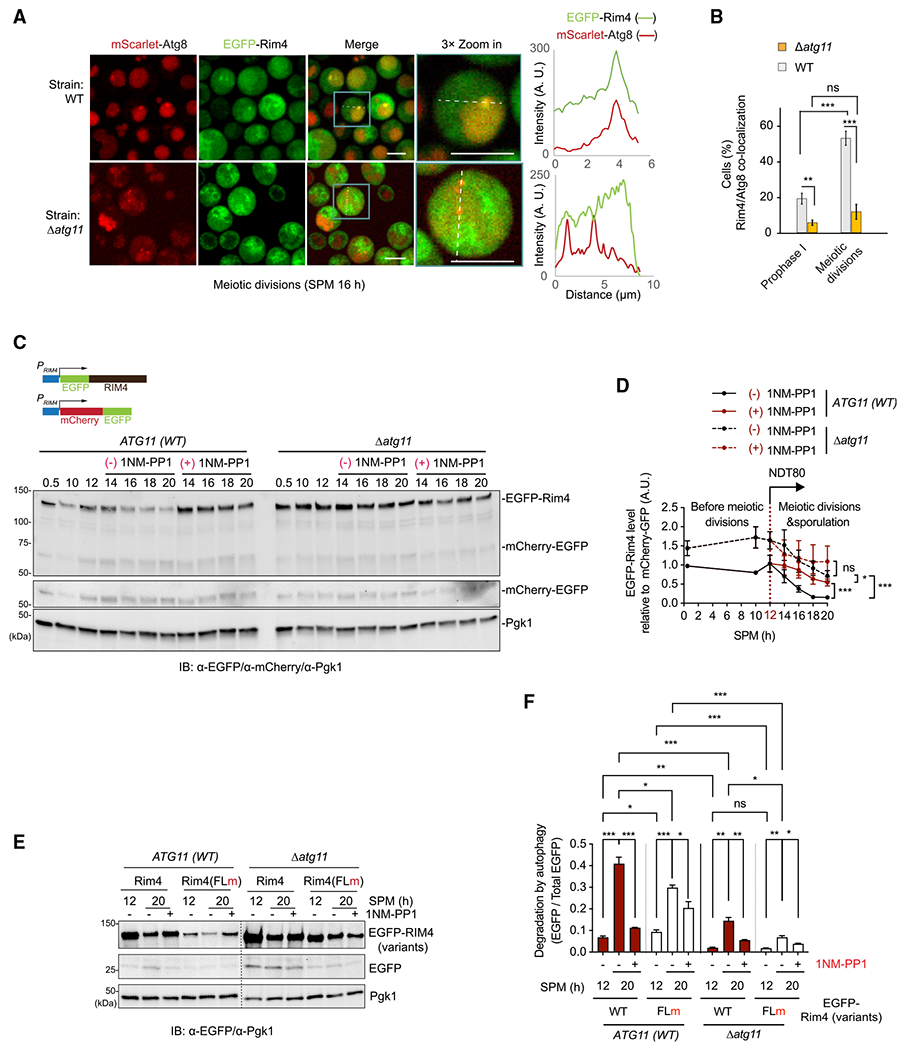
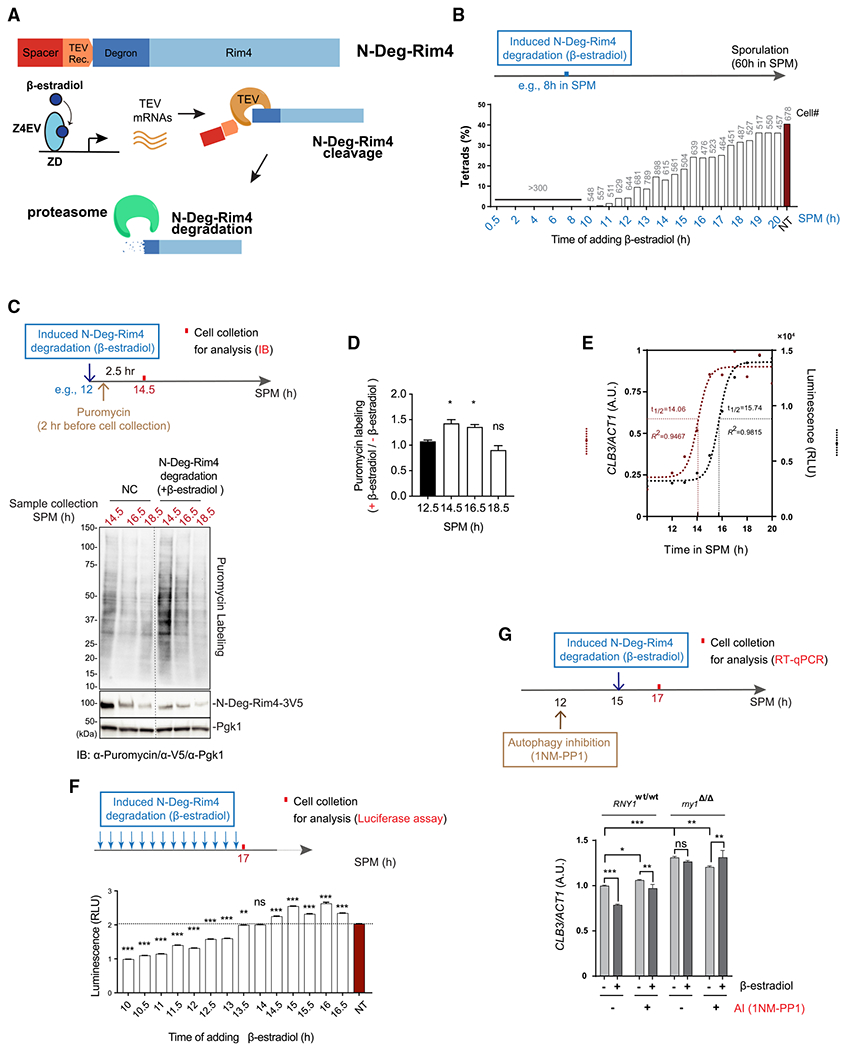
In yeast meiosis, autophagy is active and essential. Here, we investigate the fate of Rim4, a meiosis-specific RNA-binding protein (RBP), and its associated transcripts during meiotic autophagy. We demonstrate that Rim4 employs a nuclear localization signal (NLS) to enter the nucleus, where it loads its mRNA substrates before nuclear export. Upon reaching the cytoplasm, active autophagy selectively spares the Rim4-mRNA complex. During meiotic divisions, autophagy preferentially degrades Rim4 in an Atg11-dependent manner, coinciding with the release of Rim4-bound mRNAs for translation. Intriguingly, these released mRNAs also become vulnerable to autophagy. In vitro, purified Rim4 and its RRM-motif-containing variants activate Atg1 kinase in meiotic cell lysates and in immunoprecipitated (IP) Atg1 complexes. This suggests that the conserved RNA recognition motifs (RRMs) of Rim4 are involved in stimulating Atg1 and thereby facilitating selective autophagy. Taken together, our findings indicate that autophagy surveils Rim4-mRNA interaction to ensure stage-specific translation during meiosis.

Keywords: Atg1; Atg11; CP: Cell biology; Pab1; RBP; Rim4; mRNAs; meiosis; nucleus; selective autophagy.


Conflict of interest statement

Declaration of interests The authors declare no competing interests.

Figures

Figure 1.
Figure 1.. An NLS promotes Rim4 nuclear import
(A) Schematic representation of Rim4 variants, featuring three RNA recognition motifs (RRMs) and a C-terminal low-complexity domain (LCD). (B) (Left) Representative prophase I cell FM images of EGFP-Rim4 (green) with (top) mScarlet-Nup49 (red) or (bottom) mScarlet-Pab1 (red). White dashed circle outlines potential nuclear membrane; blue dashed circle indicates vacuole area. (Right) EGFP-Rim4 fluorescence signals along the line traversing the cell (3× zoom) were plotted against distance, with bracket marking nucleus. (C) Prophase I cell lysates were fractionated into nuclear and cytosolic parts and immunoblotted using indicated antibodies. Histone H2B (Htb2) and Nup49 (Nup49-EGFP) served as nuclear markers. Shown are representative IB images from two independent experiments. (D) Recovery of nuclear mScarlet-Rim4 following photobleaching, assessed by FRAP. (Top) Schematic showing the entire nucleus being photobleached in cells at prophase I (12 h in sporulation medium [SPM]), followed by recovery. (Bottom) The nuclear/cytoplasmic mScarlet-Rim4 ratio plotted to recovery time. The green dot represents the initial ratio, while the red dot represents the first recording (3 s) after photobleaching (n = 4, mean [solid line] ± standard error [SE, dashed line]). Video S1 shows representative cells examined by FRAP. (E) (Left) Representative FM images showing the intracellular distribution of indicated EGFP-Rim4 variants and EGFP, expressed under Rim4 promoter (green). Nup49-mScarlet (red) marks the nucleus. (Right) Quantification as described in (B). (F) Quantitative analysis of (E), showing the nuclear/cytoplasmic EGFP-Rim4 variants ratio (median ± 95% confidence interval [CI]) from three independent experiments with the number of analyzed cells listed under each column (Dunn’s test; ns, no significance; ***p < 0.001). Strain details in Table S1. Scale bars, 5 μm.
Figure 2.
Figure 2.. mRNA binding is a prerequisite for efficient Rim4 nuclear export
(A) Schematic illustration of the Rim4 variants characterized in this figure. NESHst2 is a nuclear export signal derived from Hst2, while Ist2-pm represents a plasma membrane-binding domain derived from Ist2. (B) Indicated recombinant proteins immobilized on antibody(α-His)-coated Protein G Dynabeads, pulled down in vitro-transcribed CLB3 mRNA. RT-qPCR data (mean ± SE) from three independent experiments were analyzed by unpaired Welch’s t test. (C) (Left) Representative FM images and (right) quantification, as described (Figure 1E). Scale bar, 5 μm. (D) Quantitative and statistical analysis of (C), as described (Figure 1F). n = 3 independent experiments. (E) The intracellular distribution of EGFP-Rim4 variants (green) in cells at 12 h in SPM, as described (Figure 1E) with the exception that DRAQ5, a membrane-permeable far-red DNA dye, marked the nucleus. Note the enhanced EGFP-Rim4-Ist2-pm signal on the PM. Scale bar, 5 μm. (F) Quantitative and statistical analysis of (E), as described (Figure 1F). n = 3 independent experiments. (G) The sporulation efficiency was determined for the cells imaged in (E), shown as mean ± SE and analyzed by unpaired Welch’s t test (n = 3 independent experiments). The number of cells counted for each strain is indicated below the corresponding columns. ns, not significant; *p < 0.05; **p < 0.01; ***p < 0.001.
Figure 3.
Figure 3.. The cytosolic Rim4-mRNA complex resists autophagy
(A) The time course of CLB3 reporter expression, as luminescence signals (blue line) (CLB3-NanoLuciferase activity, described in Figure S3A), EGFP-Rim4 protein levels (black), and Clb3-FLAG protein levels (orange line) via IB (representative IB images in Figure S3B) in cells examined along meiosis and sporulation. (Left) 1NM-PP1 omitted (−AI); (right) autophagy was inhibited by 5 μM 1NM-PP1 (Atg1-as inhibitor) at 12 h in SPM (+AI). Data were from three independent experiments, mean ± SE. (B) Cell extracts derived from meiotic prophase I cells that express Rim4-V5 and Pab1-FLAG were IP with magnetic protein G-bead-immobilized α-FLAG antibody, followed by IB with indicated antibodies. If applied, RNase A was incubated with cell lysate for 20 min on ice before being IP. (C–E) FM analysis of synchronized meiotic cells expressing EGFP-Rim4 and mScarlet-Pab1. Shown are (C) representative images; yellow arrow, co-localized mScarlet-Pab1 and EGFP-rim4 puncta; white arrow, mScarlet-Pab1 or EGFP-Rim4 puncta without co-localization; blue dashed box, cells 3× zoomed in on right; scale bars, 5 μm; (D) percentage of cells with mScarlet-Pab1 or EGFP-Rim4 puncta; and (E) percentage of cells with Rim4/Pab1 co-localization. Only cells that carry EGFP-Rim4 puncta were analyzed here. ND, non-detectable (n ≥ 300 cells, three replicate experiments, mean ± standard deviation [SD], unpaired t test). (F–H) FM and statistical analysis of synchronized meiotic cells, as described (C–E), except that cells were expressing EGFP-Rim4 and mScarlet-Atg8. Shown are (F) representative images, (G) percentage of cells with EGFP-Rim4 puncta, and (H) percentage of cells with Rim4/Atg8 co-localization. (I) IB of whole-cell lysate with indicated antibodies showing Pab1-3Flag and Rim4-V5 protein level during GAL-NDT80-synchronized meiosis and sporulation at indicated time points. +β-estradiol (at 12 h in SPM), induced entry of meiosis I; −β-estradiol, prophase I arrest. (J) The cell lysate of indicated strains before (12 h in SPM) or after (20 h in SPM) meiotic divisions were analyzed by immunoblotting with α-EGFP antibody to detect the EGFP-Rim4 and free EGFP. Pgk1, loading control. (K) Quantitative and statistical analysis of (J) (n = 3 independent experiments; unpaired Welch’s t test). The EGFP process, an indication of vacuolar (autophagic) degradation of EGFP-Rim4, was measured by dividing the free EGFP by the total EGFP signal. ns, not significant; *p < 0.05; **p < 0.01; ***p < 0.001.
Figure 4.
Figure 4.. Selective autophagy temporally degrades Rim4
(A) (Left) Representative FM images of synchronized meiotic ATG11 WT and Δatg11 cells (t = 16 h in SPM) that express mScarlet-Atg8 (pATG8: mScarlet-Atg8) and EGFP-Rim4 (pRIM4: EGFP-Rim4). (Right) The fluorescence intensity of mScarlet-Atg8 and EGFP-Rim4 along a dashed line crossing cytosolic mScarlet-Atg8 puncta. Scale bars, 5 μm. (B) Graph of mScarlet-Atg8/EGFP-Rim4 puncta co-localization analysis during prophase I and the meiotic divisions in ATG11 WT and Δatg11 cells, shown as mean ± SD (n ≥ 300 cells, three replicate experiments, unpaired t test). ATG11 WT data are as Figure 3C. (C) (Top) Schematic of a cell harboring one allele of EGFP-Rim4 and one allele of EGFP-mCherry, both under the RIM4 promoter. (Bottom) IB analysis of the whole-cell lysate collected at indicated time points from the GAL-NDT80 strains with WT ATG11 (ATG11 WT) or ATG11 deletion (Δatg11), with (+1NM-PP1) or without (−1NM-PP1) added at 12 h in SPM to inhibit autophagy; 1 μM β-estradiol was added to induce NDT80 expression at 12 h in SPM. Pgk1, loading control. (D) Quantitative analysis of (C), showing intracellular EGFP-Rim4 level relative to mCherry-EGFP level (IB: α-EGFP). Data (mean ± SE) were from five independent experiments. The statistical analysis during meiotic divisions (after 12 h in SPM, NDT80 induction) were performed using two-way ANOVA. (E) ATG11 WT or Δatg11 cells carrying EGFP-Rim4 variants (EGFP-Rim4 and EGFP-Rim4[FLm]) were harvested before (12 h in SPM) or after (20 h in SPM) NDT80 induction. The whole-cell lysates were analyzed by IB with indicated antibodies. (F) Quantitative and statistical analysis of (E) (mean ± SE, n = 3 independent experiments; unpaired Welch’s t test), showing free EGFP to total EGFP ratio. ns, not significant; *p < 0.05; **p < 0.01; ***p < 0.001.
Figure 5.
Figure 5.. The Rim4, but not Rim4-mRNA, stimulates Atg1 activity in vitro
(A) Schematic of the chemical-genetic strategy for monitoring Atg1-as (analog-sensitive Atg1, Atg1-M102G) kinase activation by a selective autophagy substrate in vitro. Atg1-as thiophosphorylates its substrates, including itself (Atg1 auto-phosphorylation), with a bulky ATPγS analog (N6-PhEt-ATP-γ-S). Thiophosphorylated substrates of Atg1-as can be alkylated with para-nitrobenzyl mesylate (PNBM) and then detected by IB using anti-thiophosphate ester (α-thioP) antibodies. (B) Atg1-as cells arrested at prophase I (12 h in SPM without adding β-estradiol; GAL-NDT80 system) were collected to prepare cell lysates for in vitro Atg1-as activity assays, as described (A). Before the Atg1-as kinase assay, cell lysates were supplemented with the indicated amount of recombinant Rim4-6×His or premixed Rim4-6×His/total yeast RNAs (final [RNA] = 41.7 ng/μL). After the reaction, the whole-cell lysates were subjected to IB with indicated antibodies. Atg1-as-p, Atg1-as auto-phosphorylation; Hxk1, loading control; NC, no supplemented ATP in cell lysate. (C) Quantitative analysis of (B), showing sums of anti-ThioP signal intensities above the 50-kDa mark line, shown as mean ± SD from three independent experiments, unpaired t test. (D and E) In vitro Atg1-as kinase assay using IP-purified FLAG-Atg1-as complex. FLAG-Atg1-as protein was affinity purified (IP: α-FLAG) from extracts of meiotic cells arrested at prophase I and then supplemented with indicated recombinant Rim4-6×His ([Rim4] from 0.15 to 1.2 μM), followed by Atg1-as kinase assay as shown in (A). Myelin basic protein (MBP) is a generic in vitro kinase substrate. (D) Representative IB images of Atg1-as kinase reaction using indicated antibody. (E) Quantitative analysis of Atg1-as kinase activity, presented as the IB values of thiophosphorylated FLAG-Atg1-as (FLAG-Atg1-as-p) and MBP (MBP-p). The FLAG-Atg1-as-mediated thiophosphorylation of MBP and FLAG-Atg1-as exhibits a similar dependence on Rim4 concentration in the reaction. (F–I) In vitro Atg1-as kinase assay using prophase I cell lysates, as in (A). The IB and quantitative analysis were performed as in (B) and (C), respectively, testing the effect of various amounts of supplemented Rim4(ΔC289)- 6×His (F and G) or Pab1-6×His (H and I), as compared to Rim4-6×His. ns, not significant; *p < 0.05; **p < 0.01; ***p < 0.001.
Figure 6.
Figure 6.. Timing of Rim4 degradation is strictly programmed to support meiosis and sporulation
(A) Schematic of inducible Rim4 proteasomal degradation. (Top) N-Deg-Rim4 with tobacco etch virus (TEV) recognition site to Rim4’s N terminus for TEV-mediated cleavage; (bottom) β-estradiol induces TEV expression (pZEV: TEV), leading to N-Deg-Rim4 cleavage, exposing an N-degron for stimulated proteasome-mediated Rim4 degradation. (B) Sporulation (tetrad formation) efficiency plotted to the timing of β-estradiol-induced N-Deg-Rim4 degradation. The precise cell numbers counted for each condition are shown above the columns. (C) N-Deg-Rim4 was induced to degrade by adding 1 μM β-estradiol 2.5 h prior the indicated cell collections. Intracellular protein synthesis was labeled by adding 10 μg/mL puromycin 30 min after applying β-estradiol and incubating for 2 h before cell collection. Whole-cell lysates were analyzed by IB analysis using indicated antibodies. (D) Quantitative analysis of (C), showing intracellular puromycin-labeling level (mean ± SE) after induced N-Deg-Rim4 degradation (+β-estradiol), relative to the mock treatment (−β-estradiol). IB (α-puromycin) signals (20–150 kDa) were summed and normalized by Pgk1 (α-Pgk1). Statistical analysis: n = 3 independent experiments, unpaired Welch’s t test. (E) Intracellular CLB3 mRNA level (RT-qPCR) and CLB3 reporter translation (luciferase assay) were plotted to time of cells in SPM. Sigmoidal regression was fitted to both sets of data and the t1/2 were calculated, showing a ~2-h gap between CLB3 transcription and translation. CLB3 mRNA peak was normalized to 1. (F) N-Deg-Rim4 cells in SPM with 1 μM α-estradiol added at indicated time points were collected at 17 h for CLB3 reporter luciferase assay, compared to the untreated (NT) group. Mean ± SE, n = 3 independent experiments, unpaired Welch’s t test. (G) Graph showing CLB3 mRNA levels in RNY1 WT (RNY1WT/WT) and RNY1 deletion (rny1Δ/Δ) cells at 17 h in SPM by RT-qPCR, under indicated conditions. b-Estradiol and 1NM-PP1 (autophagy inhibitor [AI]) were added at 15 h in SPM, 2 h before sample collection. Solvent (ethanol [EtOH] for β-estradiol, DMSO for 1NM-PP1) were used as mock. CLB3 mRNA level from untreated RNY1 WT (β-estradiol –, AI –) was normalized to 1. Mean ± SE n = 3 independent experiments, unpaired Welch’s t test. ns, not significant; *p < 0.05; **p < 0.01; ***p < 0.001.

Comment in

Similar articles

Cited by

References

    1. Wen FP, Guo YS, Hu Y, Liu WX, Wang Q, Wang YT, Yu HY, Tang CM, Yang J, Zhou T, et al. (2016). Distinct temporal requirements for autophagy and the proteasome in yeast meiosis. Autophagy 12, 671–688. 10.1080/15548627.2016.1149659. - DOI - PMC - PubMed
    1. Straub M, Bredschneider M, and Thumm M (1997). AUT3, a serine/threonine kinase gene, is essential for autophagocytosis in Saccharomyces cerevisiae. J. Bacteriol 179, 3875–3883. 10.1128/jb.179.12.3875-3883.1997. - DOI - PMC - PubMed
    1. Enyenihi AH, and Saunders WS (2003). Large-scale functional genomic analysis of sporulation and meiosis in Saccharomyces cerevisiae. Genetics 163, 47–54. - PMC - PubMed
    1. Piekarska I, Kucharczyk R, Mickowska B, Rytka J, and Rempola B (2010). Mutants of the Saccharomyces cerevisiae VPS genes CCZ1 and YPT7 are blocked in different stages of sporulation. Eur. J. Cell Biol 89, 780–787. 10.1016/j.ejcb.2010.06.009. - DOI - PubMed
    1. Sarkar S, Dalgaard JZ, Millar JBA, and Arumugam P (2014). The Rim15-endosulfine-PP2ACdc55 signalling module regulates entry into gametogenesis and quiescence via distinct mechanisms in budding yeast. PLoS Genet. 10, e1004456. 10.1371/journal.pgen.1004456. - DOI - PMC - PubMed

Publication types

MeSH terms

LinkOut - more resources