Comment
. 2023 Sep 26;42(9):113052.
doi: 10.1016/j.celrep.2023.113052. Epub 2023 Sep 1.

Regulation of Rim4 distribution, function, and stability during meiosis by PKA, Cdc14, and 14-3-3 proteins

Affiliations
Comment

Regulation of Rim4 distribution, function, and stability during meiosis by PKA, Cdc14, and 14-3-3 proteins

Rudian Zhang et al. Cell Rep. .

Abstract

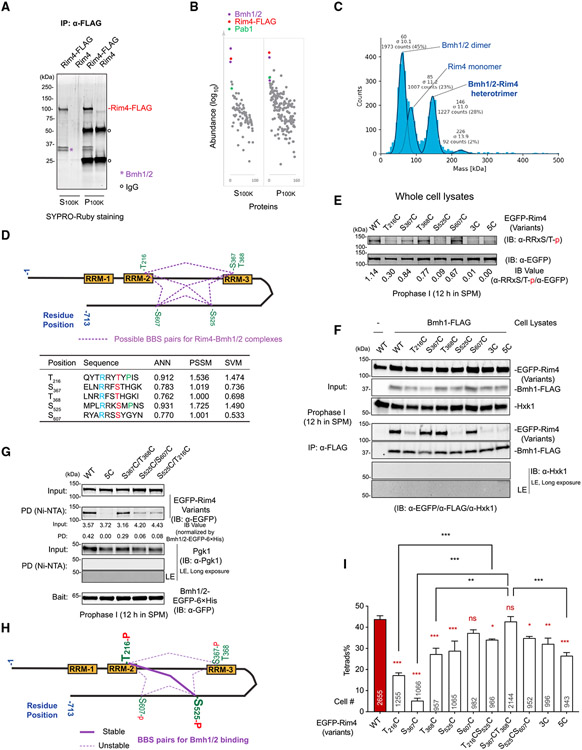
Meiotic gene expression in budding yeast is tightly controlled by RNA-binding proteins (RBPs), with the meiosis-specific RBP Rim4 playing a key role in sequestering mid-late meiotic transcripts to prevent premature translation. However, the mechanisms governing assembly and disassembly of the Rim4-mRNA complex, critical for Rim4's function and stability, remain poorly understood. In this study, we unveil regulation of the Rim4 ribonucleoprotein (RNP) complex by the yeast 14-3-3 proteins Bmh1 and Bmh2. These proteins form a Rim4-Bmh1-Bmh2 heterotrimeric complex that expels mRNAs from Rim4 binding. We identify four Bmh1/2 binding sites (BBSs) on Rim4, with two residing within the RNA recognition motifs (RRMs). Phosphorylation and dephosphorylation of serine/threonine (S/T) residues at these BBSs by PKA kinase and Cdc14 phosphatase activities primarily control formation of Rim4-Bmh1/2, regulating Rim4's subcellular distribution, function, and stability. These findings shed light on the intricate post-transcriptional regulatory mechanisms governing meiotic gene expression.

Keywords: 14-3-3 proteins; CP: Cell biology; Cdc14; PKA; Rim4; autophagy; de-phosphorylation; kinase; meiosis; phosphatase; phosphorylation.


Conflict of interest statement

Declaration of interests The authors declare no competing interests.

Figures

Figure 1.
Figure 1.. Site-specific phosphorylation regulates Rim4 subcellular distribution and function
(A) Top: Schematic of the Rim4 protein, highlighting RNA recognition motifs (RRMs) and serine/threonine (S/T) residues. Based on a previous proteomics study, red lines indicate phosphorylated S/T residues, gray lines represent unphosphorylated S/T residues, and blue lines indicate S/T residues in uncovered regions (gray rectangles). R1–R9 denote the regions used for subsequent phosphorylation analysis. The number of S/T residues in each region is indicated below. Bottom: prediction of Rim4 disordered regions using the DISOPRED3 program. The precision score reflects the disorder level of the local area. Unless indicated differently, all Rim4 variants in this study were tagged with EGFP at the N terminus. (B) Flow cytometry analysis of DNA content (2N versus 4N) in different Rim4 variants. Cells were collected at 12 h in SPM before NDT80 induction. All S/T residues in each region were mutated to alanine (A) or glutamic Acid (E). (C) Sporulation efficiency (percentage of tetrads) of the indicated Rim4 variants (mean ± standard error [SE]; statistical comparison of Rim4 variants with the wild type [WT] by Welch’s t test), with the number of total cells from 3 independent experiments listed below. (D) Top: Representative cell images for Rim4 at the indicated time in SPM. Bottom: intracellular distribution of EGFP-Rim4, depicted as fluorescence signals along a line traversing the cell (3× magnification). The brackets indicate the nucleus area based on Nup49-mScarlet signals. Scale bars, 2 μm. (E) Quantitative analysis of (D), showing the nuclear/cytoplasmic EGFP-Rim4 intensity ratio. The orange dashed line marks a ratio = 1. (F) Top: FM analysis showing the nuclear/cytoplasmic intensity ratio of EGFP-Rim4 variants in cells at 12 h in SPM, as performed in (E). The orange dashed line represents a value of 1. Center: representative cell images for each Rim4 variant (bottom) with intracellular distribution analysis as performed in (D). Scale bars, 2 μm. (E and F) Top: data were obtained from three independent experiments. The number of total cells analyzed is listed below. Red bars indicate median ± 95% confidence interval (CI) generated by GraphPad Prism 9 (see details in STAR Methods). Data were analyzed using Dunn’s test. ns, not significant; *p < 0.05, **p < 0.01, ***p < 0.001.
Figure 2.
Figure 2.. Regulation of Rim4 function by 14-3-3 proteins (Bmh1 and Bmh2)
(A and B) Identification of the Rim4 interactome by immunoprecipitation (IP) and mass spectrometry (MS). (A) IP of Rim4-FLAG from cell lysates collected at 12 h in SPM, followed by SDS-PAGE and staining with SYPRO-Ruby. Bmh1 and Bmh2 are marked by a purple asterisk. (B) Abundance of Rim4 interactome proteins identified by MS shown in a graph. (C) MP analysis of the cytosolic Rim4-FLAG complex from (A), displaying the number of contrast events related to molecular mass. The solid lines are Gaussian fits to the peaks. The mean and standard deviation (σ) of each Gaussian curve is shown above it, as is the number of counts accounting for the peak. (D) Schematic of 14-3-3 protein (Bmh1/2) binding sites (BBSs) on Rim4 predicted by the 14-3-3-Pred program. The prediction was made with three methods: artificial neural network (ANN; cutoff = 0.55), position-specific scoring matrix (PSSM; cutoff = 0.8), and support vector machine (SVM; cutoff = 0.25). Consensus binding site sequence R(blue)XXS/T(red)-XP(green) is indicated, with phosphorylated S/T residues (red) required for Bmh1/2 binding. Proline (P) at the +2 position is optional. Purple dashed lines represent possible Bmh1/2-Rim4 complexes based on phosphorylation states of the BBSs. (E) Immunoblotting (IB) of the indicated EGFP-Rim4 variants with S/T residues mutated into cysteine (C). Whole-cell lysates from prophase I were analyzed using the indicated antibodies. The numbers below the IB image quantify the level of phosphorylated Rim4 BBSs normalized by the level of Rim4, based on IB (α-RRxS/T-p/α-EGFP). (F) CoIP of the indicated EGFP-Rim4 variants with Bmh1-FLAG (pBMH1: Bmh1-FLAG) in prophase I cell lysates. (G) Ni-NTA (nickel-nitrilotriacetic acid) pulldown of EGFP-Rim4 variants with Bmh1/2-EGFP-His6 from prophase I cell lysates. (F) and (G) LE: long exposure. (H) Model depicting the possible phosphorylation status of the binding sites and Bmh1/2-Rim4 interaction in prophase I cells. BBS-T216 and BBS-S525 are the primary P-sites for stable Rim4-Bmh1/2 interaction (solid line), while contributions from other BBSs are weak or transient (dashed line). (I) Sporulation (tetrad formation) efficiency of EGFP-Rim4 variants and statistical analysis compared with WT Rim4, as described (Figure 1C). The asterisks in red indicate comparison with the WT. *p < 0.05, **p < 0.01, ***p < 0.001.
Figure 3.
Figure 3.. PKA stimulates Rim4-Bmh1/2 interaction by phosphorylating Rim4 at BBSs
(A) Sporulation (tetrad formation) efficiency of Tpk-as and WT strains, analyzed as in Figure 1C. The 1NM-PP1 treatment (10 μM) at multiple time points, which inhibits Tpk-as activity, is indicated in the top schematic. (B) Top: experimental design showing 1NM-PP1 treatment (10 μM, red rod) and sample collection (blue rod) at the indicated time points. Bottom: IB analysis of Tpk-as cell lysates at prophase I (12 h in SPM) or during meiotic divisions (14 h in SPM) with 1NM-PP1 or mock treatment. IB results show phosphorylated EGFP-Rim4 (EGFP-Rim4-p) detected by α-RRxS/T-p in red, total EGFP-Rim4 detected by α-EGFP in green, and the merged image. Pgk1 served as a loading control. (C) Quantification of EGFP-Rim4-p signals from (B) normalized to EGFP-Rim4 signals (IB, α-RRxS/T-p/α-EGFP). (D) IB of whole-cell lysates with α-RRxS/T-p antibody and Ponceau S staining under the indicated conditions, as in (B), but showing the whole IB images. Red asterisks indicate EGFP-Rim4-p positions. (E) Quantification of IB signals between 20 and 150 kDa from (D), normalized by Ponceau S signals. Data are compared with the reference group (Pro-I without 1NM-PP1) and presented as fold change. (F) In vitro phosphorylation of recombinant Rim4-His6 by PKA (catalytic subunit), detected by IB with the α-RRxS/T-p antibody. Rim4(5C)-His6 served as a negative control. Ponceau S staining shows protein levels. (G and H) Representative SYPRO-Ruby image of a pull-down assays using bead-immobilized Bmh1/2-EGFP-His6 (bait) and recombinant Rim4-His6 variants (input) that are PKA or mock treated (G) and quantification of (G) showing the mole ratio between pull-down Rim4 and immobilized Bmh1/2-EGFP (H) from 3 independent experiments (mean ± SD). (I) Model illustrating PKA-mediated phosphorylation at Rim4 BBSs stimulating Rim4 interaction with Bmh1/2. Created with BioRender. In (A), (C), and (E), data are shown as mean ± SE (three independent experiments, unpaired Welch’s t test). *p < 0.05, **p < 0.01, ***p < 0.001.
Figure 4.
Figure 4.. Cdc14 binds and dephosphorylates Rim4 on BBSs
(A) IB analysis of cell lysates from cdc14-1 or Cdc14 (WT) strains at prophase I under permissive (23°C) or restrictive (30°C) conditions. Pgk1 served as a loading control. (B) Quantification of EGFP-Rim4-p signals from (A) normalized to EGFP-Rim4 signals (IB, α-RRxS/T-p/α-EGFP). (C) IB of whole-cell lysates with α-RRxS/T-p antibody and Ponceau S staining under the indicated conditions as in (A) but showing the whole gel images. Red asterisks indicate EGFP-Rim4-p positions. (D) Quantification of IB signals between 20 and 150 kDa from (C), normalized by Ponceau S signals. Data are compared with the reference group (Cdc14 [WT] at 30°C) and presented as fold change. (E) Representative IB image with the indicated antibodies, showing coIP of EGFP-Rim4 with Cdc14(C283S)-FLAG in prophase I cell lysates. Empty protein G beads served as a negative control. (F) IB analysis showing recombinant FLAG-Cdc14 pulled down EGFP-Rim4 (pRIM4, EGFP-Rim4) from prophase I cell lysates, controlled by empty α-FLAG beads. (G) Schematics of Rim4 variants with a WT or modified Cdc14 docking site (PxLm and PxLSic1) and Rim4 with the C-terminal 289 residues truncated (Rim4 [ΔC289]). (H) Recombinant Cdc14-FLAG pulled down recombinant Rim4 variants using α-FLAG beads. Rim4-EGFP-His6 serves as a competitor. Red asterisk: Rim4(PxLm)-His6, black asterisk: Rim4(ΔC289)-His6. SDS-page with Cdc14-FLAG further separated from Rim4(ΔC289)-His6 is shown in (Figure S4E). (I) Sporulation efficiency of the indicated Rim4 variants presented as tetrad percentage as in Figure 1C. (J) IB analysis of prophase I cell lysates derived from the indicated EGFP-Rim4 variants using the indicated antibodies. Asterisks indicate non-specific bands. (K) Quantification of EGFP-Rim4-p signals from (J) normalized to EGFP-Rim4 signals (IB, α-RRxS/T-p/α-EGFP). (L) IB analysis of recombinant Bmh1/2-EGFP-His6 pulled down endogenous EGFP-Rim4 from prophase I cell lysates pre-incubated (30 min at 23°C) with Cdc14 (0.1 μg/μL) or mock treatment. The numbers listed below the images are the EGFP-Rim4-p signal normalized by the EGFP-Rim4 signal. In (B), (D), (I), and (K), data are shown as mean ± SE (three independent experiments, unpaired Welch’s t test). *p < 0.05, **p < 0.01.
Figure 5.
Figure 5.. Cdc14 antagonizes PKA to safeguard intracellular Rim4 distribution via Bmh1/2
(A) Representative FM images of EGFP-Rim4 intracellular distribution in Cdc14 (WT) or cdc14-1 strains at prophase I, 23°C (permissive condition) or 30°C (restrictive condition). Nup49-mScarlet marks the nuclear membrane. Right, quantification of the fluorescence signals along the yellow dashed lines or the red dashed arc, as in 3× magnified images. Strains were grown in YPA (2% potassium acetate, 2% peptone, and 1% yeast extract) at 30°C for 14 h before transferring into SPM. Scale bars, 5 μm. (B) Quantitative and statistical analysis of (A), showing the nuclear/cytoplasmic EGFP-Rim4 intensity ratio, with the numbers of analyzed cells listed below, as described (Figure 1E). (C) Representative FM images of EGFP-Rim4, showing intracellular distribution in Tpk-as strains at prophase I, with (+1NM-PP1) or without (no treatment, NT) 10 μM 1NM-PP1 treatment at 0 h, 2 h, 4 h, 6 h, and 8 h in SPM. Scale bar, 5 μm. (D) Quantification of (C) as in (B). (E) Representative FM images of the indicated EGFP-Rim4 variants in prophase I cells, showing their intracellular distribution. Scale bars, 5 μm. (F) Quantification and statistical analysis of (E) as in Figure 1E. The asterisks in blue, magenta, olive, and green indicate comparisons with Rim4 (WT), Rim4(PxLm), Rim4(FLm), and Rim4(5C), respectively. The blue line and magenta line indicate a ratio of 1 and the median value of Rim4(PxLm), respectively. (G and H) Recombinant Bmh1/2-GFP (1:1) pulled down recombinant Rim4-His6 under the indicated conditions, including PKA treatment and with total yeast RNAs. (G) SYPRO-Ruby staining of input and pull-down samples resolved by SDS-PAGE. (H) Quantification of (G) from three independent experiments, shown as mean ± SD, unpaired t test. **p < 0.01. In (B), (D), and (F), data from three independent experiments were analyzed. Red bars indicate median ± 95% CI. Statistical analysis was performed using Dunn’s test (B and F) and Mann-Whitney test (D). *p < 0.05, **p < 0.01, ***p < 0.001.
Figure 6.
Figure 6.. Bmh1/2 temporally protects Rim4 from autophagy
(A) Schematic of the chemical-genetic strategy for monitoring Atg1-as kinase activity in vitro. Atg1-as thiophosphorylates substrates using a bulky ATPγS analog (N6-PhEt-ATP-γ-S). Thiophosphorylated substrates can be alkylated with para-nitrobenzyl mesylate (PNBM) and detected by IB using anti-thiophosphate ester (α-thioP) antibodies. (B and C) Atg1-as kinase assay in synchronized meiotic cell lysates (collected at prophase I, 12 h in SPM) supplemented with the indicated amounts of Rim4, PKA-phosphorylated Rim4 (Rim4-p), or a premixed combination of Rim4-p and Bmh1/2-EGFP. (B) IB with the indicated antibodies shows Atg1-as kinase activity (Atg1-as-p), indicated by Atg1-as autophosphorylation. Pgk1 serves as a loading control. (C) Quantification as sums of anti-ThioP signal intensity, shown as mean ± SD from three independent experiments (unpaired t test; *p ≤ 0.05, **p ≤ 0.01). (D) CoIP of EGFP-Rim4 or EGFP-Rim4(5C) with Bmh1-FLAG (IP, α-FLAG) in cells collected at the indicated time (6 h in SPM, early meiotic stage; 12 h in SPM, prophase I without NDT80 induction; 16 h in SPM, meiotic divisions 4 h after NDT80 expression).
Figure 7.
Figure 7.. Cdc14 orchestrates autophagic Rim4 degradation
(A) IB of cell lysates from EGFP-Rim4 variant strains collected at prophase I (12 h in SPM) or post-meiosis stage (20 h in SPM) using the indicated antibodies. Pgk1 serves as a loading control. (B) Quantitative analysis of (A), measuring the ratio of free EGFP to total EGFP signal, which indicates autophagic degradation of EGFP-tagged Rim4 variants. (C) Quantitative analysis of(A), measuring full-length EGFP-Rim4 intracellular level normalized by Pgk1. (B) and (C) Data from three independent experiments are presented as mean ± SE and analyzed using unpaired Welch’s t test. *p < 0.05, **p < 0.01, ***p < 0.001. (D) Quantitative analysis of Figure S7A, measuring the ratio of nuclear versus cytoplasmic EGFP-Rim4 variant intensity at different time points in SPM, with 1NM-PP1 to inhibit autophagy (12 h in SPM) or mock treatment. β-Estradiol was added to the cells at 12 h in SPM to induce Ndt80 expression. Data are shown as mean ± SE from three independent experiments. More than 300 cells of each strain were analyzed for every indicated time point. Šidák’s multiple-comparisons test after one-way ANOVA was performed to compare different strains between the 0.5 h and 12 h time points or 14 and 22 h time points. The p values are shown in the table on the right. White, p = 0.05; yellow, p < 0.05 (significant; *p < 0.05, **p < 0.01); blue, p > 0.05. (E) Model illustrating the spatiotemporal regulation of Rim4 function and stability by PKA and Cdc14. Left: Before meiotic divisions, Cdc14 primarily promotes Rim4-mRNA assembly in the nucleus because of its nuclear localization. Right: during meiotic anaphase, increased PKA activity facilitates Rim4 to release bound mRNAs, resulting in Rim4-Bmh1/2 complex formation. Next, relocation of Cdc14 from the nucleus to the cytoplasm during anaphase drives Rim4-Bmh1/2 disassembly and therefore determines the timing of Rim4 degradation by autophagy and translation of Rim4-sequestered mRNAs. Created with BioRender.

Comment on

Similar articles

Cited by

References

    1. Kassir Y, Granot D, and Simchen G (1988). IME1, a positive regulator gene of meiosis in S. cerevisiae. Cell 52, 853–862. 10.1016/0092-8674(88)90427-8. - DOI - PubMed
    1. Neiman AM (2011). Sporulation in the budding yeast Saccharomyces cerevisiae. Genetics 189, 737–765. 10.1534/genetics.111.127126. - DOI - PMC - PubMed
    1. Mitchell AP (1994). Control of meiotic gene expression in Saccharomyces cerevisiae. Microbiol. Rev 58, 56–70. 10.1128/mr.58.1.56-70.1994. - DOI - PMC - PubMed
    1. Chu S, and Herskowitz I (1998). Gametogenesis in yeast is regulated by a transcriptional cascade dependent on Ndt80. Mol. Cell 1, 685–696. 10.1016/s1097-2765(00)80068-4. - DOI - PubMed
    1. Chu S, DeRisi J, Eisen M, Mulholland J, Botstein D, Brown PO, and Herskowitz I (1998). The transcriptional program of sporulation in budding yeast. Science 282, 699–705. 10.1126/science.282.5389.699. - DOI - PubMed

MeSH terms

LinkOut - more resources