. 2023 Sep 26;42(9):113067.
doi: 10.1016/j.celrep.2023.113067. Epub 2023 Sep 1.

AXL-initiated paracrine activation of pSTAT3 enhances mesenchymal and vasculogenic supportive features of tumor-associated macrophages

Affiliations

AXL-initiated paracrine activation of pSTAT3 enhances mesenchymal and vasculogenic supportive features of tumor-associated macrophages

Chia-Nung Hung et al. Cell Rep. .

Abstract

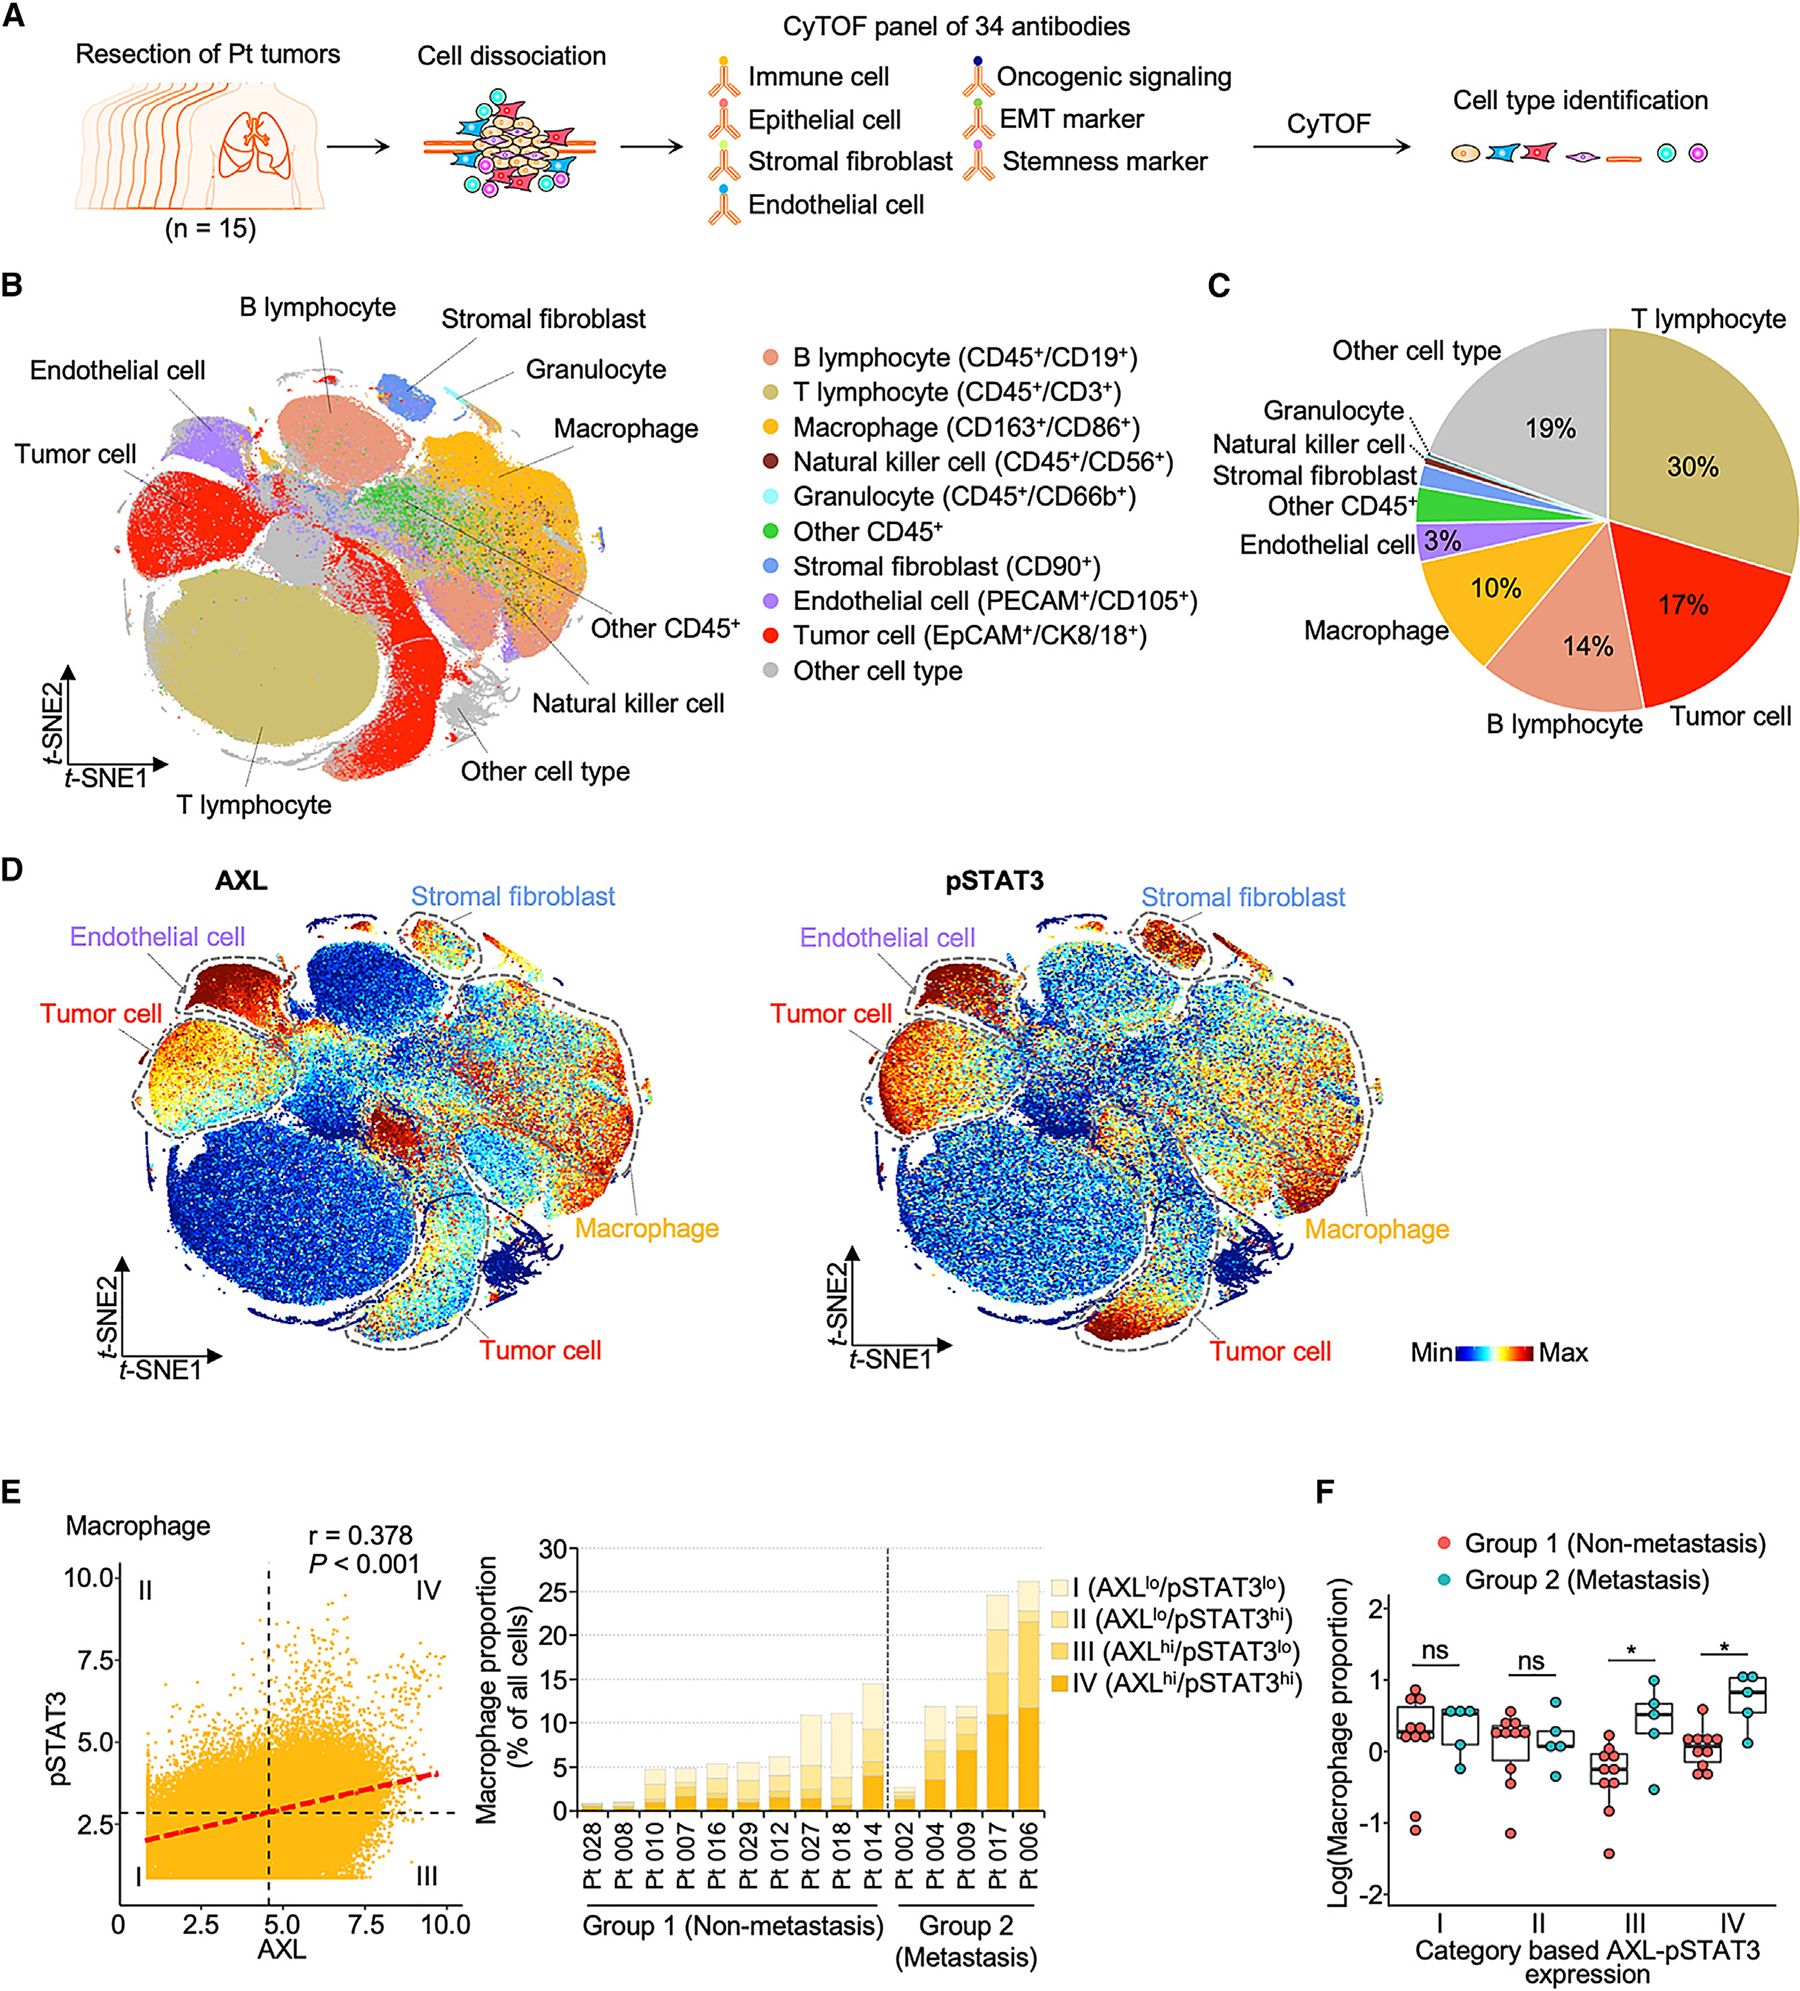
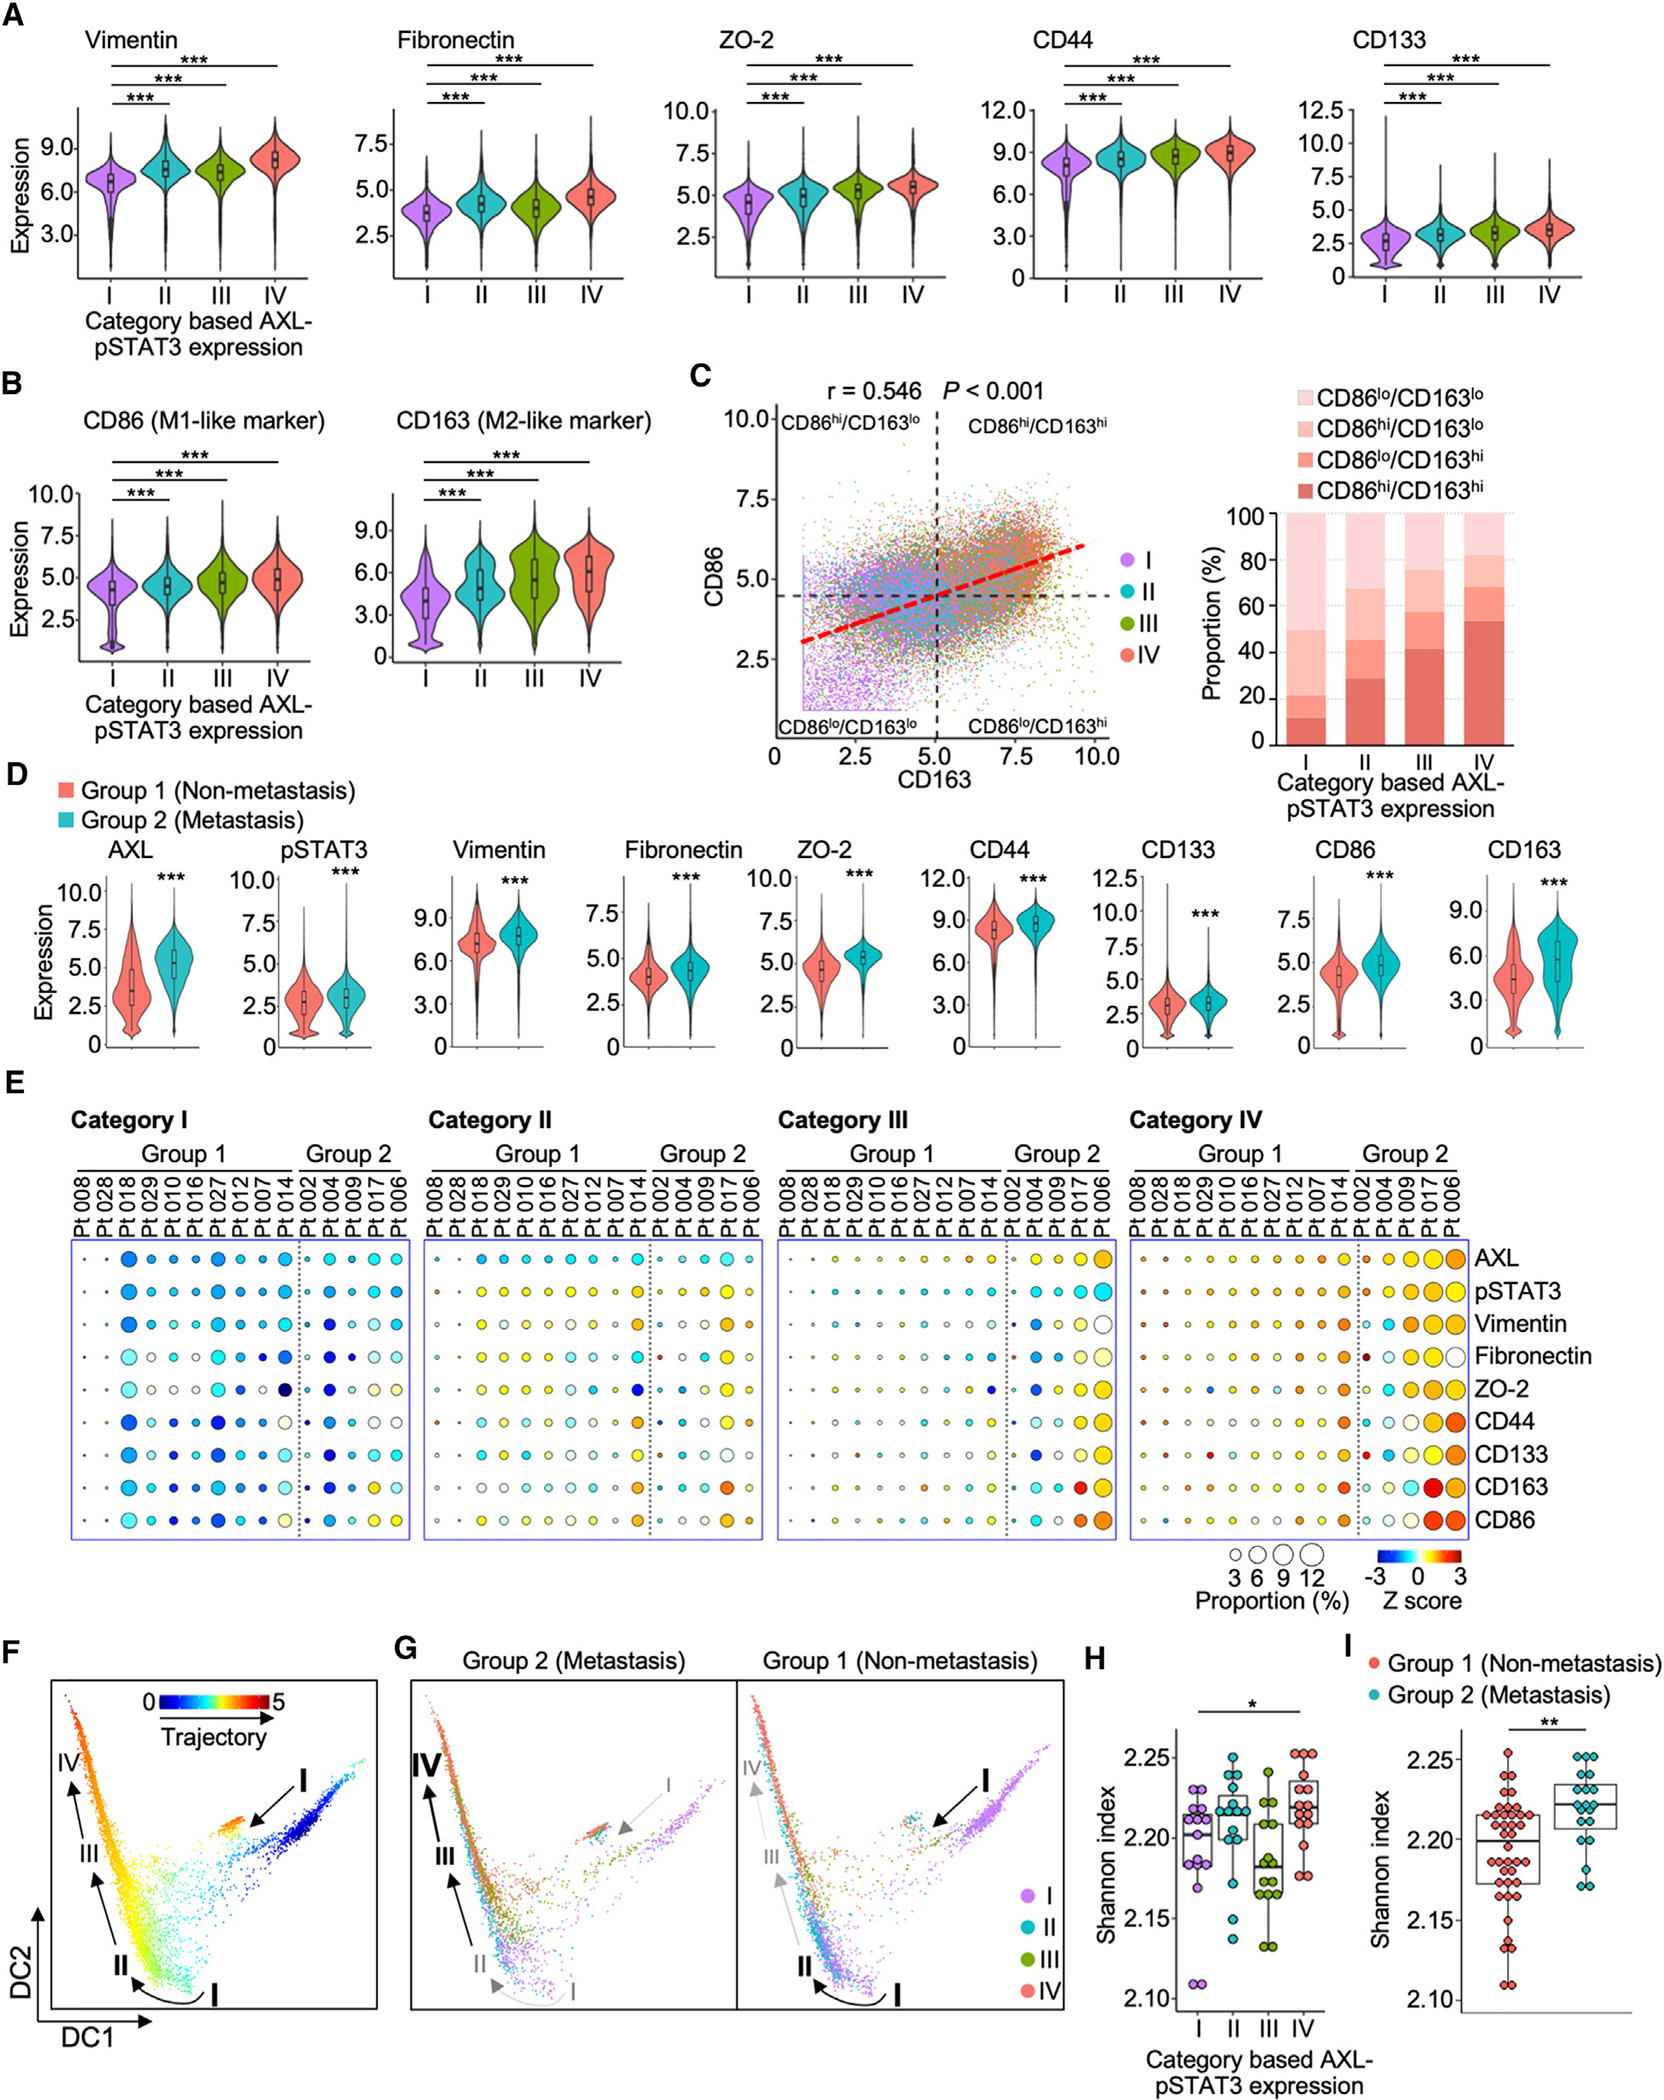
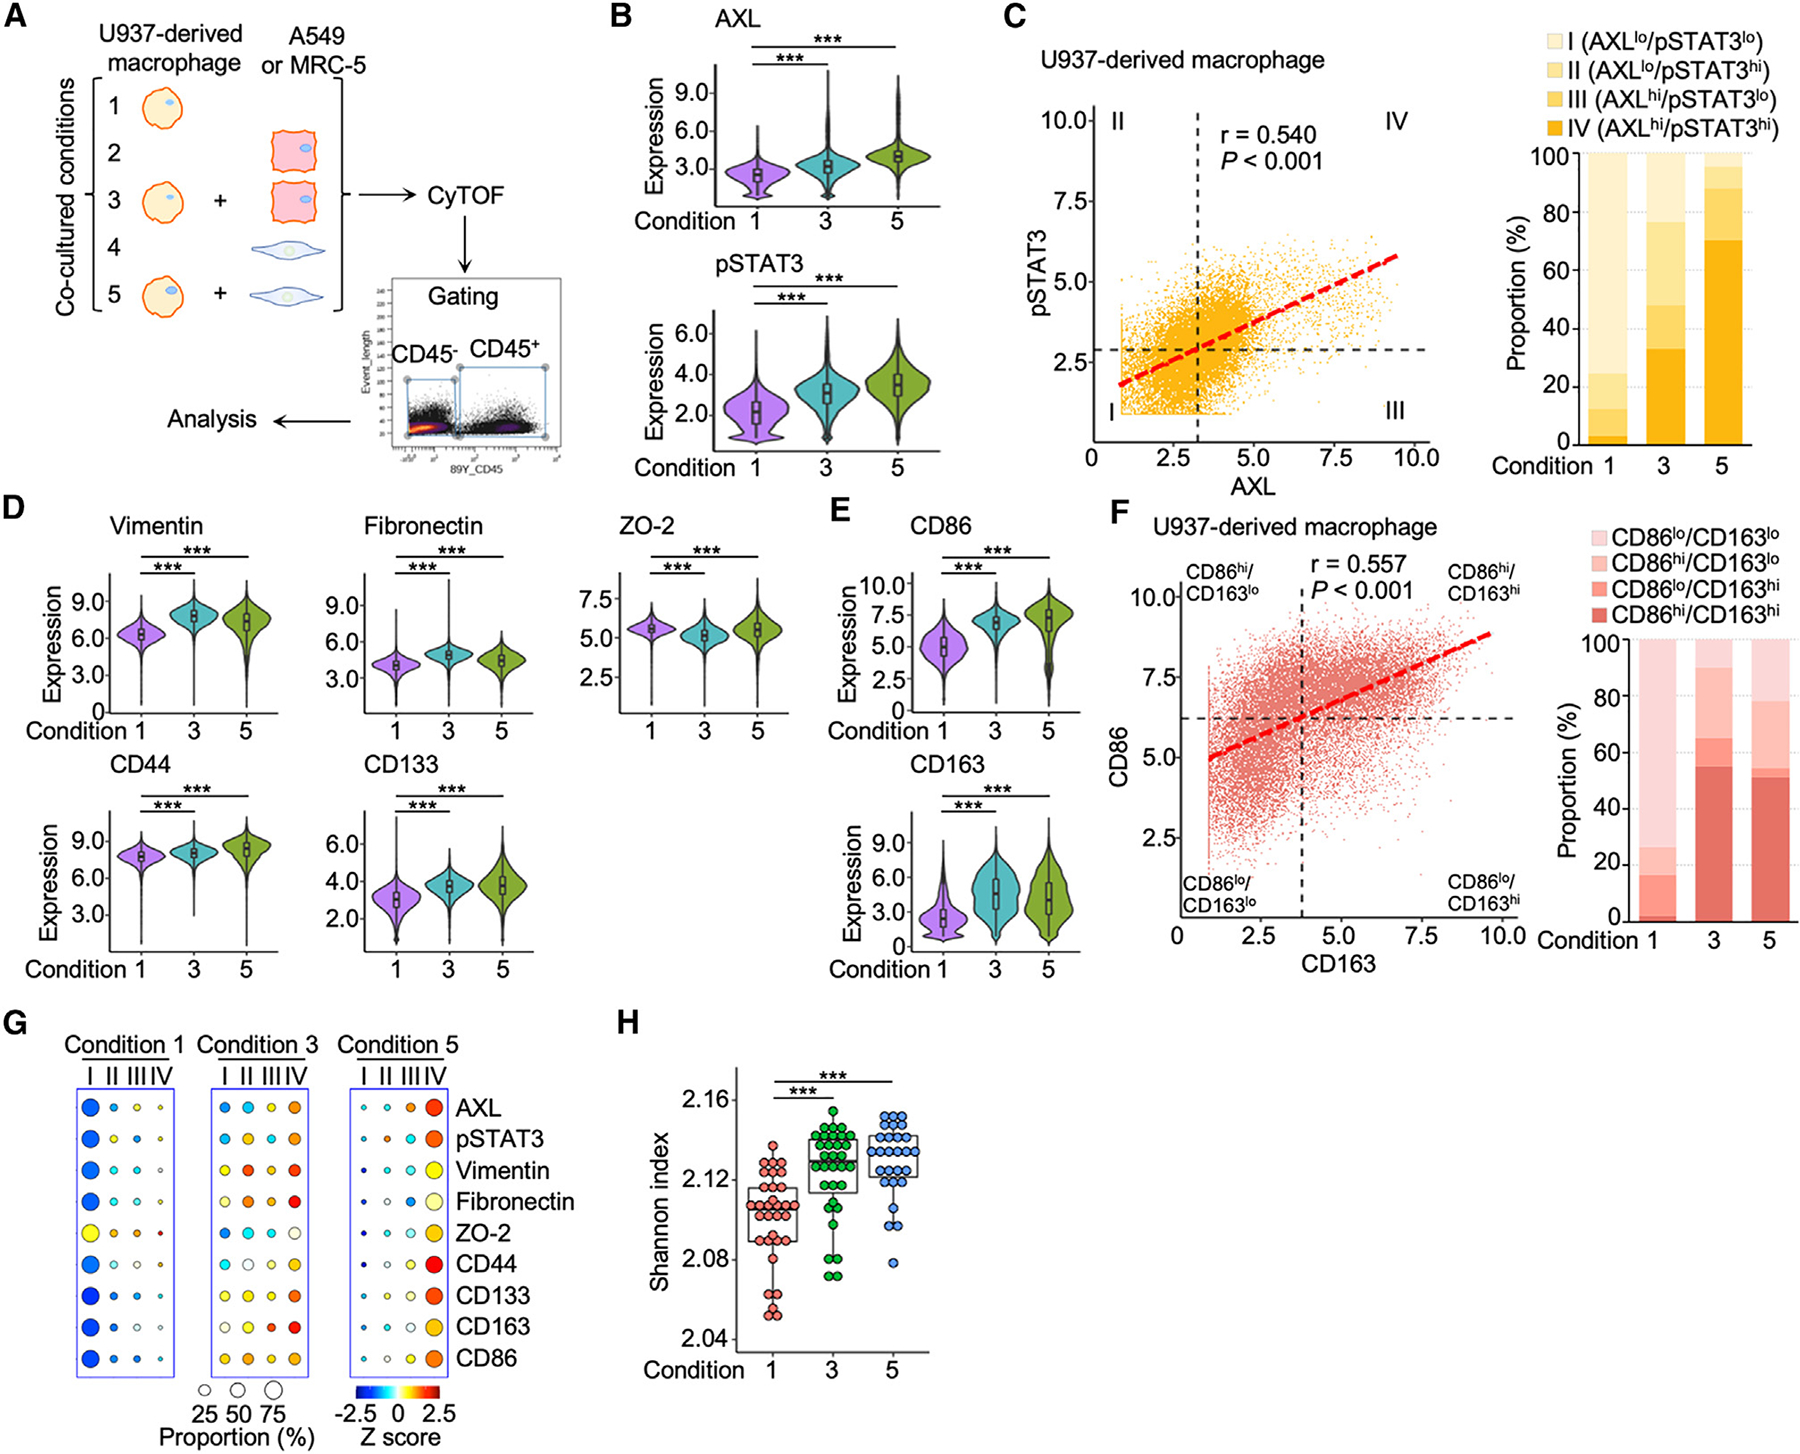
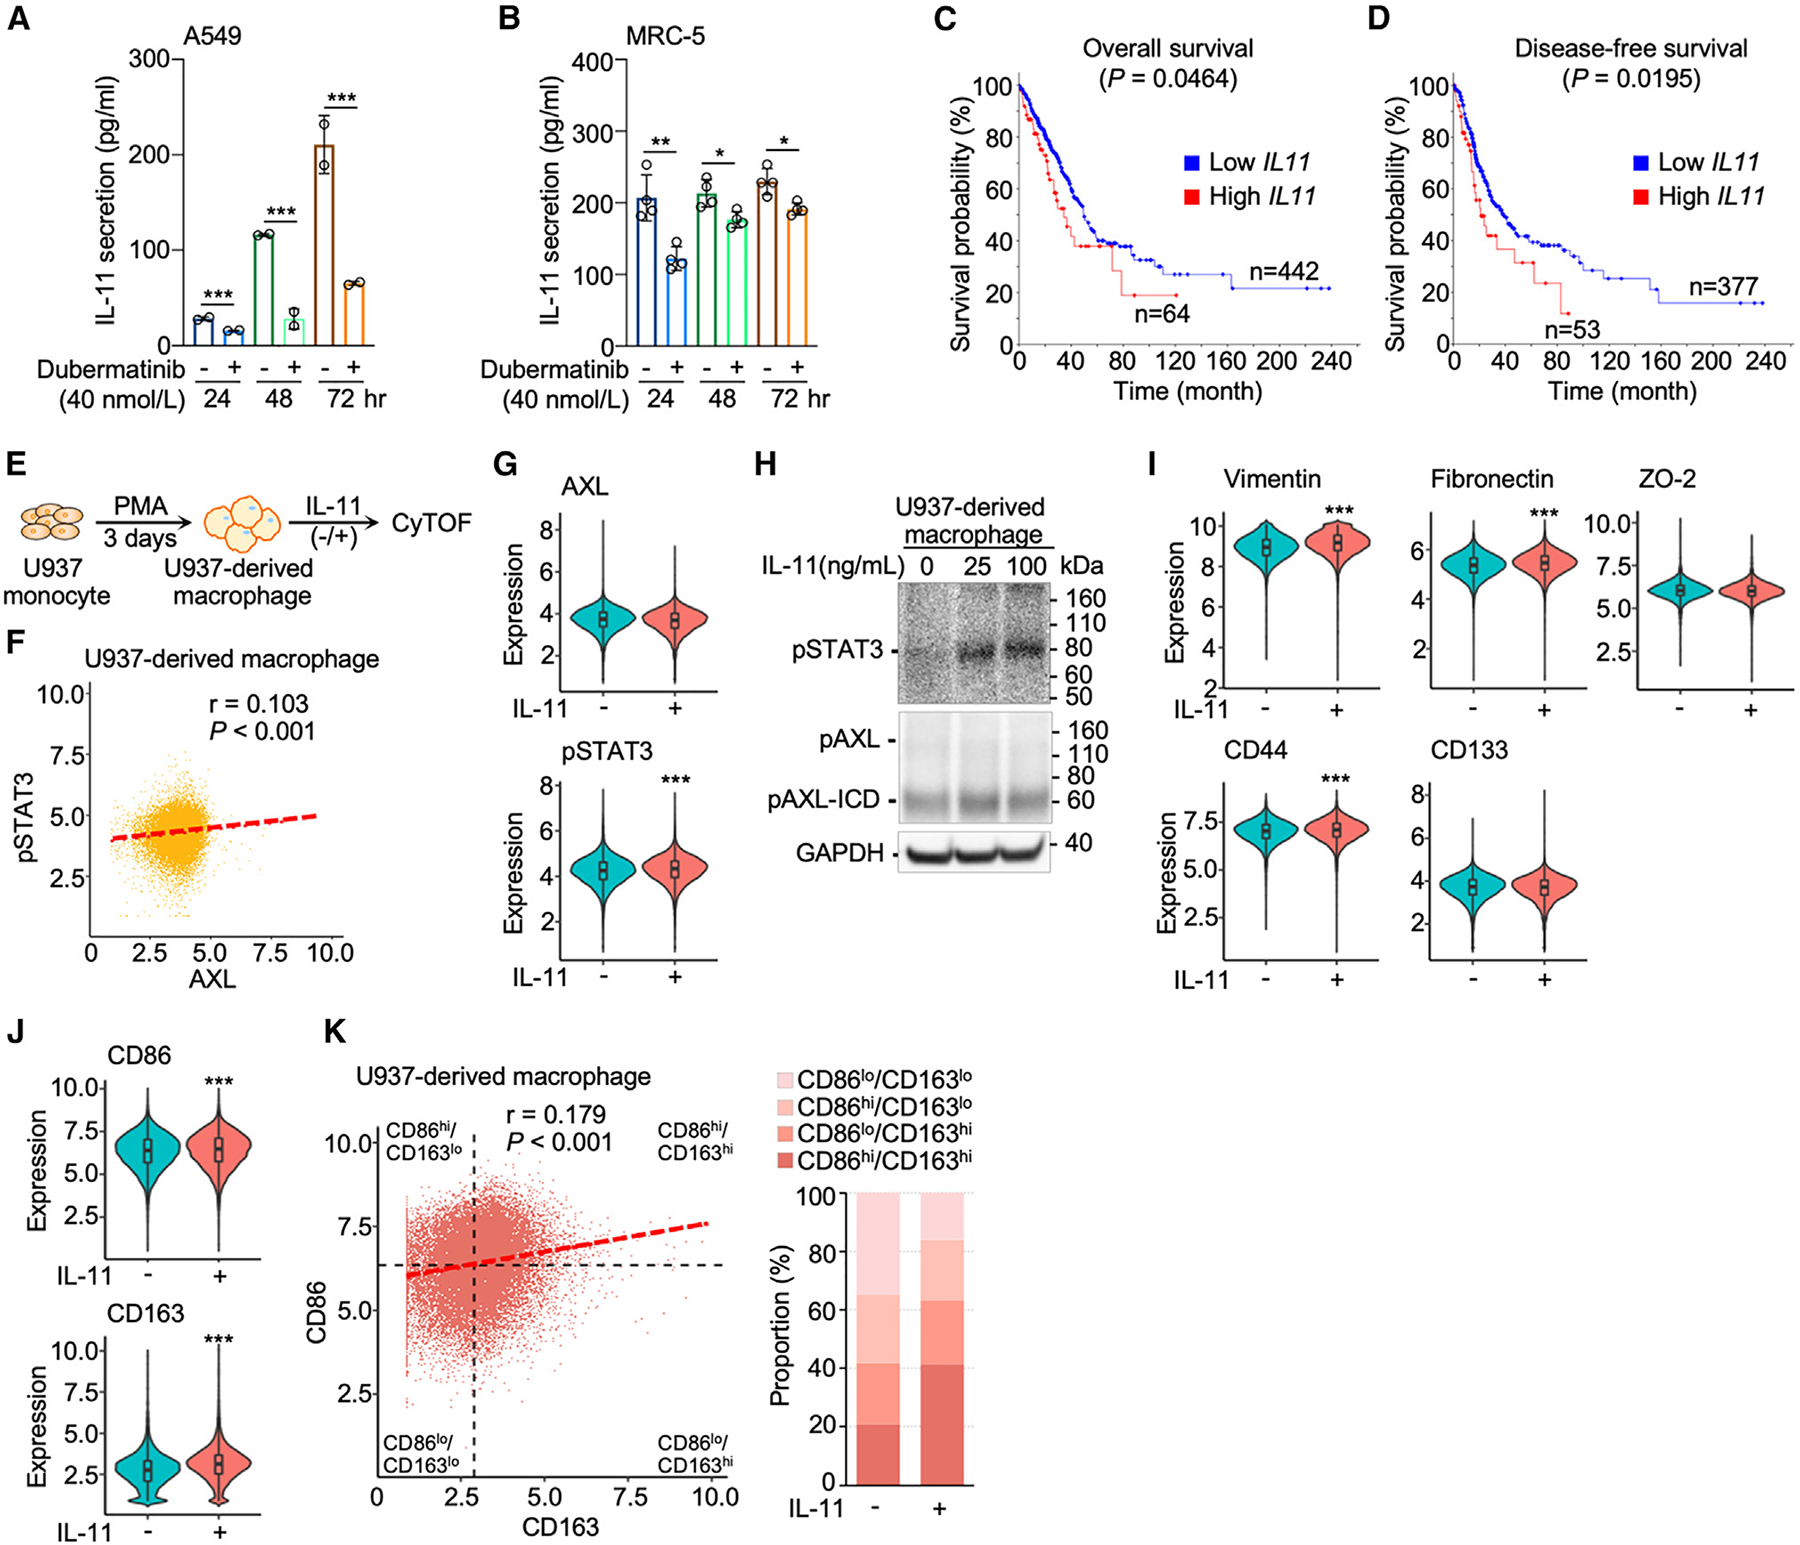
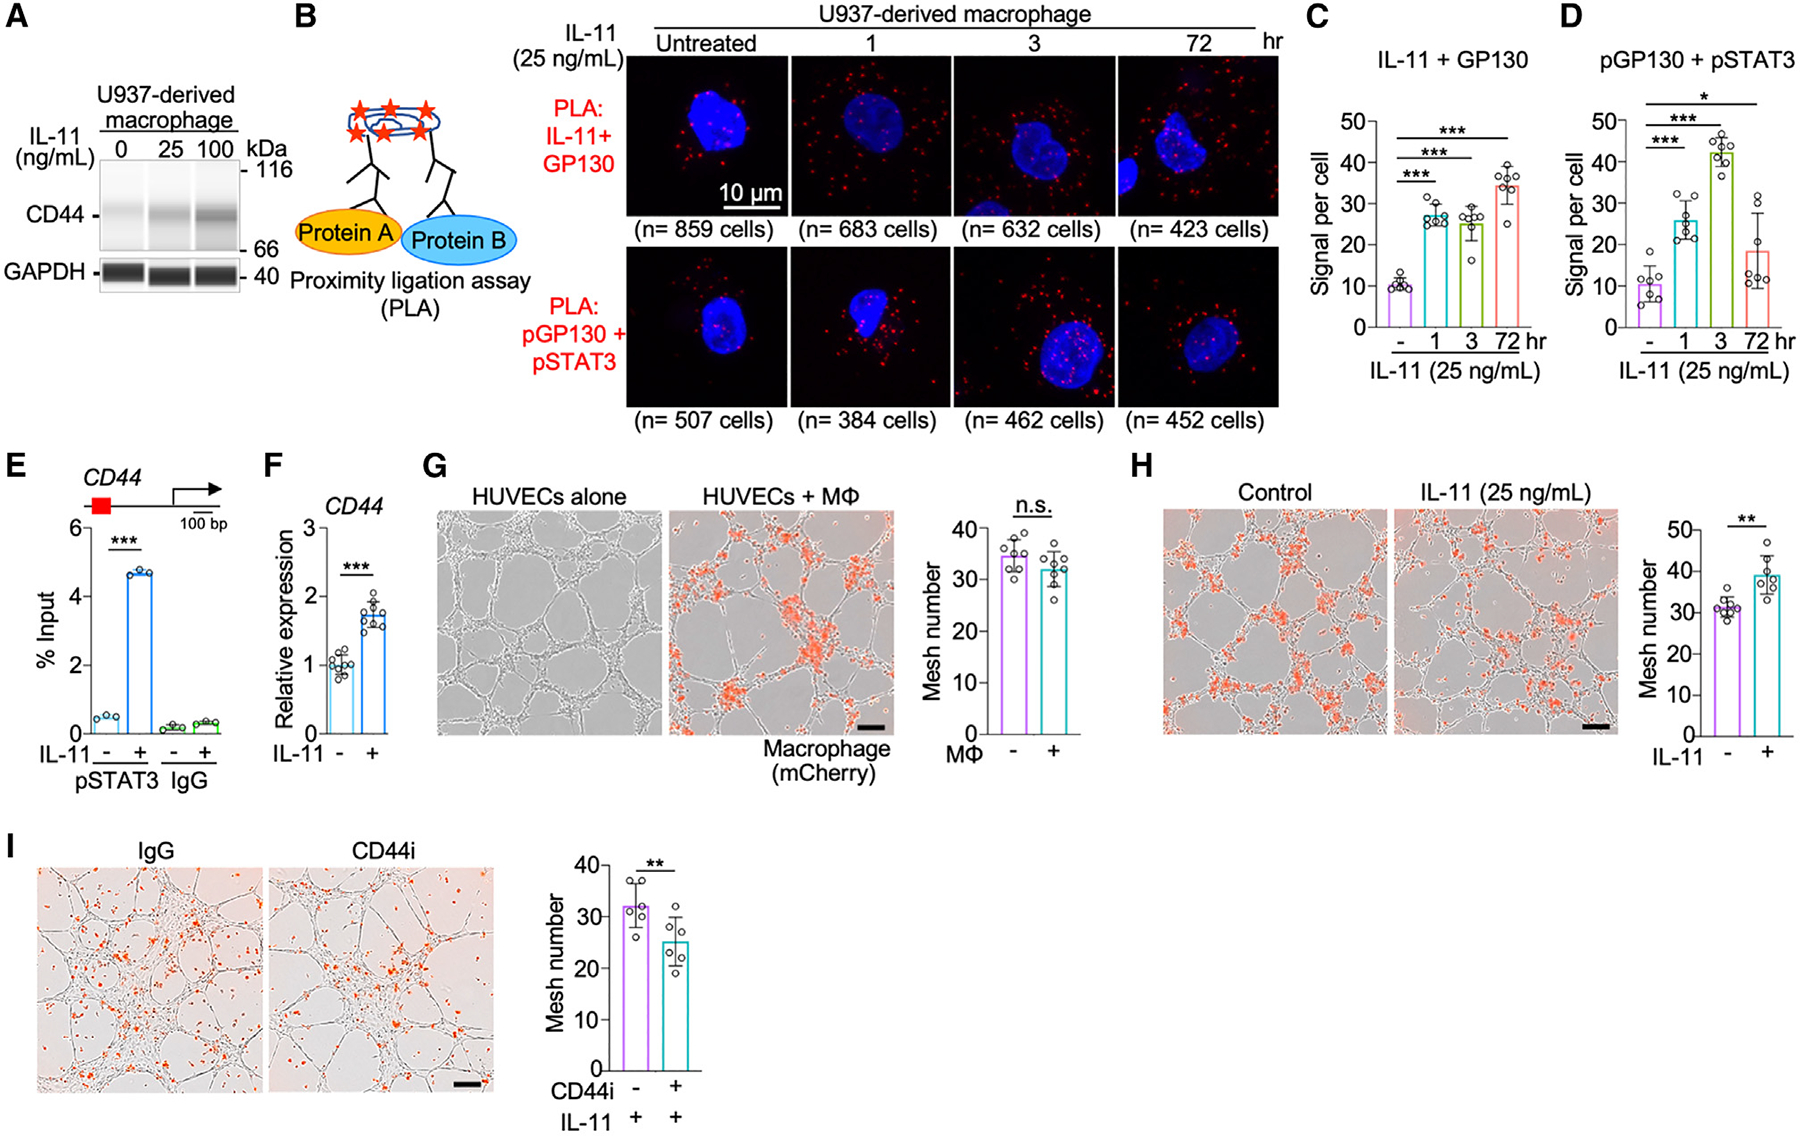
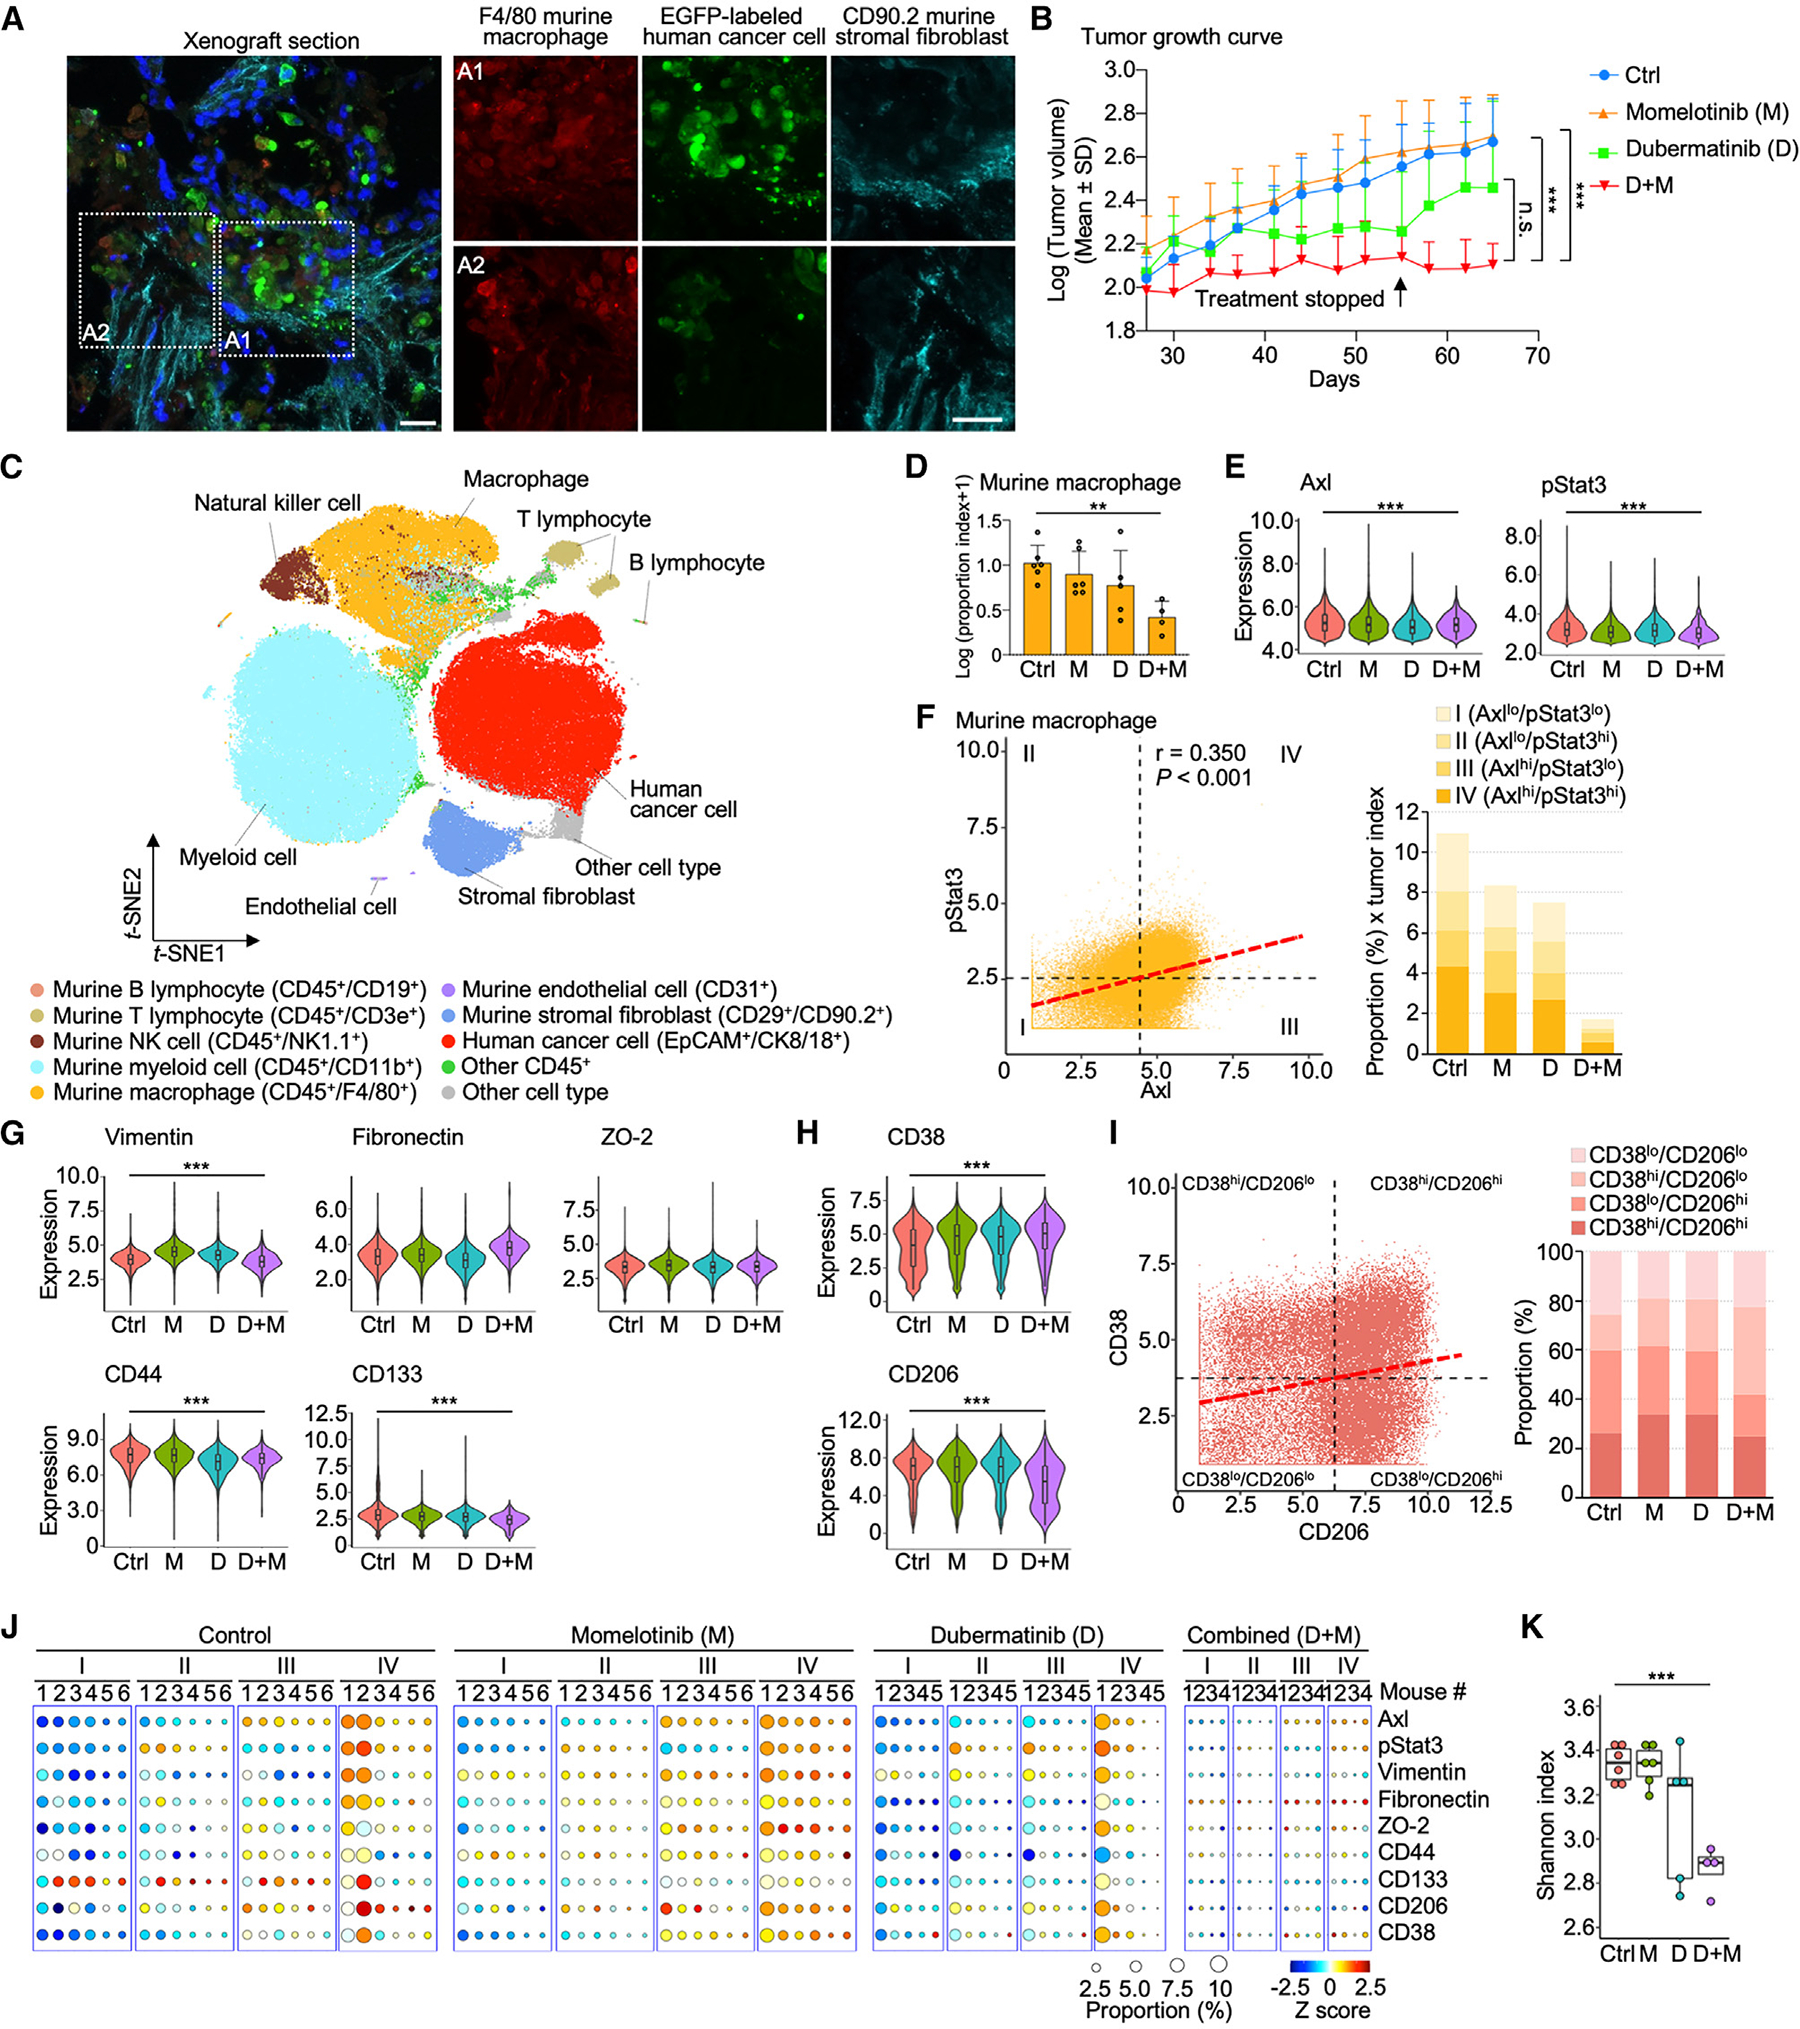
Tumor-associated macrophages (TAMs) are integral to the development of complex tumor microenvironments (TMEs) and can execute disparate cellular programs in response to extracellular cues. However, upstream signaling processes underpinning this phenotypic plasticity remain to be elucidated. Here, we report that concordant AXL-STAT3 signaling in TAMs is triggered by lung cancer cells or cancer-associated fibroblasts in the cytokine milieu. This paracrine action drives TAM differentiation toward a tumor-promoting "M2-like" phenotype with upregulation of CD163 and putative mesenchymal markers, contributing to TAM heterogeneity and diverse cellular functions. One of the upregulated markers, CD44, mediated by AXL-IL-11-pSTAT3 signaling cascade, enhances macrophage ability to interact with endothelial cells and facilitate formation of primitive vascular networks. We also found that AXL-STAT3 inhibition can impede the recruitment of TAMs in a xenograft mouse model, thereby suppressing tumor growth. These findings suggest the potential application of AXL-STAT3-related markers to quantitatively assess metastatic potential and inform therapeutic strategies in lung cancer.

Keywords: AXL; CP: Cancer; CP: Immunology; CyTOF; Dubermatinib; Momelotinib; STAT3; tumor microenvironment; tumor-associated macrophage.


Conflict of interest statement

Declaration of interests S.W. is principal investigator at Sumitomo Dainippon Pharma Oncology.

Figures

Figure 1.
Figure 1.. Concordant activation of AXL-STAT3 signaling in macrophages in metastatic lung TMEs
(A) Flow chart illustrates tissue processing and CyTOF analysis of 15 treatment-naive primary lung tumors. (B) T-distributed stochastic neighbor embedding (t-SNE) scatterplot of immune, epithelial, and endothelial cells and stromal fibroblasts identified with corresponding markers in lung TMEs. See also Figure S1. (C) Pie chart represents the proportion of cell subtypes. (D) t-SNE scatterplots of expression levels of AXL and pSTAT3 in lung TMEs. (E) AXL and pSTAT3 correlation scatterplot of macrophages and bar graph of four category proportions in individual patients. The four categories were stratified based on mean values of AXL and pSTAT3. Group 1 and 2 lung tumors were classified based on tumor-node-metastasis (TNM) staging of individual patients. Group 1 tumors were derived from patients with localized tumors. Group 2 tumors were derived from patients with lymph node and/or distant metastasis. See also Table S1 (F) Boxplot of category proportions between group 1 (n = 10) and group 2 (n = 5) tumors. Data are mean ± SD; *p < 0.05; Student’s t test for each category.
Figure 2.
Figure 2.. Concordant AXL-STAT3 enhances pro-tumoral features of macrophages
(A and B) Violin plots reveal expression levels of five EMT/stemness and two polarization markers of macrophages in the four AXL-pSTAT3 categories in lung TMEs. Data are mean ± SD; ***p < 0.001; one-way ANOVA followed by Duncan’s multiple range tests. (C) CD86 and CD163 correlation scatterplot of macrophages demonstrates the four subtypes based on mean values of CD86 and CD163 and bar graph of the subtype proportions in the four AXL-pSTAT3 categories. (D) Violin plots of expression levels of the seven markers in group 1 and 2 tumors. Data are mean ± SD; ***p < 0.001; Student’s t test. (E) Circle plots showing the proportions and expression levels of AXL, pSTAT3, and the seven markers of the four AXL-pSTAT3 categories in individual tumors from group 1 and 2 patients. (F and G) Diffusion maps of the pseudotime trajectories of the overall macrophages and macrophages from group 1 or 2 tumors of the four AXL-pSTAT3 categories. The arrows indicate the trajectory. (H) Boxplot of Shannon indices in the four AXL-pSTAT3 categories (n = 15 for each category). Data are mean ± SD; *p < 0.05; one-way ANOVA followed by Duncan’s multiple range tests. (I) Boxplot of Shannon indices in group 1 (n = 40) and 2 (n = 20) tumors. Data are mean ± SD; **p < 0.01; Student’s t test.
Figure 3.
Figure 3.. Paracrine activation of AXL-STAT3 in macrophages exposed to lung cancer cells or cancer-associated fibroblasts
(A) Co-cultured conditions of U937-derived macrophages and A549 lung cancer cells or MRC-5 lung fibroblasts with cytometry by time-of-flight (CyTOF) workflow. (B) Violin plots showing the expression levels of AXL and pSTAT3 of macrophages in condition 1, 3, and 5. Data are mean ± SD; ***p < 0.001; one-way ANOVA followed by Duncan’s multiple range tests. (C) AXL and pSTAT3 correlation scatterplot of macrophages showing the four categories based on mean values of AXL and pSTAT3 and bar graph of category proportions in condition 1, 3, and 5. (D and E) Violin plots of expression levels of the seven AXL-pSTAT3-related markers in macrophages of condition 1, 3, and 5. Data are mean ± SD; ***p < 0.001; one-way ANOVA followed by Duncan’s multiple range tests. (F) CD86 and CD163 correlation scatterplot of macrophages showing the four subtypes based on mean values of CD86 and CD163 and bar graph of subtype proportions in condition 1, 3, and 5. (G) Circle plots showing the proportions and expression levels of AXL, pSTAT3, and the seven markers of the four AXL-pSTAT3 categories in condition 1, 3, and 5. (H) Boxplot of Shannon indices in condition 1, 3, and 5 of 32 PhenoGraph clusters (n = 32). Data are mean ± SD; ***p < 0.001; one-way ANOVA followed by Duncan’s multiple range tests.
Figure 4.
Figure 4.. AXL-mediated IL-11 secretion in lung cancer cells and lung stromal fibroblasts activates signaling cascades for pro-tumoral features of macrophages
(A and B) IL-11 secretion was attenuated by dubermatinib (40 nmol/L) from A549 lung cancer cells (n = 2) and MRC-5 lung fibroblasts (n = 4). Data are mean ± SD; *p < 0.05, **p < 0.01, ***p < 0.001; Student’s t test for each time point. (C and D) Kaplan-Meier curves depict overall and disease-free survival probability in TCGA lung adenocarcinoma cohort based on high (Z score > 1) and low (Z score < 1) IL11 expression of lung tumors. (E) Flow chart of induction of U937-derived macrophages and IL-11 treatment for CyTOF analysis. (F) AXL and STAT3 correlation scatterplot of U937-derived macrophages. (G) Violin plots showing the expression levels of AXL and STAT3 without and with IL-11 treatment (25 ng/mL). Data are mean ± SD; ***p < 0.001; Student’s t test. (H) Western blot analysis of IL-11-activated AXL-STAT3 signaling, i.e., phosphorylation of AXL and STAT3 (pSTAT3) in U937-derived macrophages. The cleavage product, phosphorylated AXL intracellular domain (pAXL-ICD), was observed. (I and J) Violin plots of expression levels of the seven AXL-STAT3-related markers without and with IL-11 treatment (25 ng/mL). Data are mean ± SD; ***p < 0.001; Student’s t test. (K) CD86 and CD163 correlation scatterplot of macrophages showing the four subtypes based on mean values of CD86 and CD163 and bar graph of subtype proportions of macrophages without and with IL-11 treatment (25 ng/mL).
Figure 5.
Figure 5.. AXL-IL-11-STAT3-mediated CD44 enhances macrophage ability to facilitate vasculogenesis
(A) Capillary western immunoassay (WES) of a stemness marker, CD44, in U937-derived macrophages untreated and treated with IL-11. Raw data of WES shown in Figure S6A. (B) Diagram of proximity ligation assay (PLA) (left) and PLA images of protein-protein interactions between IL-11/GP130 and pGP130/pSTAT3 in macrophages untreated and treated with IL-11 at 1, 3, and 72 h (right). PLA utilizes a pair of oligonucleotide-conjugated secondary antibodies that correspond to antibodies targeting each interacting protein partner. The proximity of protein partners allows circular DNA amplification of oligonucleotide templates and detectable fluorescence signals upon in situ ligation. (C and D) Quantitative analysis of PLA signals per cell indicating protein-protein interactions of IL-11 and the extracellular domain of GP130 (C) and pGP130 and pSTAT3 (D) in macrophages untreated and treated with IL-11 at 1, 3, and 72 h (n = 7). Data are mean ± SD; *p < 0.05, ***p < 0.001; one-way ANOVA followed by Duncan’s multiple range tests. (E) Chromatin immunoprecipitation (ChIP)-qPCR analysis of pSTAT3 binding to promoter regions of CD44 in untreated and IL-11-treated U937-derived macrophages (n = 3). Data are mean ± SD; ***p < 0.001; Student’s t test for each treatment. (F) qPCR analysis of CD44 expression in untreated and IL-11-treated U937-derived macrophages (n = 9). Data are mean ± SD; ***p < 0.001; Student’s t test. (G) Images of vasculogenic mesh formation and bar graph of mesh number in human umbilical vein endothelial cells (HUVECs) co-cultured without or with U937-derived macrophages (n = 8). Scale bar, 200 μm. Data are mean ± SD; Student’s t test. (H) Bar graph of mesh number in HUVECs co-cultured with U937-derived macrophages pre-treated without or with IL-11 (25 ng/mL) (n = 7). Data are mean ± SD; **p < 0.01; Student’s t test. (I) Bar graph of mesh number in HUVECs co-cultured with U937-derived macrophages pre-treated with IL-11 (25 ng/mL) and without or with CD44 inhibitor (n = 6). Data are mean ± SD; **p < 0.01; Student’s t test.
Figure 6.
Figure 6.. AXL-STAT3 inhibition attenuates macrophage plasticity and disrupts host cell conscription in xenograft TMEs
(A) Immunofluorescence images of a xenograft tumor section showing cell nuclei (DAPI, blue), human A549 lung cancer cells (EGFP labeled, green), murine stromal fibroblasts (CD90.2+, cyan), and murine macrophages (F4/80+, red). Scale bar = 20 μm. (B) Growth curves of the average tumor size in log 10 base in the four treatment groups: vehicle control (n = 6); dubermatinib (AXL inhibitor), 120 mg/kg oral dose twice weekly for 28 days (n = 5); momelotinib (JAK/STAT3 inhibitor), 25 mg/kg orally once daily for 28 days (n = 6); combination treatment for 14 days (n = 4). Combination treatment resulted in 75% reduction in tumor volume compared with control. Data are mean ± SD; ***p < 0.001; one-way ANOVA followed by Duncan’s multiple range tests. (C) t-SNE scatterplots of human cancer cells and murine fibroblasts, endothelial cells, macrophages, and other immune cells of xenograft tumors identified with corresponding markers. See also Figures S7H–S7K. (D) Bar graph of murine macrophage proportion index in log 10 base of the four treatment groups (vehicle control, n = 6; dubermatinib, n = 5; momelotinib, n = 6; and combination treatment, n = 4). Data are mean ± SD; **p < 0.01; one-way ANOVA followed by Duncan’s multiple range tests. (E) Violin plots showing the expression levels of AXL and STAT3 in the four treatment groups. Data are mean ± SD; ***p < 0.001; one-way ANOVA followed by Duncan’s multiple range tests. (F) AXL and STAT3 correlation scatterplot of macrophages showing the four categories based on mean values of AXL and STAT3 and bar graph of category proportions in the four treatment groups. (G and H) Violin plots of expression levels of the five AXL-STAT3-related EMT/stemness markers, M1-like marker CD38, and M2-like marker CD206 in the four treatment groups. Data are mean ± SD; ***p < 0.001; one-way ANOVA followed by Duncan’s multiple range tests. (I) CD38 and CD206 correlation scatterplot of macrophages showing the four subtypes based on mean values of CD38 and CD206 and bar graph of subtype proportions in the four treatment groups. (J) Circle plots showing the proportions and expression levels of AXL, STAT3, and the seven related markers of the four AXL-STAT3 categories in individual xenograft tumors of the treatment groups. (K) Boxplot of Shannon indices of the treatment groups (vehicle control, n = 6; dubermatinib, n = 5; momelotinib, n = 6; and combination treatment, n = 4). Data are mean ± SD; ***p < 0.001; one-way ANOVA followed by Duncan’s multiple range tests.

References

    1. Altorki NK, Markowitz GJ, Gao D, Port JL, Saxena A, Stiles B, McGraw T, and Mittal V (2019). The lung microenvironment: an important regulator of tumour growth and metastasis. Nat. Rev. Cancer 19, 9–31. 10.1038/s41568-018-0081-9. - DOI - PMC - PubMed
    1. Jin MZ, and Jin WL (2020). The updated landscape of tumor microenvironment and drug repurposing. Signal Transduct. Targeted Ther. 5, 166. 10.1038/s41392-020-00280-x. - DOI - PMC - PubMed
    1. Labani-Motlagh A, Ashja-Mahdavi M, and Loskog A (2020). The Tumor Microenvironment: A Milieu Hindering and Obstructing Antitumor Immune Responses. Front. Immunol. 11, 940. 10.3389/fimmu.2020.00940. - DOI - PMC - PubMed
    1. Quatromoni JG, and Eruslanov E (2012). Tumor-associated macrophages: function, phenotype, and link to prognosis in human lung cancer. Am. J. Transl. Res. 4, 376–389. - PMC - PubMed
    1. Corliss BA, Azimi MS, Munson JM, Peirce SM, and Murfee WL (2016). Macrophages: An Inflammatory Link Between Angiogenesis and Lymphangiogenesis. Microcirculation 23, 95–121. 10.1111/micc.12259. - DOI - PMC - PubMed

Publication types