. 2023 Sep 12;56(9):2121-2136.e6.
doi: 10.1016/j.immuni.2023.08.008. Epub 2023 Sep 1.

Genetic variants of phospholipase C-γ2 alter the phenotype and function of microglia and confer differential risk for Alzheimer's disease

Affiliations

Genetic variants of phospholipase C-γ2 alter the phenotype and function of microglia and confer differential risk for Alzheimer's disease

Andy P Tsai et al. Immunity. .

Abstract

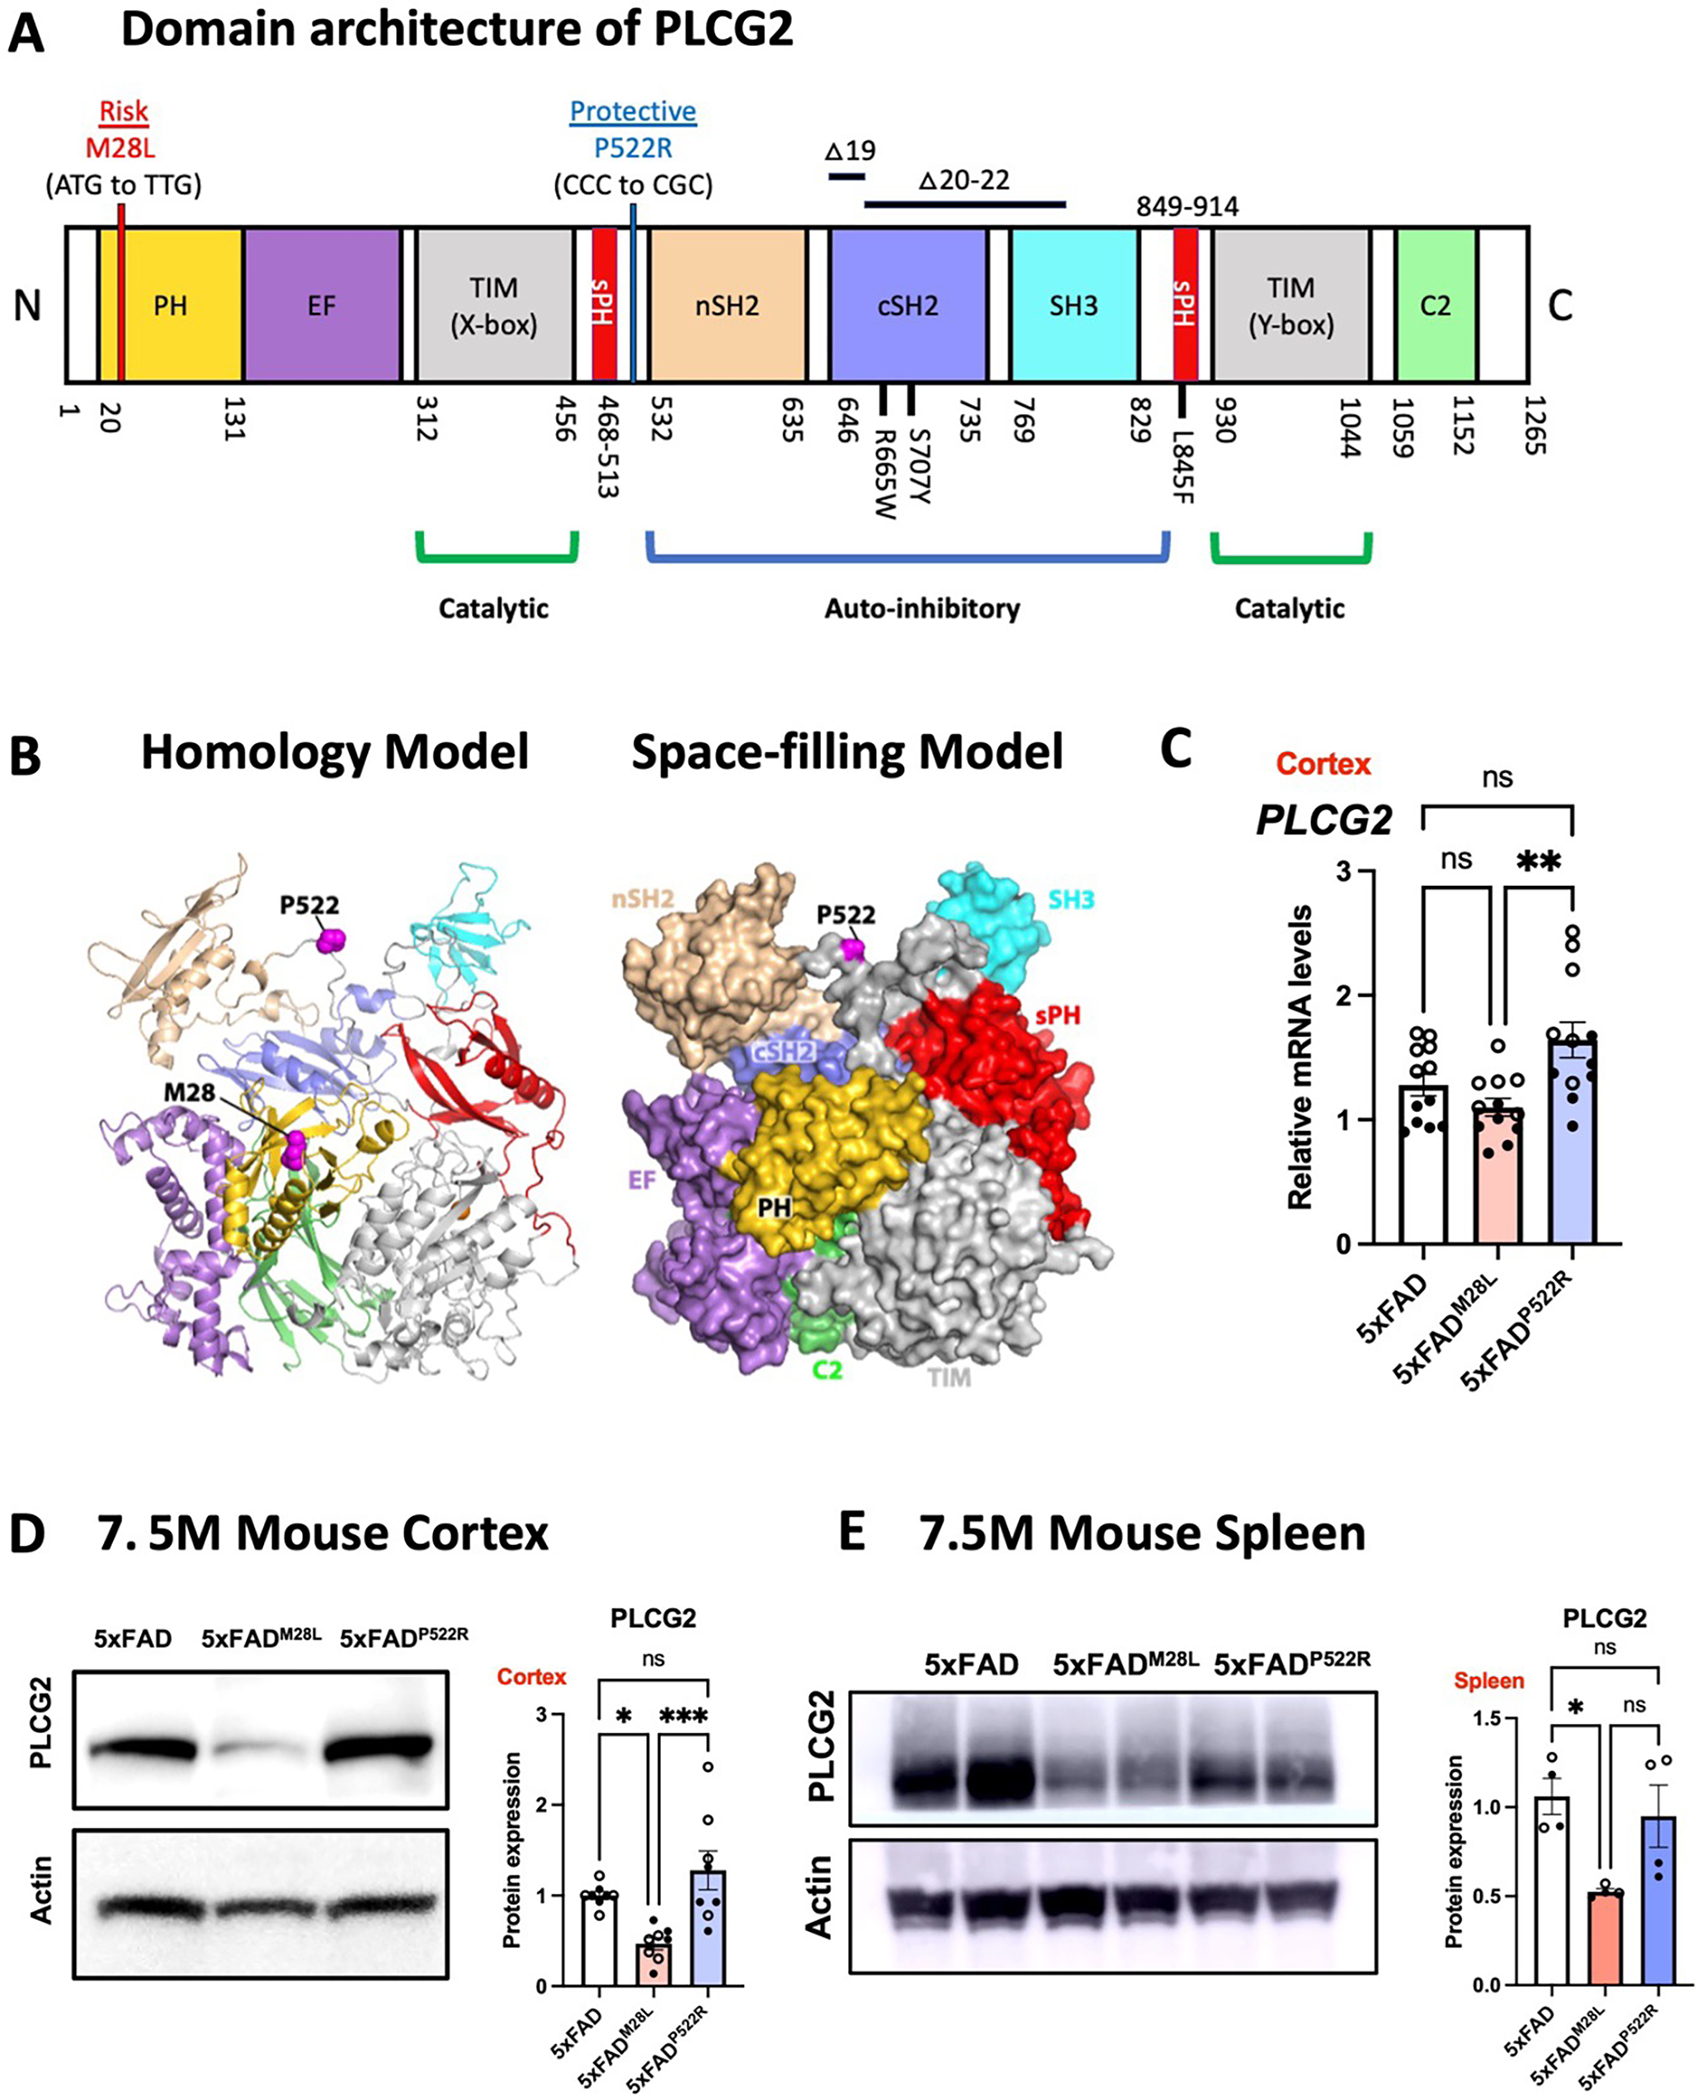
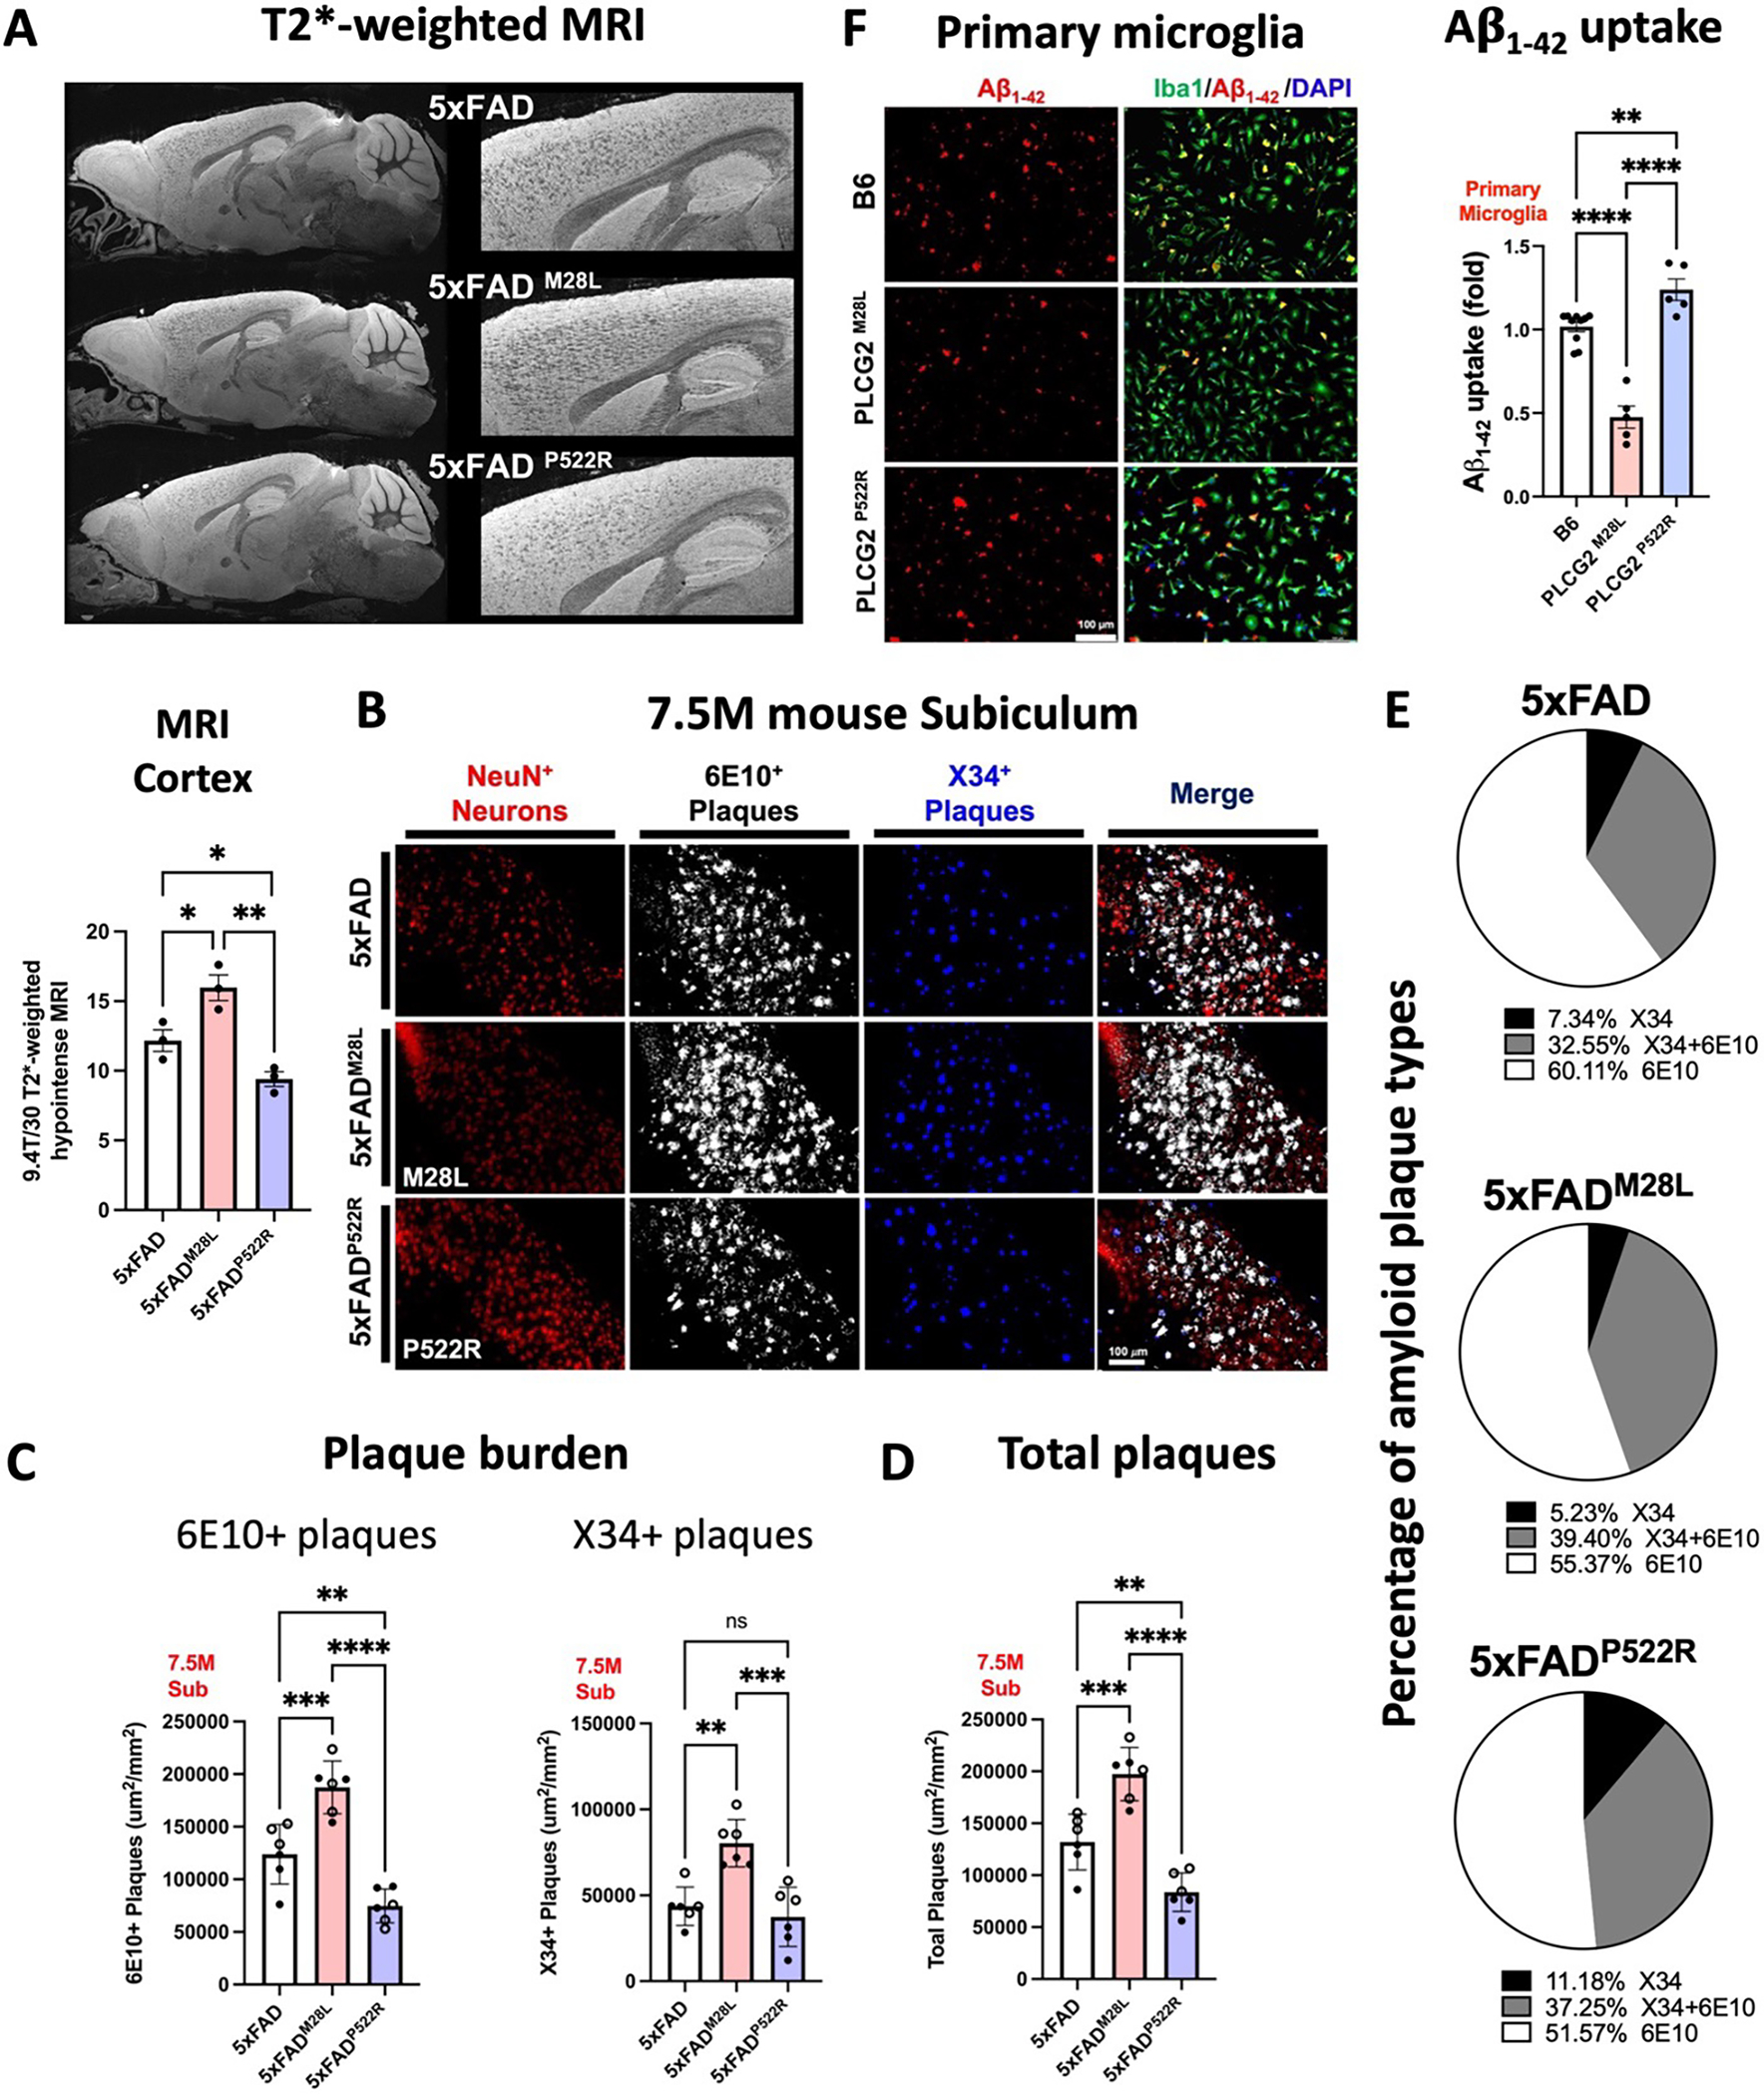
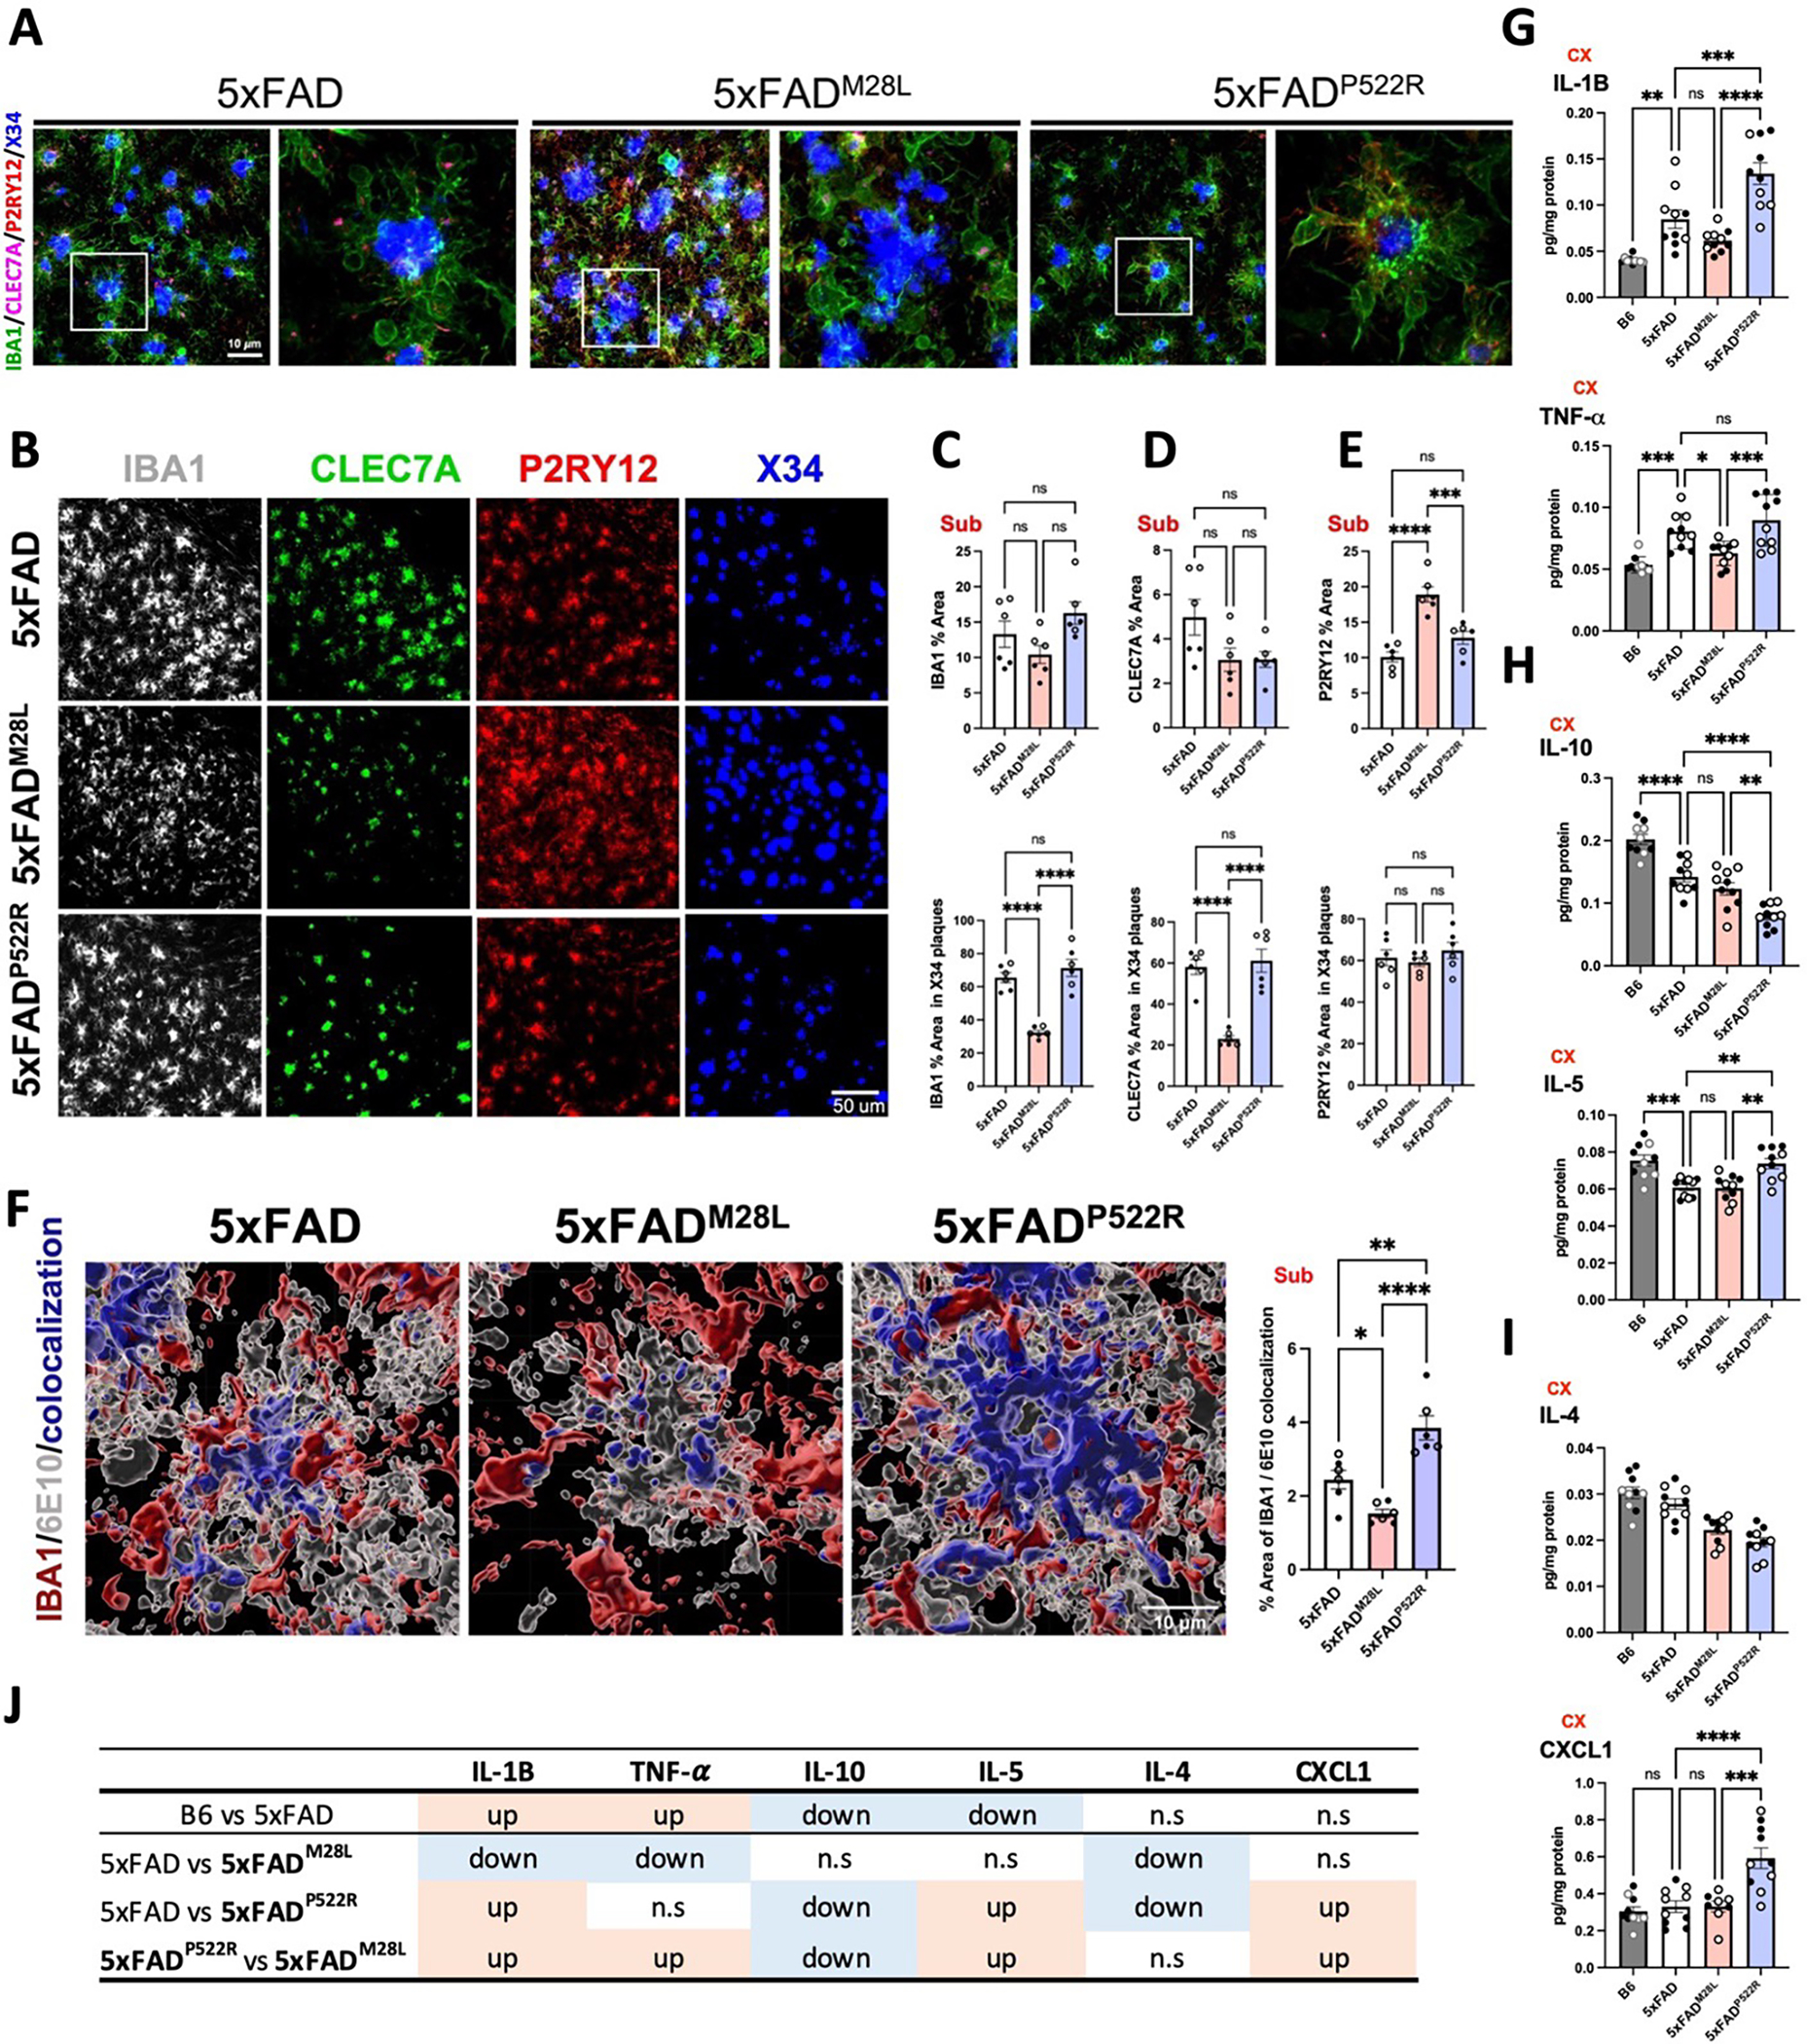
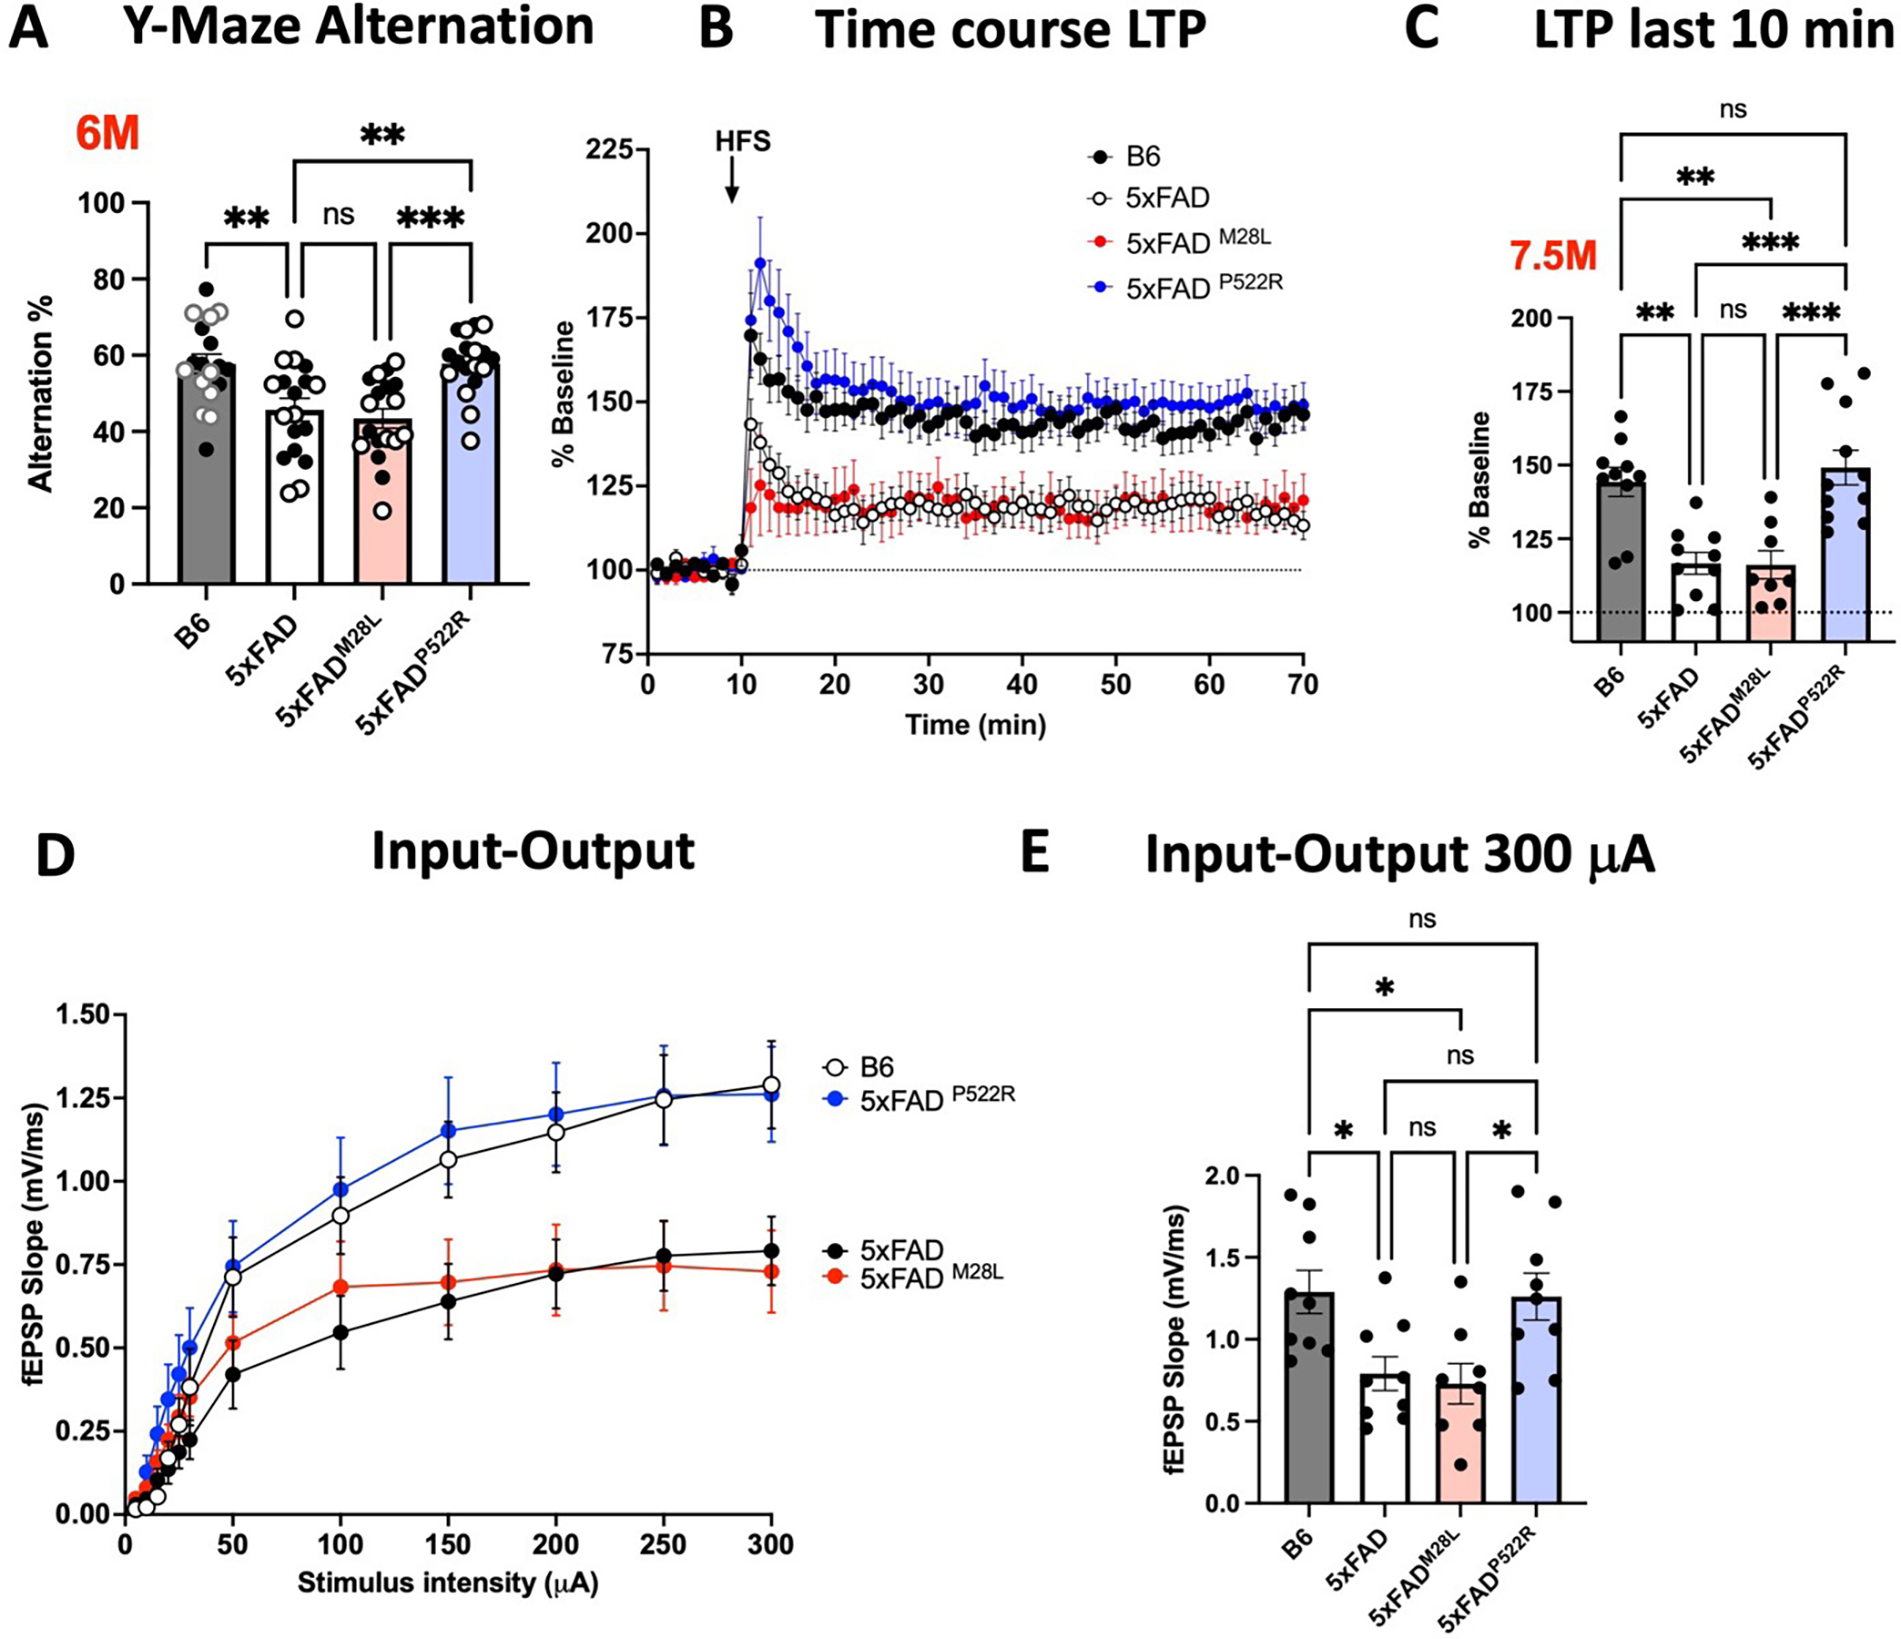
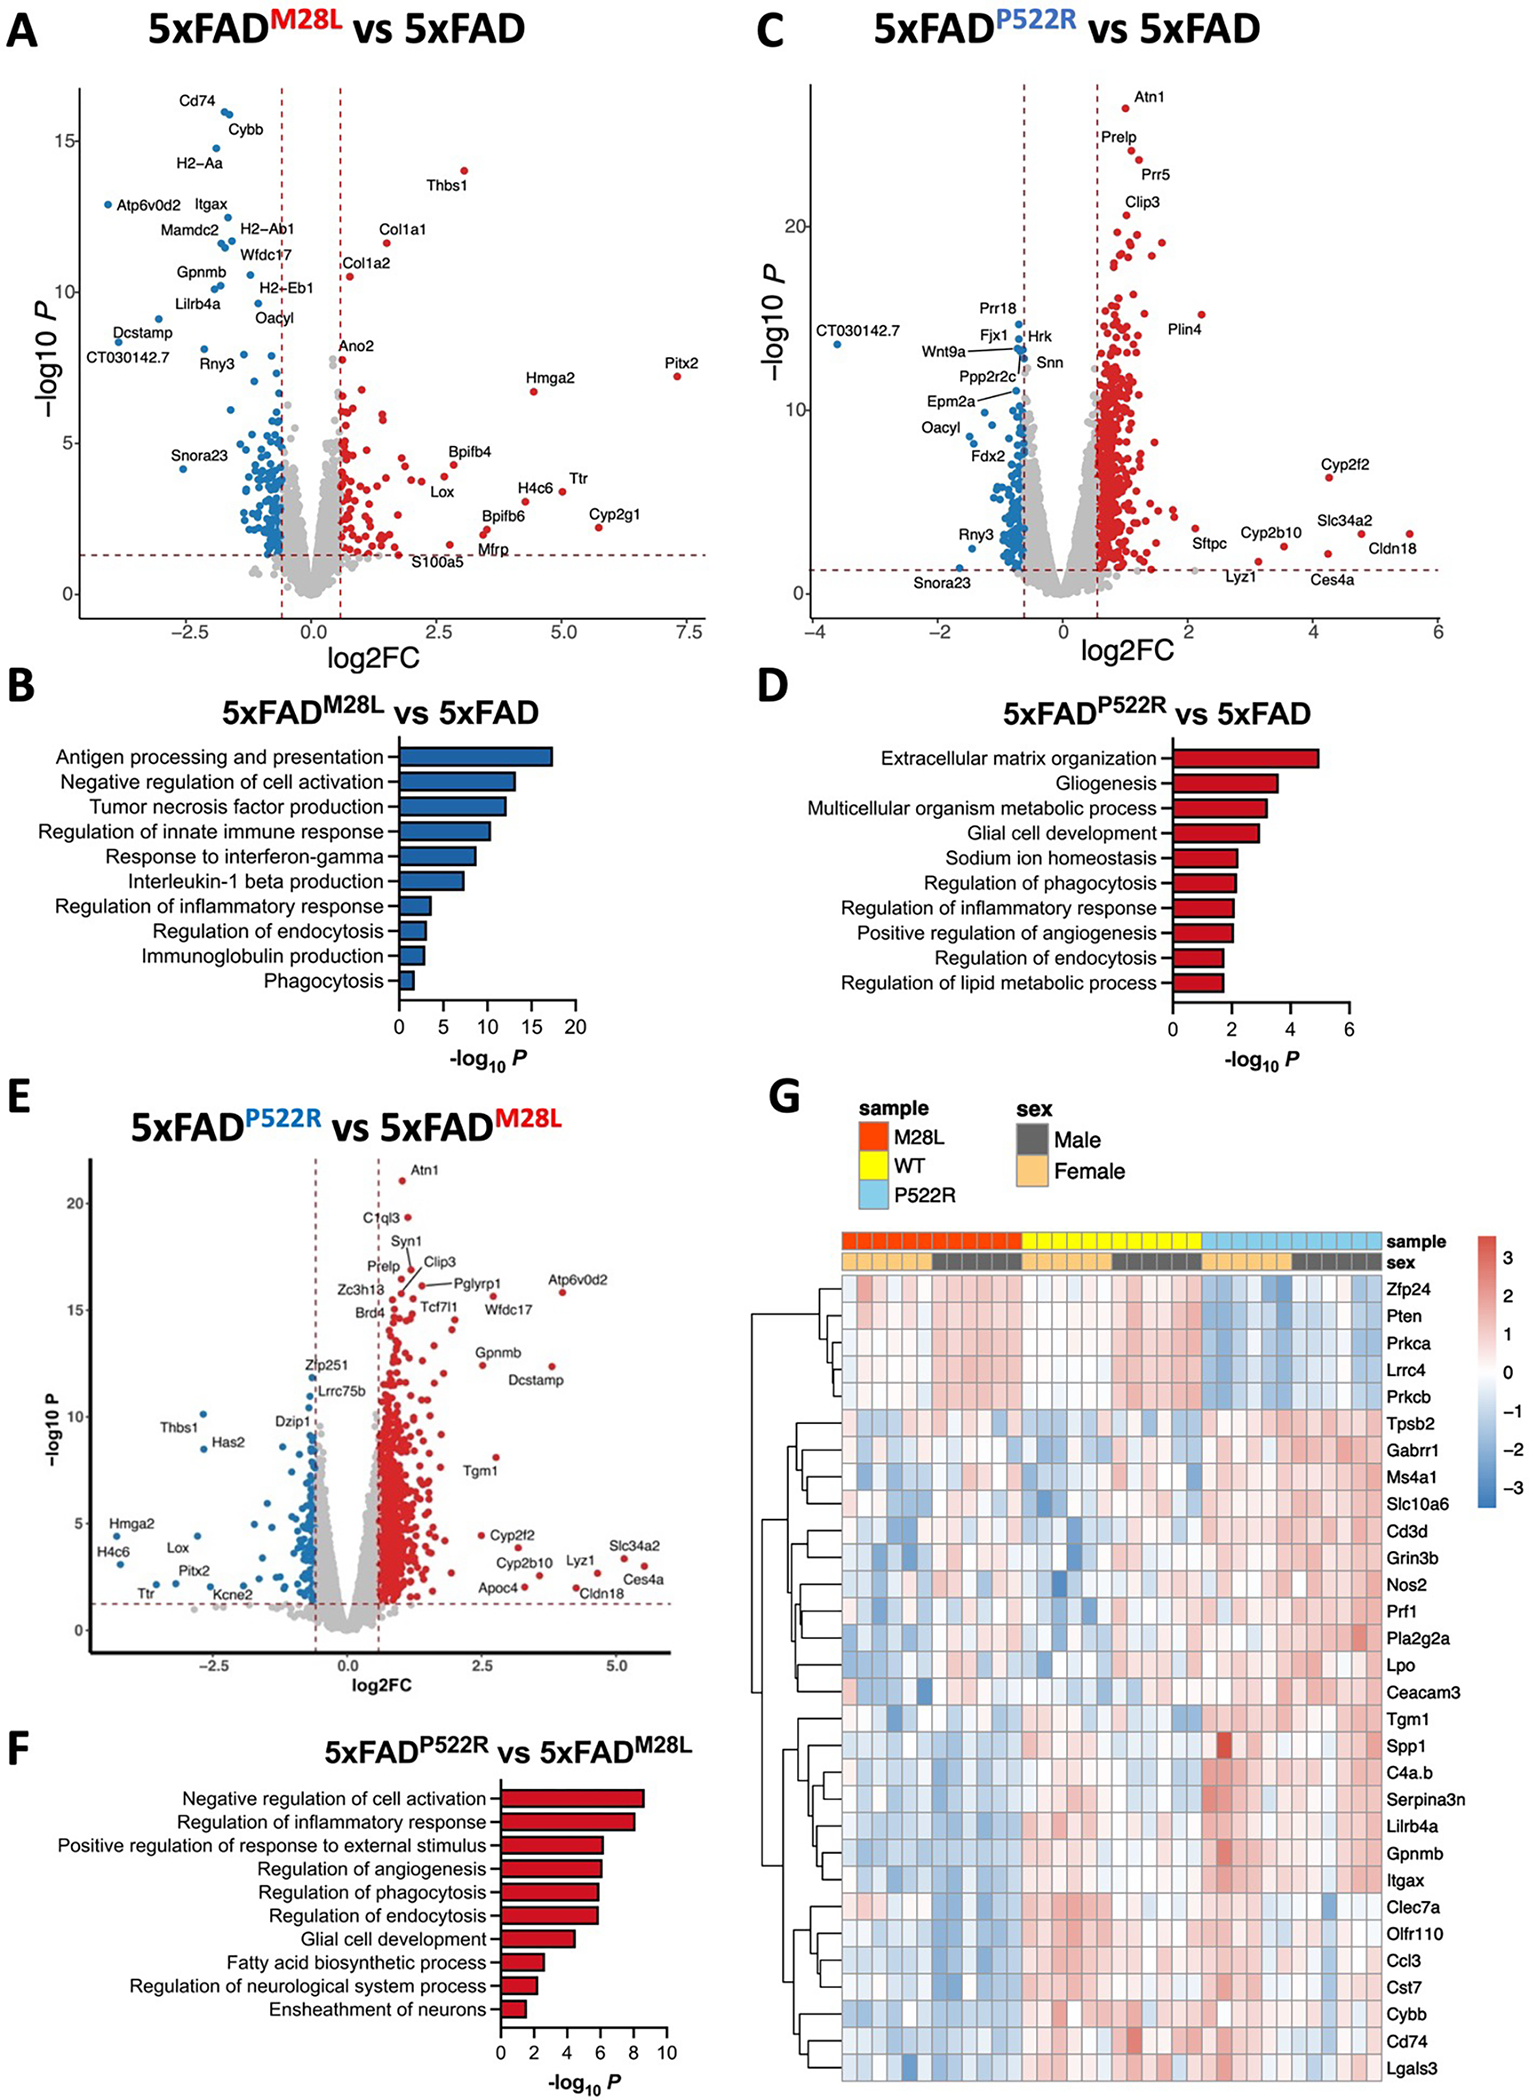
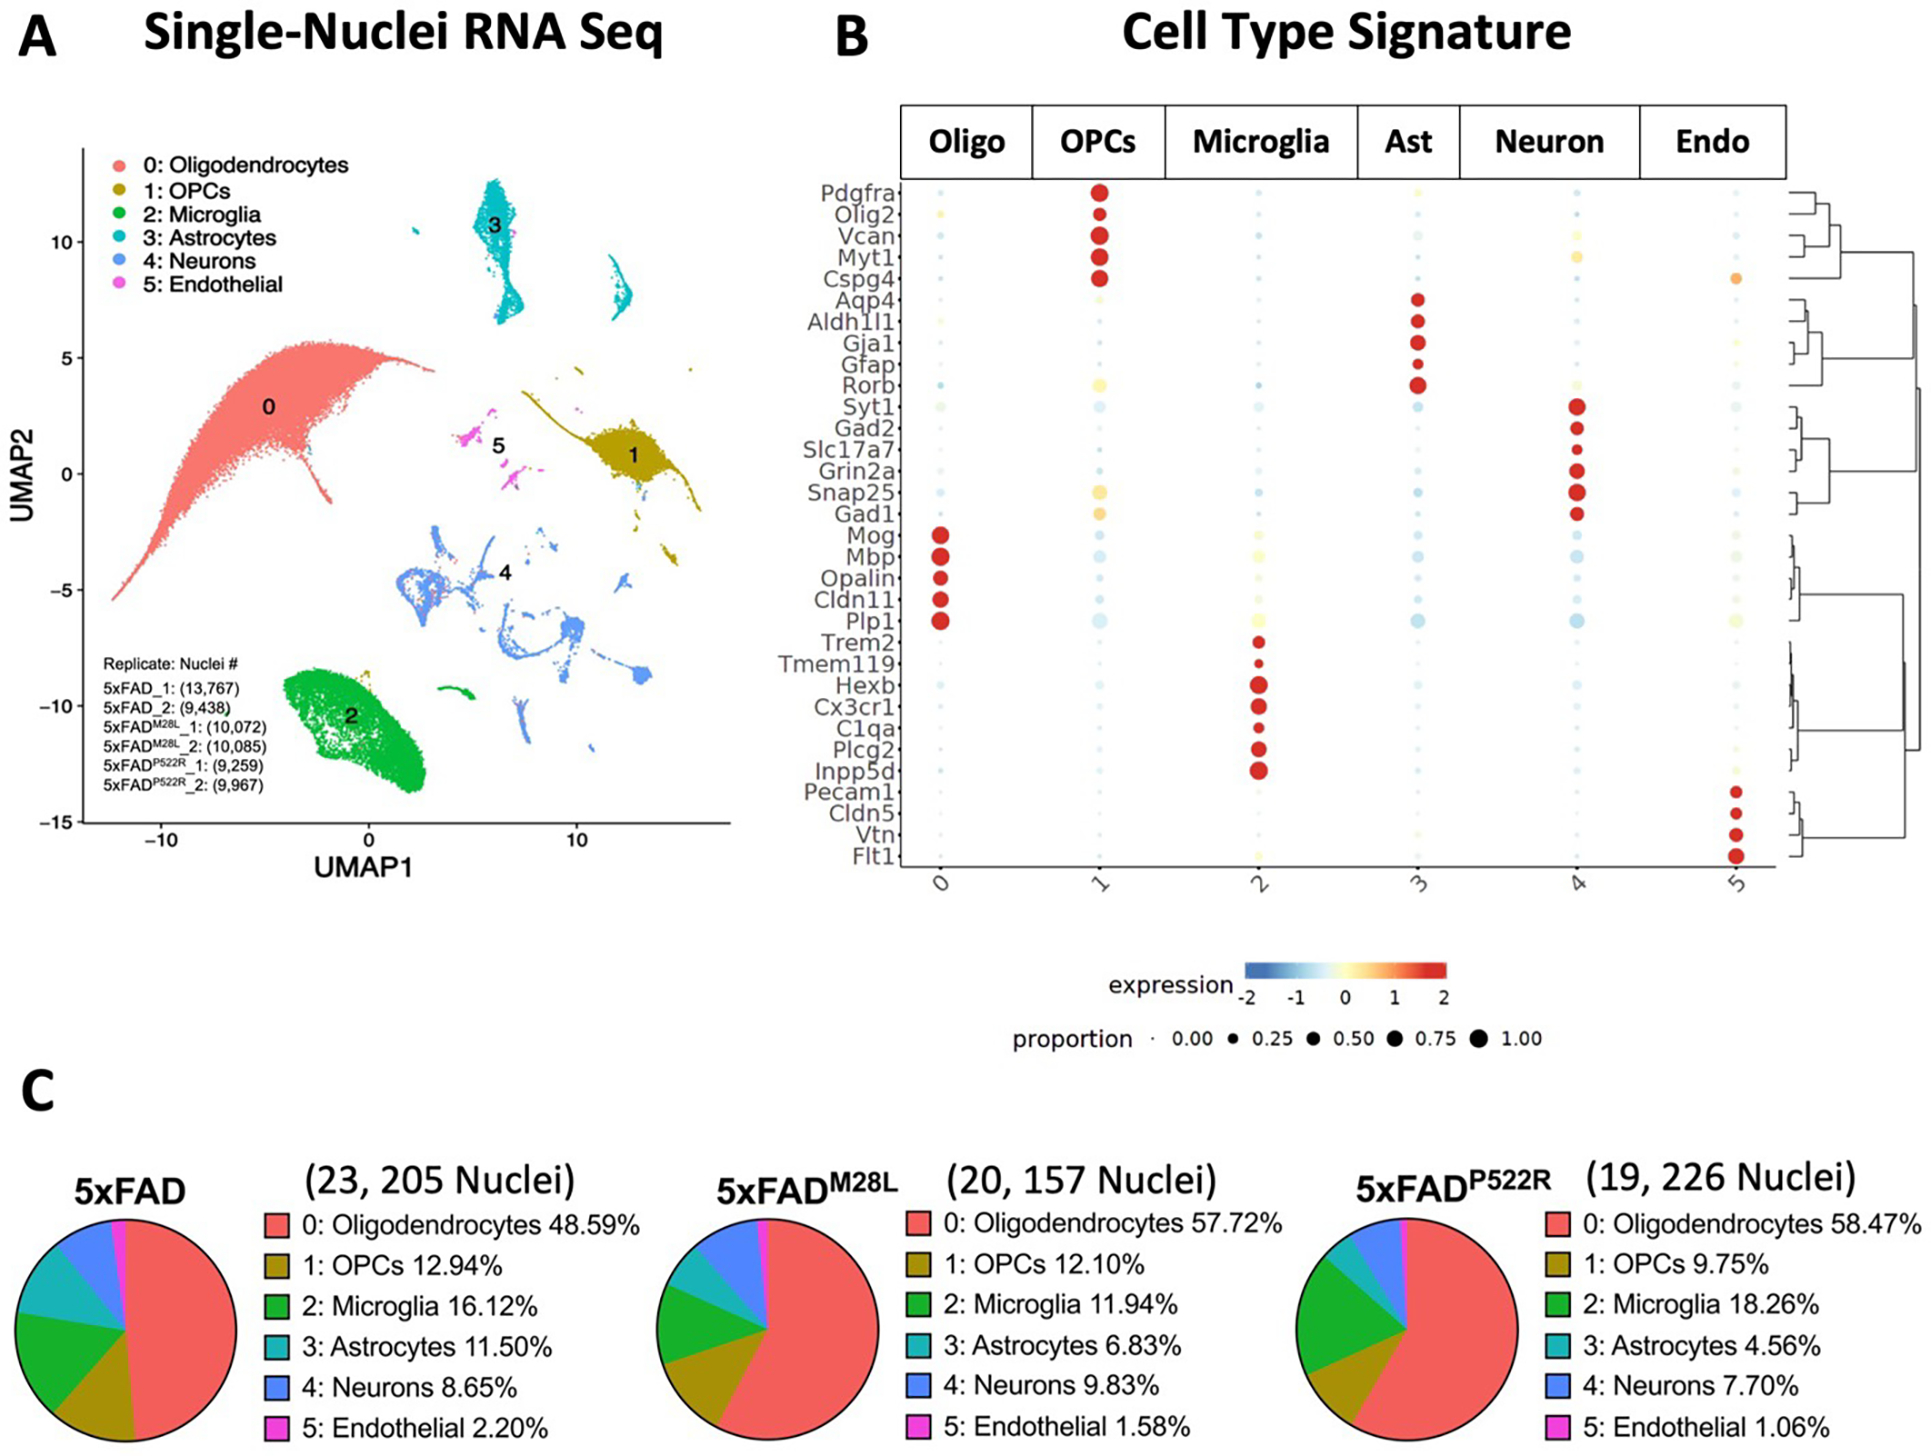
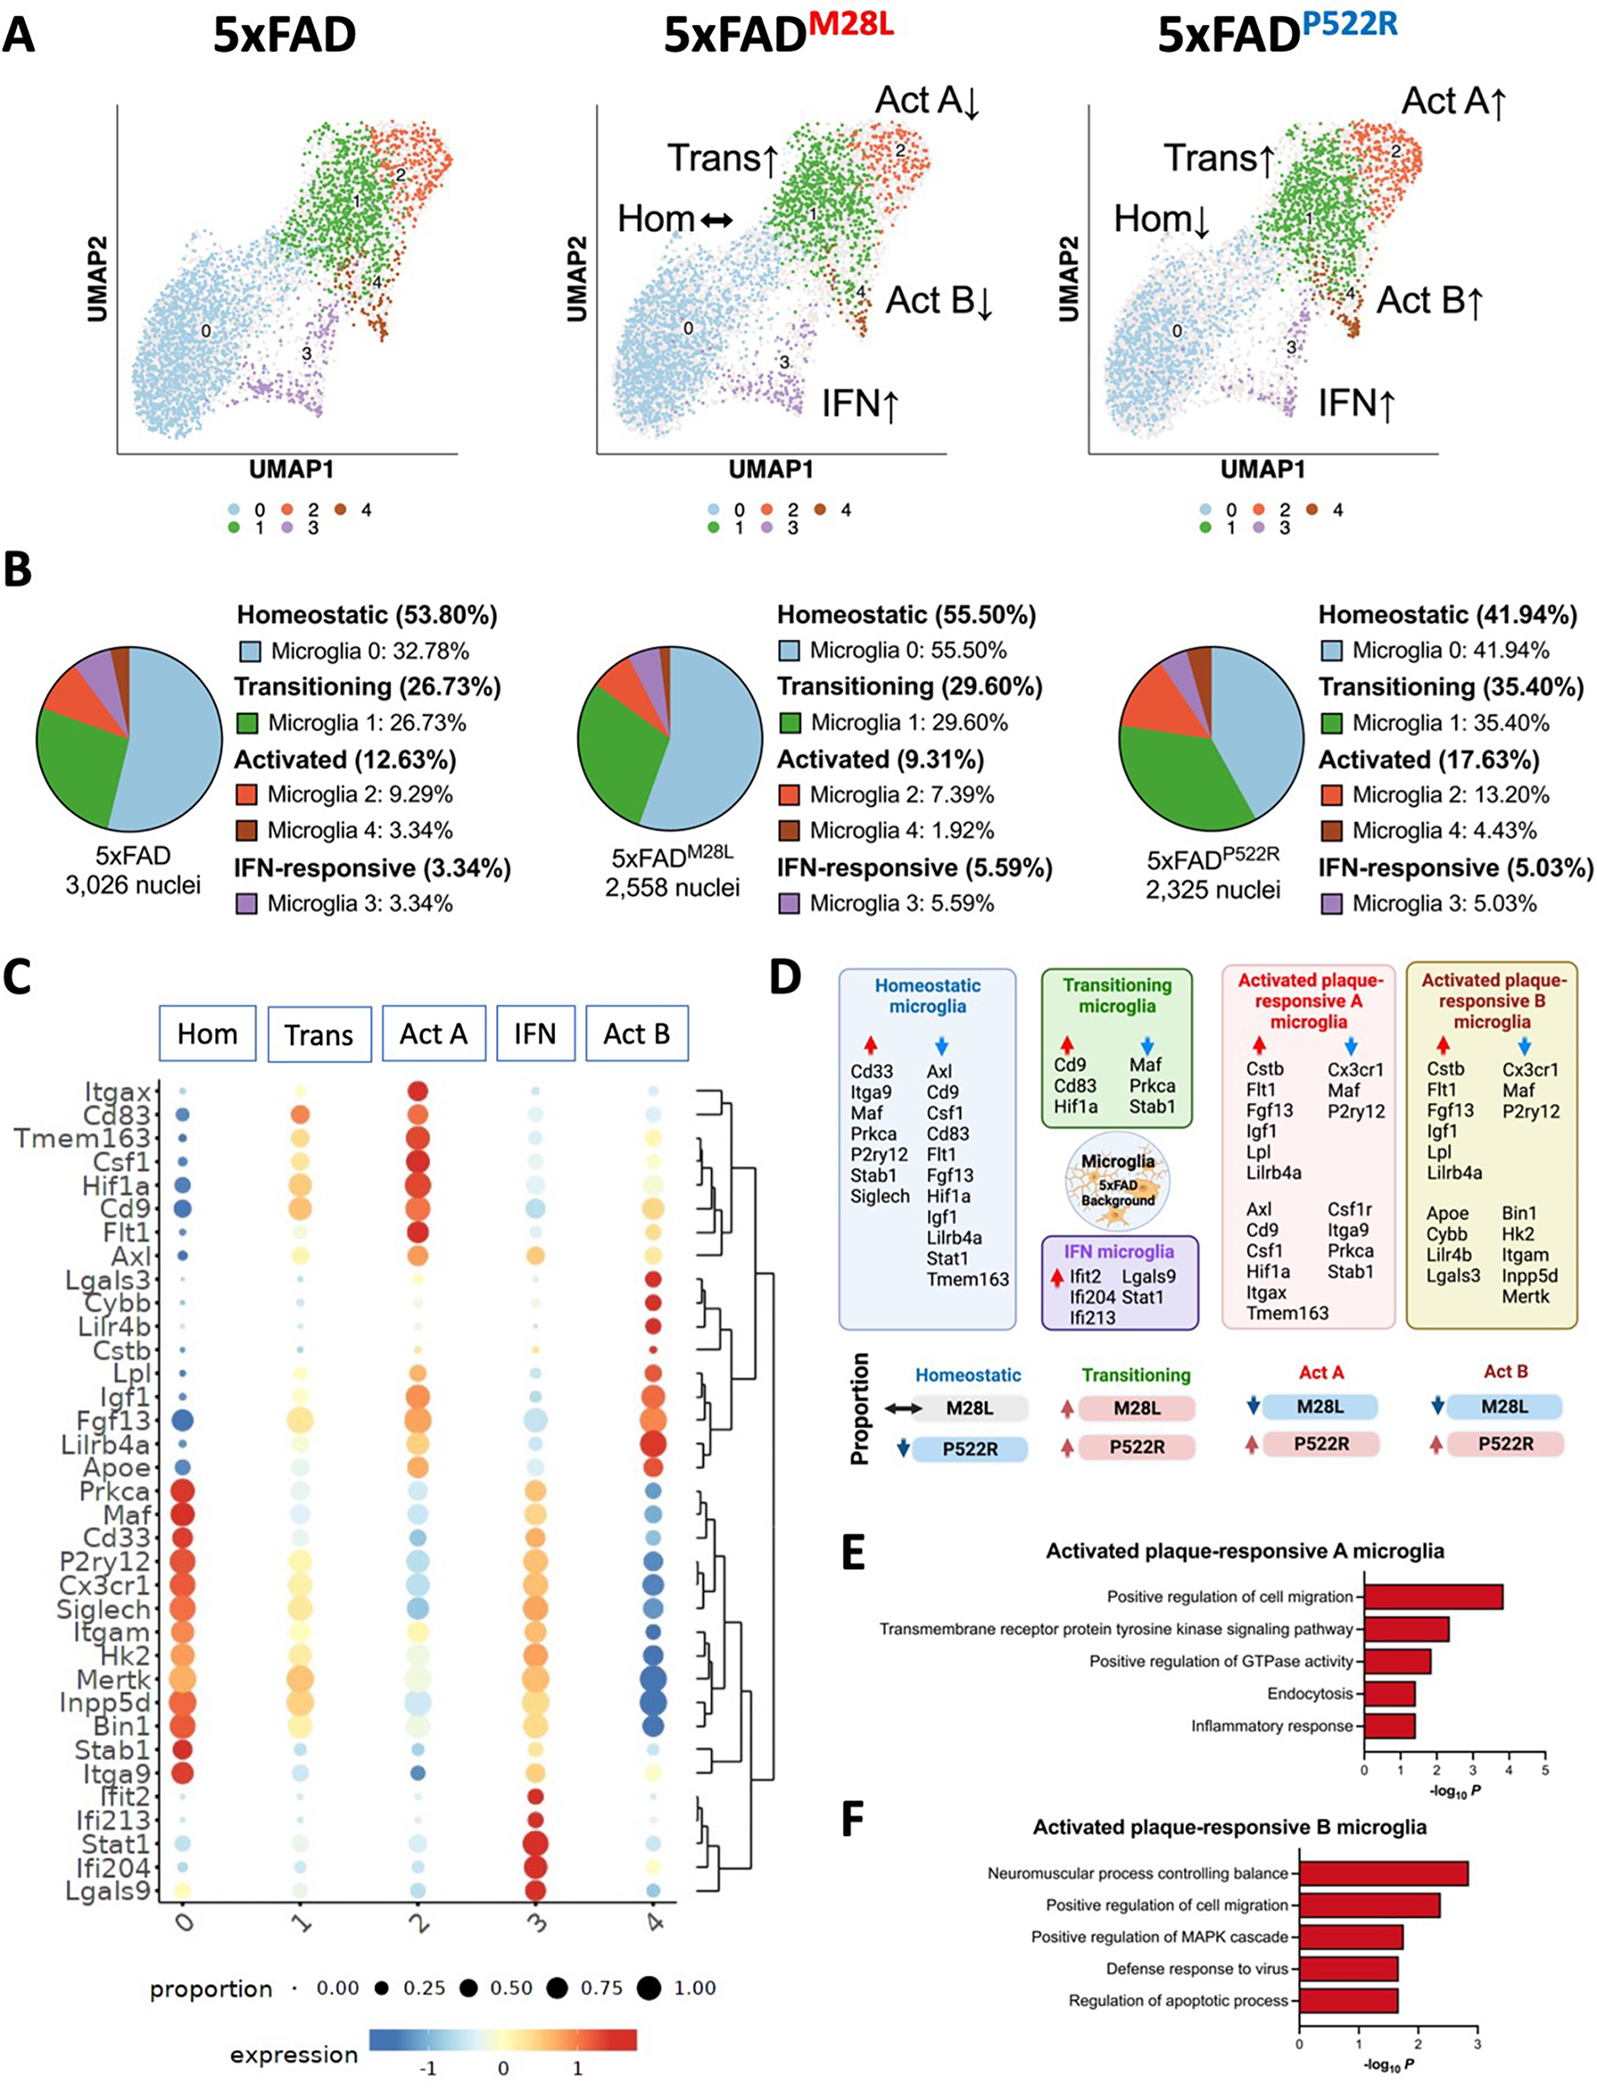
Genetic association studies have demonstrated the critical involvement of the microglial immune response in Alzheimer's disease (AD) pathogenesis. Phospholipase C-gamma-2 (PLCG2) is selectively expressed by microglia and functions in many immune receptor signaling pathways. In AD, PLCG2 is induced uniquely in plaque-associated microglia. A genetic variant of PLCG2, PLCG2P522R, is a mild hypermorph that attenuates AD risk. Here, we identified a loss-of-function PLCG2 variant, PLCG2M28L, that confers an increased AD risk. PLCG2P522R attenuated disease in an amyloidogenic murine AD model, whereas PLCG2M28L exacerbated the plaque burden associated with altered phagocytosis and Aβ clearance. The variants bidirectionally modulated disease pathology by inducing distinct transcriptional programs that identified microglial subpopulations associated with protective or detrimental phenotypes. These findings identify PLCG2M28L as a potential AD risk variant and demonstrate that PLCG2 variants can differentially orchestrate microglial responses in AD pathogenesis that can be therapeutically targeted.

Keywords: Alzheimer’s disease; P522R and M28L variant; amyloid pathology; microglia; microglia-plaque interactions; microglial uptake capacity; neuroinflammation; phospholipase C-gamma-2; synaptic function; transcriptional programs.


Conflict of interest statement

Declaration of interests The authors declare no competing interests.

Figures

Figure 1.
Figure 1.. The PLCG2M28L variant is associated with AD risk and downregulates PLCG2 expression
(A) Genetic linkage data of PLCG2M28L and PLCG2P522R with respect to AD risk are shown with the domain architecture of PLCG2 (to scale). Somatic mutations (R665W and S707Y) in PLCG2 are shown in the domain architecture. (B) PLCG2M28L (risk) and PLCG2P522R (protective) variants are mapped onto the structure of PLCG2 (magenta spheres) in both the homology model (left) and the space-filling model (right). (C). Gene expression of Plcg2 were assessed in cortical samples from 7.5-month-old 5xFAD, 5xFADM28L, and 5xFADP522R mice (n=12 per group; 6 male and 6 female mice). (D) Representative immunoblots and quantifications of PLCG2 protein expression in cortical lysates show reduced PLCG2 expression in 5xFADM28L mice (n=8 per group; 4 male and 4 female mice; 4 experiments). (E) Representative immunoblots and quantification of PLCG2 protein expression from the spleen show reduced PLCG2 expression in 5xFADM28L mice (n=4 per group; 2 male and 2 female mice; 2 experiments). All data are presented as the mean ± SEM, analyzed by an ordinary one-way ANOVA and Tukey’s multiple comparisons test. * P <0.05; ** P< 0.01; *** P< 0.001; ns: not significant. Male mice are marked with a solid circle (•), and the female mice are marked with a hollow circle (∘). See also Figure S1. OR odds ratio, N amino-terminus, C carboxyl-terminus, PH pleckstrin homology domain, EF EF hand motif, TIM TIM barrel, sPH split PH domain, nSH2 n-terminus, Src Homology 2 domain, cSH2 c-terminus Src Homology 2 domain, SH3 SRC Homology 3 domain, C2 C2 domain, WT wild-type,
Figure 2.
Figure 2.. PLCG2 variants affect plaque pathology and microglial uptake of Aβ aggregates
(A) Representative T2*-weighted images and quantitative hypointense signal results in the cortex of 7.5-month-old AD mice. (B) Representative images of amyloid plaques in the subiculum of 7.5-month-old AD mice (6 experiments). (C) Immunofluorescence analysis of diffuse 6E10 (white) and compact X34 (blue) positive plaque density in the subiculum. (D) Scatter plots show the quantification of the total plaque (6E10-positive and X34-positive) area in the subiculum. (E) Graphs denoting the percentage of plaques labeled with X34, 6E10, or their colocalized area. (F) Immunofluorescence analysis of primary murine microglia from B6, PLCG2M28L, and PLCG2P522R mice incubated with fluorescently labeled-Aβ1–42 aggregates (red). Cells were stained with Iba1 (microglia, green) and DAPI (nuclei, blue). Quantification results of Aβ uptake by fluorescence per cell are shown (5 experiments). All data are expressed as the mean values ± SEM and analyzed by an ordinary one-way ANOVA and Tukey’s multiple comparisons test (*P < 0.05, **P < 0.01, and ***P < 0.001; ns: not significant). Male mice: •; female mice: ∘. See also Figure S2.
Figure 3.
Figure 3.. PLCG2 variants differentially alter microglial phenotypes and responses to plaques in the 5xFAD mice.
Confocal images (A) and representative images (B) of 7.5-month-old 5xFAD, 5xFADM28L, and 5xFADP522R mouse subiculum stained with IBA1, CLEC7A, and P2RY12 to label microglia and X34 to label amyloid plaques (n=6 per group; 3 male and 3 female mice; 6 experiments). Bar, 10 μm. (C-E) Scatter plots show quantification of IBA1 (C), CLEC7A (D), and P2RY12 (E) staining in the subicula of 7.5- month-old mice (n=6,). The upper graphs show the total percentage of the area stained. The bottom graphs show the quantification of the percentage volume within individual plaque areas. (F) Representative images and quantitative results of 6E10-positive Aβ internalization by IBA1-positive microglia in subicula using Imaris software (n=6 per group; 3 male and 3 female mice; 6 experiments). (G-I) Protein concentrations of cytokines were measured from the cortex of 7.5-month-old mouse brains (n=10). (J) Table summarizing the results from G to I. All data were normalized by total protein. All data are expressed as the mean values ± SEM and analyzed by an ordinary one-way ANOVA and Tukey’s multiple comparisons test (*P < 0.05, **P < 0.01, and ***P < 0.001; ns: not significant). Male mice: •; female mice: ∘. IBA1 Ionized calcium binding adaptor molecule 1, CLEC7A C-type lectin domain family 7 member A, P2RY12 Purinergic Receptor P2Y12, TNF-a Tumor necrosis factor-alpha, IL interleukin, CXCL1 C-X-C motif chemokine ligand 1
Figure 4.
Figure 4.. The hypermorphic P522R variant ameliorates impaired synaptic function in 5xFAD mice
(A) Working memory of 6-month-old B6, 5xFAD, 5xFADM28L, and 5xFADP522R mice assessed by percent spontaneous alternation in the Y-maze task (n=18 mice per group; 9 male and 9 female mice). (B) The PLCG2P522R variant ameliorated impaired LTP in 7.5-month-old male 5xFAD mice. (C) Data show an average of normalized fEPSP slope for the final 10 min of recording (60 to 70 min) relative to 10 min baseline average. (D) Input/output curves were obtained by plotting the slope of fEPSPs in the CA1 area of the hippocampus. (E) Input/output curves showed diminished basal synaptic transmission in 5xFAD and 5xFADM28L mice. Statistical analyses were performed by one-way ANOVA followed by Dunnett’s multiple comparison test. The results of individual values from the slices are shown in the scatter plot. Each genotype data set shows at least 4 male mice. All data are expressed as the mean values ± SEM (*P < 0.05, **P < 0.01, and ***P < 0.001; ns: not significant). Male mice: •; female mice: ∘. See also Figure S3. LTP Long-term potentiation, fEPSPs Extracellular recordings of field excitatory postsynaptic potential, ANOVA Analysis of variance
Figure 5.
Figure 5.. PLCG2 variants elicit distinct transcriptional programs in 5xFAD
Bulk RNA sequencing was performed on the cortex of 7.5-month-old mice of the indicated genotype. (A) The volcano plot shows significant DEGs (FDR<0.05, FC>1.5) in the cortex from 5xFADM28L mice (n=8, 4 male and 4 female mice) versus 5xFAD mice (n=8, 4 male and 4 female mice). (B) Top 10 Gene Ontology biological processes identified through analysis of the DEGs between 5xFADM28L and 5xFAD mice. (C) The volcano plot shows significant DEGs (FDR<0.05, FC>1.5) in the cortices from 5xFADP522R mice (n=8, 4 male and 4 female mice) versus 5xFAD mice. (D) Top 10 Gene Ontology biological processes identified through analysis of the DEGs between 5xFADP522R and 5xFAD mice. (E) The volcano plot shows significant DEGs in the cortices from 5xFADM28L mice versus 5xFADP522R mice. (F) Top 10 Gene Ontology biological processes identified through analysis of the DEGs between 5xFADM28L and 5xFADP522R mice. (G) Nanostring nCounter Gial Profiling and Neuropathology panels were employed to analyze cortical RNA. The gene expression heatmap shows selected DEGs derived from the NanoString analysis of cortices of 7.5-month-old mice (each genotype n=12, 6 male and 6 female; 1 experiment). DEGs differentially expressed genes, FDR false discovery rate, FC fold change
Figure 6.
Figure 6.. Single nuclei RNA-seq distinguishes the cell type–specific effects of PLCG2 variants -in the AD brain
(A) Uniform Manifold Approximation and Projection (UMAP) of 62,588 nuclei captured from 12 cortical samples across three genotypes of AD mice, annotated and colored by cell type (two replicates from each genotype and each replicate includes 1 male and 1 female mouse cortical sample). (B) Heatmap showing the expression of specific markers in each sample, identifying each cluster in A. (C) Pie chart showing the percentage of clusters in each genotype. Oligo Oligodendrocytes, OPCs Oligodendrocyte progenitor cells, Ast Astrocytes, Endo Endothelial cells
Figure 7.
Figure 7.. Single nuclei RNA-seq identifies PLCG2 variant-specific microglial signatures in AD
(A) UMAP plot of 7,909 nuclei showing the re-clustered microglia (from cluster 2 in Figure 6A) annotated and colored by microglial subcluster. (B) Pie chart showing the percentage of microglial subclusters. (C) Heatmap showing the expression of canonical microglial genes in each microglial subclusters, including homeostatic (Hom), transitioning (Trans), activated plaque-responsive (Act A and Act B), and IFN-responsive (IFN) for each genotype. (D) Schematic illustration showing microglial signature altered by PLCG2 variants switching between homeostatic, transitioning, activated plaque-responsive, and IFN-responsive microglial subclusters. Key genes involved in each microglial population are shown. The arrows indicate upregulated (red) or downregulated (blue) genes or proportions. (E) Top 5 Gene Ontology biological processes identified through analysis of the upregulated DEGs in activated plaque-responsive microglia A subcluster. (F) Top 5 Gene Ontology biological processes identified through analysis of the upregulated DEGs in activated plaque-responsive microglia B subcluster. See also Figure S4, S5, and S6. Hom homeostatic, Trans transitioning, Act activated plaque-responsive, IFN interferon-responsive

Comment in

References

    1. Olah M, Menon V, Habib N, Taga MF, Ma Y, Yung CJ, Cimpean M, Khairallah A, Coronas-Samano G, Sankowski R, et al. (2020). Single cell RNA sequencing of human microglia uncovers a subset associated with Alzheimer’s disease. Nat Commun 11, 6129. 10.1038/s41467-020-19737-2. - DOI - PMC - PubMed
    1. Masuda T, Sankowski R, Staszewski O, Böttcher C, Amann L, Sagar, Scheiwe C, Nessler S, Kunz P, van Loo G, et al. (2019). Spatial and temporal heterogeneity of mouse and human microglia at single-cell resolution. Nature 566, 388–392. 10.1038/s41586-019-0924-x. - DOI - PubMed
    1. Keren-Shaul H, Spinrad A, Weiner A, Matcovitch-Natan O, Dvir-Szternfeld R, Ulland TK, David E, Baruch K, Lara-Astaiso D, Toth B, et al. (2017). A Unique Microglia Type Associated with Restricting Development of Alzheimer’s Disease. Cell 169, 1276–1290.e1217. 10.1016/j.cell.2017.05.018. - DOI - PubMed
    1. Lewcock JW, Schlepckow K, Di Paolo G, Tahirovic S, Monroe KM, and Haass C (2020). Emerging Microglia Biology Defines Novel Therapeutic Approaches for Alzheimer’s Disease. Neuron 108, 801–821. 10.1016/j.neuron.2020.09.029. - DOI - PubMed
    1. Andreone BJ, Przybyla L, Llapashtica C, Rana A, Davis SS, van Lengerich B, Lin K, Shi J, Mei Y, Astarita G, et al. (2020). Alzheimer’s-associated PLCγ2 is a signaling node required for both TREM2 function and the inflammatory response in human microglia. Nature Neuroscience 23, 927–938. 10.1038/s41593-020-0650-6. - DOI - PubMed

Publication types

LinkOut - more resources