Association between stillbirth and severe maternal morbidity
- PMID: 37659745
- PMCID: PMC10904670
- DOI: 10.1016/j.ajog.2023.08.029
Association between stillbirth and severe maternal morbidity
Abstract
Background: Severe maternal morbidity has been increasing in the past few decades. Few studies have examined the risk of severe maternal morbidity among individuals with stillbirths vs individuals with live-birth deliveries.
Objective: This study aimed to examine the prevalence and risk of severe maternal morbidity among individuals with stillbirths vs individuals with live-birth deliveries during delivery hospitalization as a primary outcome and during the postpartum period as a secondary outcome.
Study design: This was a retrospective cohort study using birth and fetal death certificate data linked to hospital discharge records from California (2008-2018), Michigan (2008-2020), Missouri (2008-2014), Pennsylvania (2008-2014), and South Carolina (2008-2020). Relative risk regression analysis was used to examine the crude and adjusted relative risks of severe maternal morbidity along with 95% confidence intervals among individuals with stillbirths vs individuals with live-birth deliveries, adjusting for birth year, state of residence, maternal sociodemographic characteristics, and the obstetric comorbidity index.
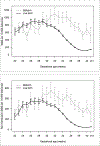
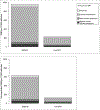
Results: Of the 8,694,912 deliveries, 35,012 (0.40%) were stillbirths. Compared with individuals with live-birth deliveries, those with stillbirths were more likely to be non-Hispanic Black (10.8% vs 20.5%); have Medicaid (46.5% vs 52.0%); have pregnancy complications, including preexisting diabetes mellitus (1.1% vs 4.3%), preexisting hypertension (2.3% vs 6.2%), and preeclampsia (4.4% vs 8.4%); have multiple pregnancies (1.6% vs 6.2%); and reside in South Carolina (7.4% vs 11.6%). During delivery hospitalization, the prevalence rates of severe maternal morbidity were 791 cases per 10,000 deliveries for stillbirths and 154 cases per 10,000 deliveries for live-birth deliveries, whereas the prevalence rates for nontransfusion severe maternal morbidity were 502 cases per 10,000 deliveries for stillbirths and 68 cases per 10,000 deliveries for live-birth deliveries. The crude relative risk for severe maternal morbidity was 5.1 (95% confidence interval, 4.9-5.3), whereas the adjusted relative risk was 1.6 (95% confidence interval, 1.5-1.8). For nontransfusion severe maternal morbidity among stillbirths vs live-birth deliveries, the crude relative risk was 7.4 (95% confidence interval, 7.0-7.7), whereas the adjusted relative risk was 2.0 (95% confidence interval, 1.8-2.3). This risk was not only elevated among individuals with stillbirth during the delivery hospitalization but also through 1 year after delivery (severe maternal morbidity adjusted relative risk, 1.3; 95% confidence interval, 1.1-1.4; nontransfusion severe maternal morbidity adjusted relative risk, 1.2; 95% confidence interval, 1.1-1.3).
Conclusion: Stillbirth was found to be an important contributor to severe maternal morbidity.
Keywords: acute renal failure; disseminated intravascular coagulation; obstetric comorbidity index score; postpartum; sepsis; severe maternal morbidity; shock; stillbirth; transfusion.
Copyright © 2023 Elsevier Inc. All rights reserved.
Conflict of interest statement
Disclosure
The authors report no conflict of interest.
Figures


References
-
- Fingar KR, Hambrick MM, Heslin KC, Moore JE. Trends and Disparities in Delivery Hospitalizations Involving Severe Maternal Morbidity, 2006–2015. Healthcare Cost and Utilization Project (HCUP) Statistical Briefs. 2018. - PubMed
Publication types
MeSH terms
Grants and funding
LinkOut - more resources
Full Text Sources
Medical
Miscellaneous

