. 2024 Apr;85(4):361-372.
doi: 10.1016/j.eururo.2023.07.016. Epub 2023 Aug 31.

Metformin Overcomes the Consequences of NKX3.1 Loss to Suppress Prostate Cancer Progression

Affiliations

Metformin Overcomes the Consequences of NKX3.1 Loss to Suppress Prostate Cancer Progression

Alexandros Papachristodoulou et al. Eur Urol. 2024 Apr.

Abstract

Background: The antidiabetic drug metformin has known anticancer effects related to its antioxidant activity; however, its clinical benefit for prostate cancer (PCa) has thus far been inconclusive. Here, we investigate whether the efficacy of metformin in PCa is related to the expression status of NKX3.1, a prostate-specific homeobox gene that functions in mitochondria to protect the prostate from aberrant oxidative stress.

Objective: To investigate the relationship of NKX3.1 expression and metformin efficacy in PCa.

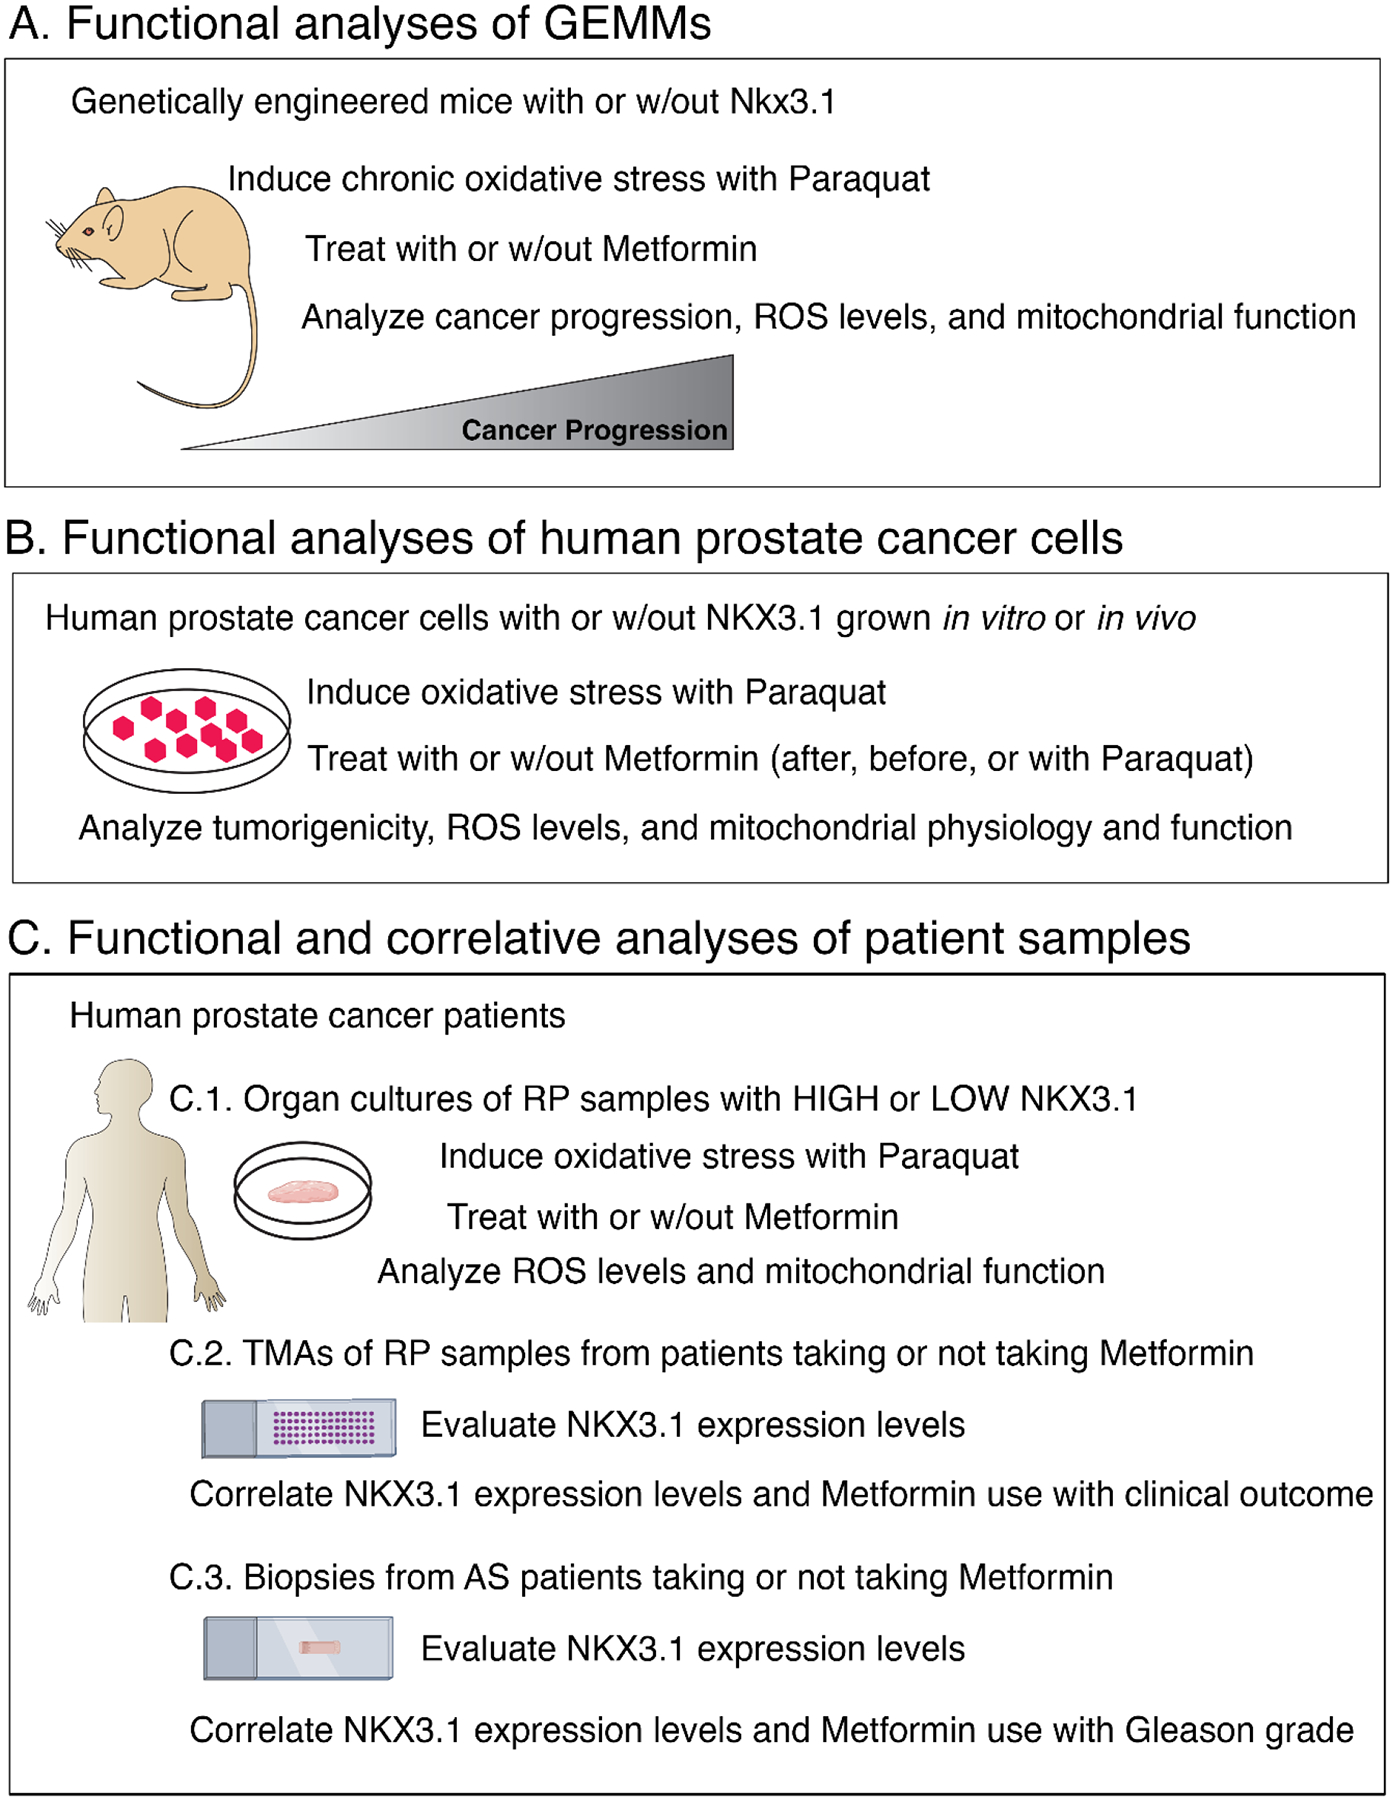
Design, setting, and participants: Functional studies were performed in vivo and in vitro in genetically engineered mouse models and human LNCaP cells, and organotypic cultures having normal or reduced/absent levels of NKX3.1. Correlative studies were performed using two independent retrospective tissue microarray cohorts of radical prostatectomies and a retrospective cohort of prostate biopsies from patients on active surveillance.

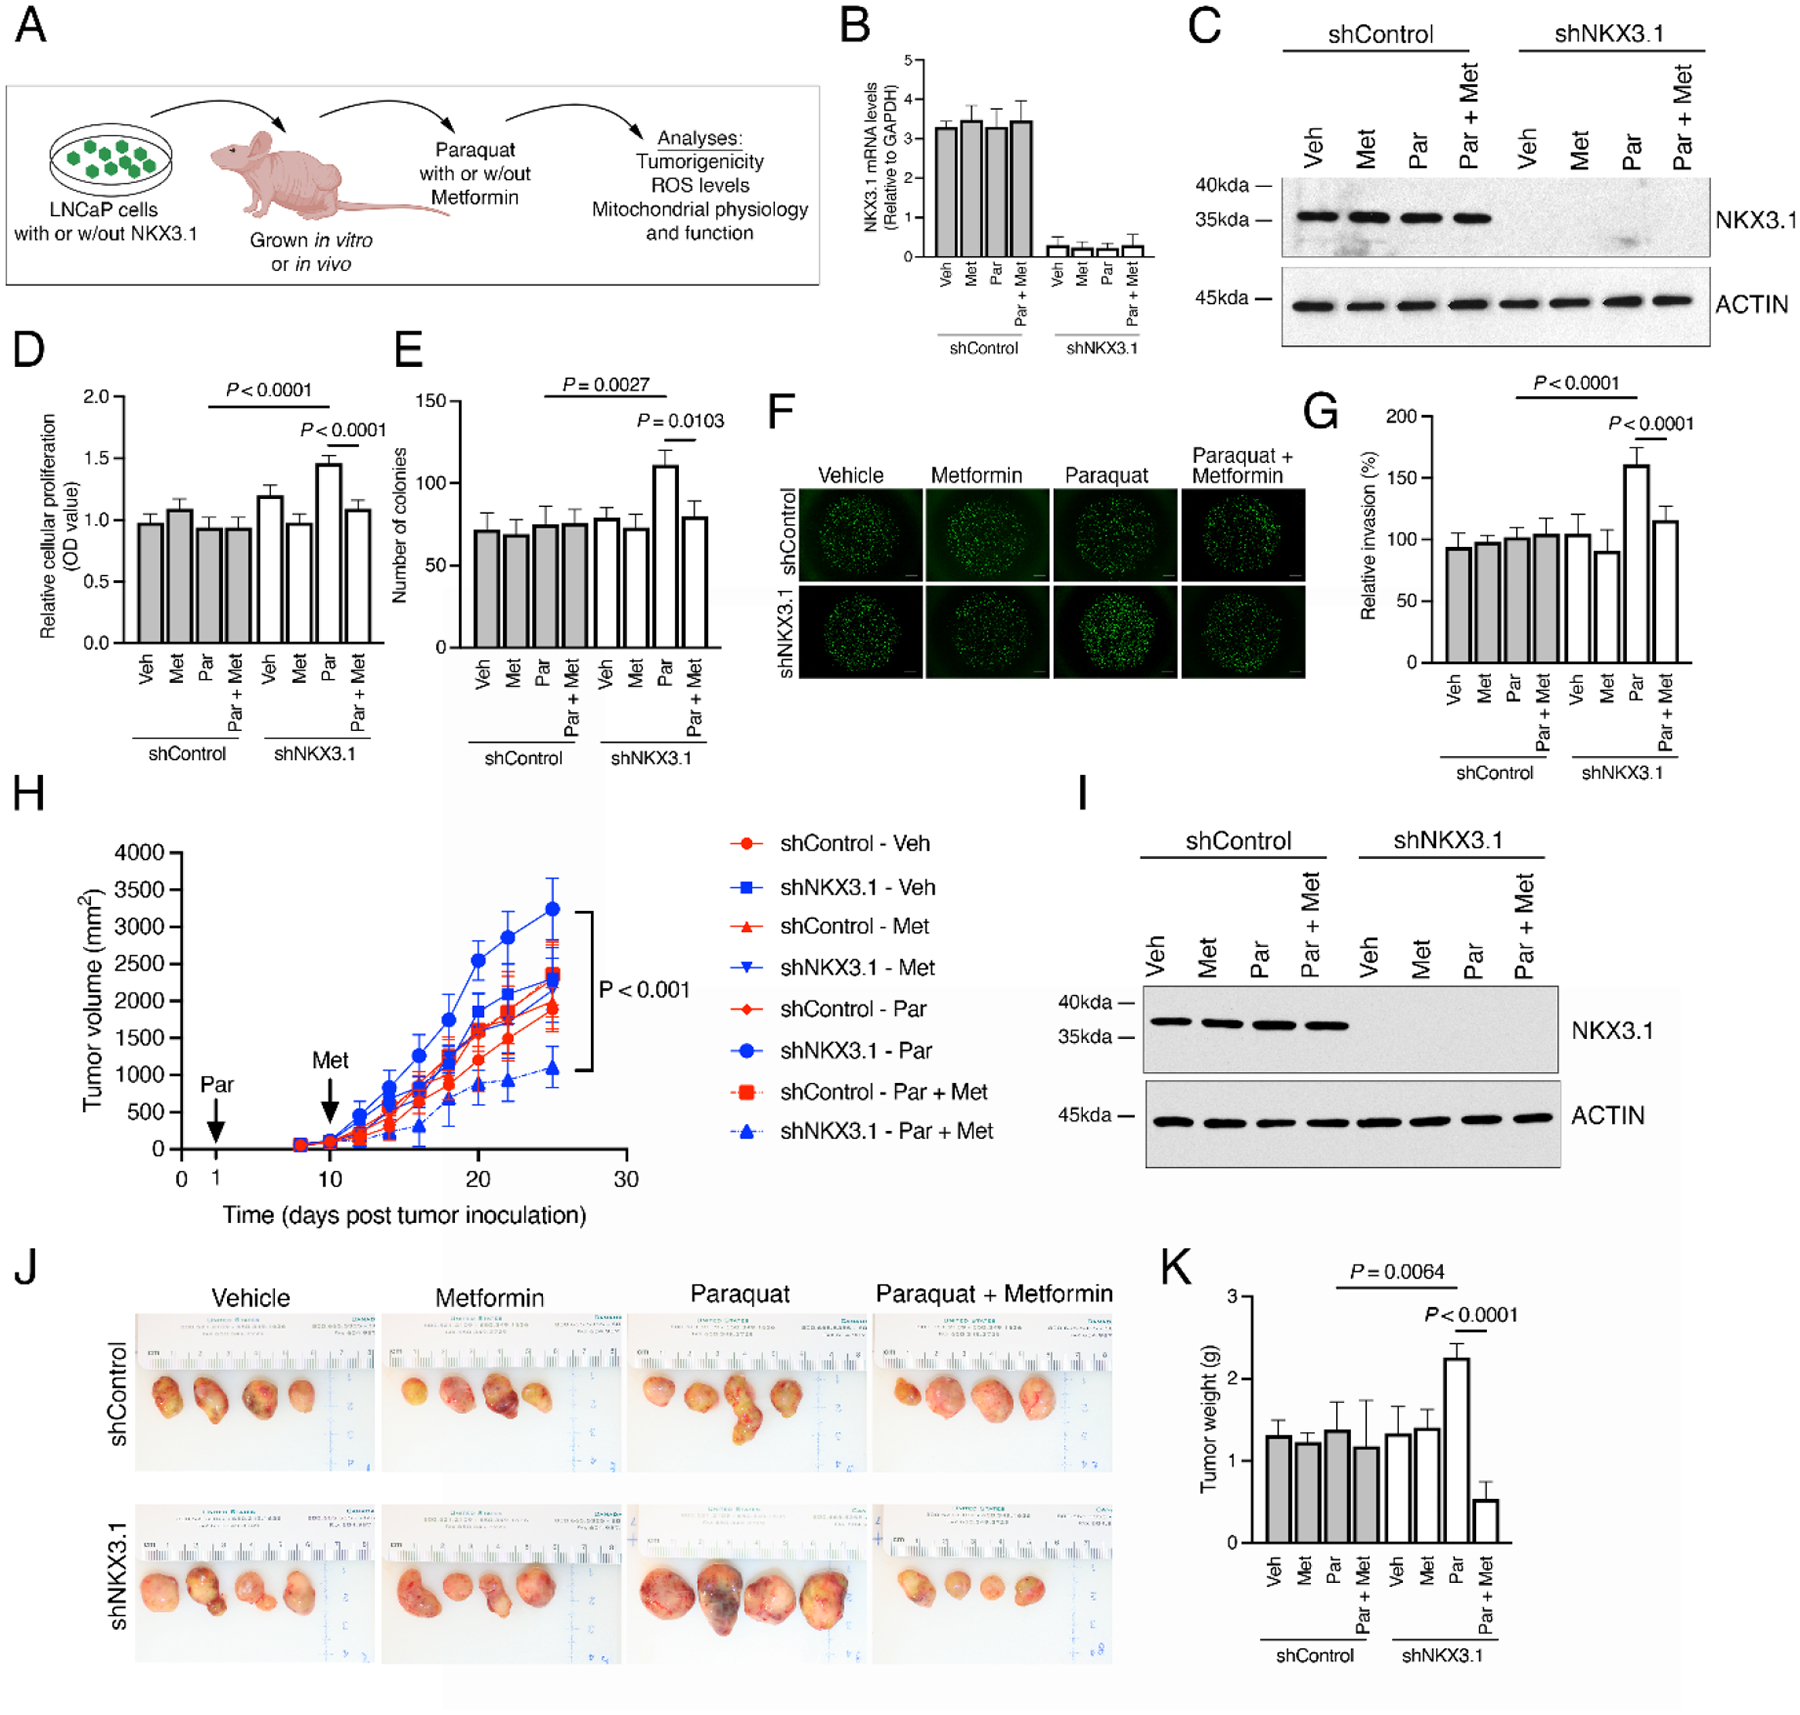
Intervention: Metformin was administered before or after the induction of oxidative stress by treatment with paraquat.

Outcome measurements and statistical analysis: Functional endpoints included analyses of histopathology, tumorigenicity, and mitochondrial function. Correlative endpoints include Kaplan-Meier curves and Cox proportional hazard regression models.

Results and limitations: Metformin reversed the adverse consequences of NKX3.1 deficiency following oxidative stress in vivo and in vitro, as evident by reduced tumorigenicity and restored mitochondrial function. Patients with low NKX3.1 expression showed a significant clinical benefit from taking metformin.

Conclusions: Metformin can overcome the adverse consequences of NKX3.1 loss for PCa progression by protecting against oxidative stress and promoting normal mitochondrial function. These functional activities and clinical correlates were observed only with low NKX3.1 expression. Thus, the clinical benefit of metformin in PCa may depend on the status of NKX3.1 expression.

Patient summary: Prostate cancer patients with low NKX3.1 are likely to benefit most from metformin treatment to delay disease progression in a precision interception paradigm.

Keywords: Metformin; Mitochondria; NKX3.1; Oxidative stress; Precision medicine; Prostate cancer.


Figures

Fig. 1 –
Fig. 1 –
Overview. Experimental strategy showing: (A) functional analyses of Nkx3.1 GEMMs in vivo (schematic for Fig. 2), (B) functional analyses of human LNCaP prostate cancer cells in vitro and in vivo (schematic for Fig. 3 and 4), and (C) functional and correlative analyses of human patient samples including (C.1) organ cultures, (C.2) TMAs, and (C.3) biopsy cohorts (schematic for Fig. 5). See the text for further details. AS = active surveillance; GEMM = genetically engineered mouse model; ROS = reactive oxygen species; RP = radical prostatectomy; TMA = tissue microarray; w/out = without.
Fig. 2 –
Fig. 2 –
Metformin reverses oxidative stress–induced PCa progression in Nkx3.1 mutant mice. (A) Experimental strategy: Nkx3.1 mutant (Nkx3.1–/–), but not wild-type (Nkx3.1+/+) mice develop high-grade prostatic intraepithelial neoplasia (HGPIN) by 12 mo of age after receiving paraquat (10 mg/kg/d in drinking water) for 9 mo. At 6 mo of paraquat treatment, cohorts of Nkx3.1+/+ and Nkx3.1–/– mice were randomly assigned to treatment with metformin (50 mg/kg/d in drinking water) or vehicle (water alone) and sacrificed at 12 mo of age for phenotypic and functional analyses as indicated. (B) Histopathological analyses. Shown are representative images of hematoxylin and eosin (H&E) staining and immunohistochemical (IHC) staining of anterior prostate from mice treated with vehicle alone, metformin, paraquat, or paraquat plus metformin, as indicated (15–20 per group). Scale bars represent 50 μm (low power) or 20 μm (high power). (C) Quantification of the PIN phenotype showing the relative percentage of occurrence of low-grade PIN (PIN1/2) and HGPIN (PIN3/4) in mice treated with vehicle alone (Veh), metformin (Met), paraquat (Par), or paraquat plus metformin (Par + Met). Data show the summary from analysis of 15–20 mice per group and are expressed as the mean percentage ± SD of the control; p values were calculated using chi-square test. (D) Quantification of Ki67 IHC staining from the anterior prostate of Nkx3.1+/+ or Nkx3.1–/– mice treated as indicated (five per group). (E) Quantification of mitochondrial ROS as detected by MitoSox fluorescence from the anterior prostate of Nkx3.1+/+ or Nkx3.1–/– mice treated as indicated (five per group). (F) Quantification of mitochondrial membrane potential as detected by TMRE fluorescence from the anterior prostate of Nkx3.1+/+ or Nkx3.1–/– mice treated as indicated (five per group). (G) Quantification of mitochondrial activity of ETC complexes I–V from isolated mitochondria of anterior prostatic tissues of Nkx3.1+/+ or Nkx3.1–/– mice treated as indicated (five samples per group). Figures 2E–G show data from three independent experiments. Unless otherwise indicated, p values were calculated using two-way ANOVA test. See also Supplementary Figures 1 and 2. ANOVA = analysis of variance; ETC = electron transport chain; PCa = prostate cancer; ROS = reactive oxygen species; SD = standard deviation; TMRE = tetramethylrhodamine ethyl ester.
Fig. 3 –
Fig. 3 –
Metformin reduces oxidative stress–induced tumorigenicity in NKX3.1-depleted human PCa cells. (A) Experimental strategy. Studies were performed in human LNCaP cells expressing an shRNA for NKX3.1 (shNKX3.1) or the control (shControl) that were grown in vitro (B–G) or implanted under the flank of a nude mouse host and grown in vivo (H–K). (B–G) In vitro analyses. Cells were treated with vehicle or paraquat (100 μM for 24 h) followed by metformin (50 μM for 24 h) and functional analyses were performed as indicated. (B) Quantitative real-time PCR analysis showing relative expression of NKX3.1 (three per group). (C) Western blot analyses of total protein lysates in LNCaP cells expressing shNKX3.1 or shControl. (D) Quantification of cellular proliferation as detected by MTT absorbance. (E) Quantification of colony number by staining for crystal violet. (F) Representative images from Matrigel invasion assays. Scale bars represent 200 μm. (G) Quantification of Matrigel invasion assays. (H–K) In vivo analyses. (H) Experimental strategy. LNCaP cells expressing an shRNA for NKX3.1 (shNKX3.1) or the control (shControl) were implanted in the flanks of nude mouse hosts. Mice were treated with vehicle (water alone) or paraquat (10 mg/kg/d in drinking water) initiated on day 1, followed by vehicle or metformin (50 mg/kg/d in drinking water) initiated on day 10, and functional analyses were performed as indicated (four per group). (H) Summary of tumor volume changes during the treatment period. (I) Western blot analyses of total protein lysates from the LNCaP tumors. (J) Representative images of LNCaP tumors at the time of sacrifice. (K) Summary of tumor weights. Unless otherwise indicated, shown are representative data from three independent experiments. The p values were calculated using two-way ANOVA test and two-sample unpaired Welch t test. See also Supplementary Figures 1 and 3. ANOVA = analysis of variance; Met = metformin; Par = paraquat; PCa = prostate cancer; PCR = polymerase chain reaction; ROS = reactive oxygen species; Veh = vehicle; w/out = without.
Fig. 4 –
Fig. 4 –
Metformin restores mitochondrial function following oxidative stress of NKX3.1-depleted human PCa cells. (A) A schematic summarizing the effect of metformin on mitochondrial oxidative stress, respiration (OXPHOS), and glycolysis in NKX3.1-deficient prostate cancer cells. Studies were performed in human LNCaP cells expressing shRNA for NKX3.1 (shNKX3.1) or the control (shControl), treated with paraquat (100 μM for 24 h) followed by metformin (50 μM for 24 h) as in Figure 3. (B) Quantification of mitochondrial ROS as detected by MitoSox fluorescence. (C) Quantification relative mitochondrial mass as detected by MitoTracker Red CMXRos. (D) Quantification of mitochondrial membrane potential as detected by TMRE fluorescence. (E) Quantification of the activity of mitochondrial ETC complexes I–V (five samples per group). (F) Seahorse analyses of mitochondrial respiration as measured by oxygen consumption rate. (G) The rates of ATP-linked, maximal and reserve respiration were quantified by normalization of oxygen consumption rate levels to the total protein optical density (OD) values. (H) Quantification of intracellular pyruvate, acetyl-CoA, and L-lactate metabolic intermediates. Unless otherwise indicated, shown are representative data from three independent experiments. The p values were calculated using two-way ANOVA test and two-sample unpaired Welch t test. See also Supplementary Figures 1 and 4. ANOVA = analysis of variance; ETC = electron transport chain; Met = metformin; Par = paraquat; PCa = prostate cancer; ROS = reactive oxygen species; TMRE = tetramethylrhodamine ethyl ester; Veh = vehicle.
Fig. 5 –
Fig. 5 –
Compensatory activity of metformin in PCa patients with low NKX3.1. (A–F) Prostate tissue organotypic assay. (A) Experimental strategy. Primary human prostate tissues were obtained directly from surgery and treated in vitro with paraquat (100 μM for 24 h) followed by metformin (50 μM for 24 h), and functional analyses were performed as indicated. (B) Representative images of H&E and NKX3.1 immunostaining of organotypic cultures treated with vehicle alone, metformin, paraquat, or paraquat plus metformin as indicated. Scale bars represent 50 μ m. (C–F) Analyses of human prostate organotypic cultures having “high” versus “low” levels of NKX3.1 expression. (C) Heat map showing NKX3.1 expression levels determined by RT-qPCR analyses. Data are expressed as relative mRNA levels (relative to 18s rRNA expression) showing the mean ± SD. (D) Quantification of mitochondrial ROS as detected by MitoSox fluorescence (five per group). (E) Quantification of relative ATP levels. (F) Quantification of NADH/NAD+ ratio. Unless otherwise indicated, shown are representative data from three independent experiments. The p values were calculated using two-way ANOVA test and two-sample unpaired Welch t test. (G-L) Analyses of TMA cohorts. (G) Experimental strategy. Two independent PCa TMA cohorts were assembled from RP. Cohort 1 comprises 73 RPs from patients who were taking (n = 38) or not taking (n = 35) metformin. Cohort 2 comprises 138 RPs from patients who were taking (n = 40) or not taking (n = 98) metformin. (H) NKX3.1 protein expression levels were examined by immunohistochemistry (IHC). Representative cases showing examples of high or low NKX3.1 expression. Scale bars represent 100 μm. Kaplan-Meier survival analyses for (I) cohort 1 and (J) cohort 2 showing association of NKX3.1 protein expression levels, metformin intake, and BCR-free estimated survival probability. The p values were estimated using a log-rank test. Cox proportional multivariate analyses for (K) cohort 1 and (L) cohort 2 with pairwise, two- and three-way interaction modeling of NKX3.1 protein expression levels, European Association of Urology (EAU) risk, metformin intake, diabetic status (only cohort 2), and associated with risk of BCR. Hazard ratio (HR) and confidence interval (CI) are indicated; p values were estimated using a Wald test. Chi-square and I2 index analyses for subgroup heterogeneity testing are also indicated; p < 10 considered significant. (M–O) Analyses of an active surveillance cohort. (M) Experimental strategy. The cohort comprised prostate biopsies from 23 patients who had not failed active surveillance for ≥10 yr; nine of the patients were taking metformin and 14 were not. NKX3.1 immunostaining was performed on the initial biopsies (n = 23) and the most recent biopsies (n = 23) for each patient. Samples were analyzed for NKX3.1 expression levels and a change in Gleason Grade. (N) Representative cases showing examples of high or low NKX3.1 expression. Scale bars represent 50 μm. (O) Quantification of PCa upgrading or downgrading. See also Supplementary Figures 5 and 6. ANOVA = analysis of variance; BCR = biochemical recurrence; H&E = hematoxylin and eosin; Met = metformin; Par = paraquat; PCa = prostate cancer; ROS = reactive oxygen species; RP = radical prostatectomy; RT-qPCR = reverse transcription quantitative polymerase chain reaction; SD = standard deviation; TMA = tissue microarray; Veh = vehicle; w/out = without.

Comment in

References

    1. Siegel RL, Miller KD, Fuchs HE, Jemal A. Cancer statistics, 2022. CA Cancer J Clin 2022;72:7–33. - PubMed
    1. Loeb S, Bruinsma SM, Nicholson J, et al. Active surveillance for prostate cancer: a systematic review of clinicopathologic variables and biomarkers for risk stratification. Eur Urol 2015;67:619–26. - PMC - PubMed
    1. Lovf M, Zhao S, Axcrona U, et al. Multifocal primary prostate cancer exhibits high degree of genomic heterogeneity. Eur Urol 2019;75:498–505. - PubMed
    1. Sartor O, de Bono JS. Metastatic prostate cancer. N Engl J Med 2018;378:645–57. - PubMed
    1. Papachristodoulou A, Abate-Shen C. Precision intervention for prostate cancer: reevaluating who is at risk. Cancer Lett 2022;538:215709. - PMC - PubMed