

Target trial emulation with multi-state model analysis to assess treatment effectiveness using clinical COVID-19 data
- PMID: 37660025
- PMCID: PMC10474639
- DOI: 10.1186/s12874-023-02001-8
Target trial emulation with multi-state model analysis to assess treatment effectiveness using clinical COVID-19 data
Abstract
Background: Real-world observational data are an important source of evidence on the treatment effectiveness for patients hospitalized with coronavirus disease 2019 (COVID-19). However, observational studies evaluating treatment effectiveness based on longitudinal data are often prone to methodological biases such as immortal time bias, confounding bias, and competing risks.
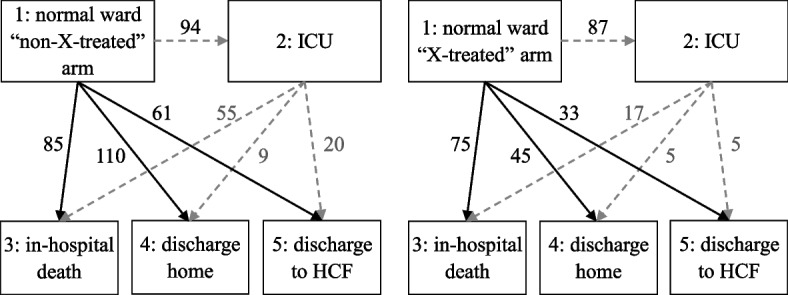
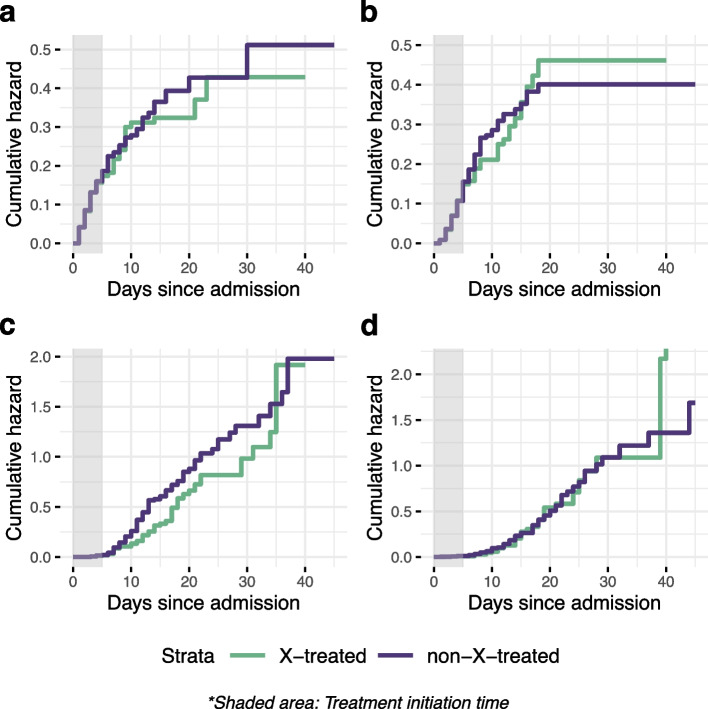
Methods: For exemplary target trial emulation, we used a cohort of patients hospitalized with COVID-19 (n = 501) in a single centre. We described the methodology for evaluating the effectiveness of a single-dose treatment, emulated a trial using real-world data, and drafted a hypothetical study protocol describing the main components. To avoid immortal time and time-fixed confounding biases, we applied the clone-censor-weight technique. We set a 5-day grace period as a period of time when treatment could be initiated. We used the inverse probability of censoring weights to account for the selection bias introduced by artificial censoring. To estimate the treatment effects, we took the multi-state model approach. We considered a multi-state model with five states. The primary endpoint was defined as clinical severity status, assessed by a 5-point ordinal scale on day 30. Differences between the treatment group and standard of care treatment group were calculated using a proportional odds model and shown as odds ratios. Additionally, the weighted cause-specific hazards and transition probabilities for each treatment arm were presented.
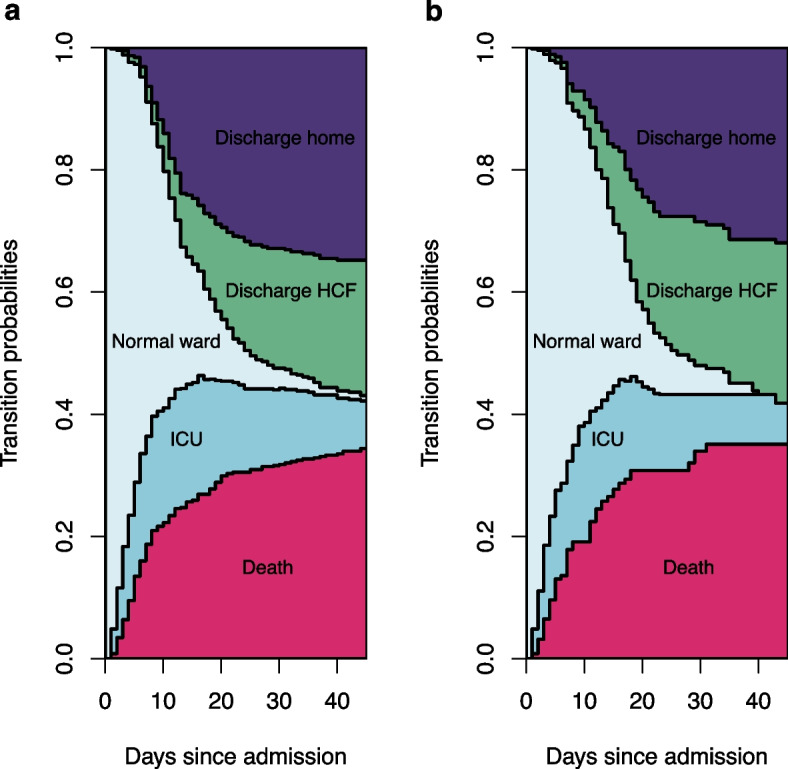
Results: Our study demonstrates that trial emulation with a multi-state model analysis is a suitable approach to address observational data limitations, evaluate treatment effects on clinically heterogeneous in-hospital death and discharge alive endpoints, and consider the intermediate state of admission to ICU. The multi-state model analysis allows us to summarize results using stacked probability plots that make it easier to interpret results.
Conclusions: Extending the emulated target trial approach to multi-state model analysis complements treatment effectiveness analysis by gaining information on competing events. Combining two methodologies offers an option to address immortal time bias, confounding bias, and competing risk events. This methodological approach can provide additional insight for decision-making, particularly when data from randomized controlled trials (RCTs) are unavailable.
Keywords: Bias; COVID-19; Multi-state models; Observational data; Target trial emulation.
© 2023. BioMed Central Ltd., part of Springer Nature.
Conflict of interest statement
The authors declare no competing interests.
Figures
Similar articles
-
Methodological biases in observational hospital studies of COVID-19 treatment effectiveness: pitfalls and potential.Front Med (Lausanne). 2024 Mar 21;11:1362192. doi: 10.3389/fmed.2024.1362192. eCollection 2024. Front Med (Lausanne). 2024. PMID: 38576716 Free PMC article.
-
Target Trial Emulation Using Hospital-Based Observational Data: Demonstration and Application in COVID-19.Life (Basel). 2023 Mar 13;13(3):777. doi: 10.3390/life13030777. Life (Basel). 2023. PMID: 36983933 Free PMC article.
-
Folic acid supplementation and malaria susceptibility and severity among people taking antifolate antimalarial drugs in endemic areas.Cochrane Database Syst Rev. 2022 Feb 1;2(2022):CD014217. doi: 10.1002/14651858.CD014217. Cochrane Database Syst Rev. 2022. PMID: 36321557 Free PMC article.
-
Safety and Efficacy of Imatinib for Hospitalized Adults with COVID-19: A structured summary of a study protocol for a randomised controlled trial.Trials. 2020 Oct 28;21(1):897. doi: 10.1186/s13063-020-04819-9. Trials. 2020. PMID: 33115543 Free PMC article.
-
Methodological evaluation of bias in observational coronavirus disease 2019 studies on drug effectiveness.Clin Microbiol Infect. 2021 Jul;27(7):949-957. doi: 10.1016/j.cmi.2021.03.003. Epub 2021 Apr 1. Clin Microbiol Infect. 2021. PMID: 33813117 Free PMC article.
Cited by
-
Methodological biases in observational hospital studies of COVID-19 treatment effectiveness: pitfalls and potential.Front Med (Lausanne). 2024 Mar 21;11:1362192. doi: 10.3389/fmed.2024.1362192. eCollection 2024. Front Med (Lausanne). 2024. PMID: 38576716 Free PMC article.
-
Antibiotic Treatment in Patients Hospitalized for Nonsevere COVID-19.JAMA Netw Open. 2025 May 1;8(5):e2511499. doi: 10.1001/jamanetworkopen.2025.11499. JAMA Netw Open. 2025. PMID: 40388163 Free PMC article.
-
Tracing In-Hospital COVID-19 Outcomes: A Multistate Model Exploration (TRACE).Life (Basel). 2024 Sep 21;14(9):1195. doi: 10.3390/life14091195. Life (Basel). 2024. PMID: 39337977 Free PMC article.
References
-
- Rothman KJ, Greenland S, Lash TL. Modern Epidemiology. 3. Philadelphia: Lippincott Williams & Wilkins; 2008. pp. 57–58.
