

Efficiency and equity of bed utilization in China's health institutions: based on the rank-sum ratio method
- PMID: 37660026
- PMCID: PMC10474721
- DOI: 10.1186/s12939-023-01986-4
Efficiency and equity of bed utilization in China's health institutions: based on the rank-sum ratio method
Abstract
Objective: The study aimed to analyze the efficiency and equity of bed utilization in Please check if the section headings are assigned to appropriate levels.China's healthcare institutions and to compare and analyze the overall health resource utilization efficiency in recent years and some specific utilization conditions in 2021, to provide empirical experience for the allocation of health care resources in epidemic China.
Methods: To compare and analyze the overall health resource utilization efficiency of the whole country with that of the East, middle, and West in 2021, and to analyze the bed utilization efficiency of different types of healthcare institutions in China and the bed utilization efficiency of various types of specialist hospitals in the country in 2021 by using the rank-sum ratio method.
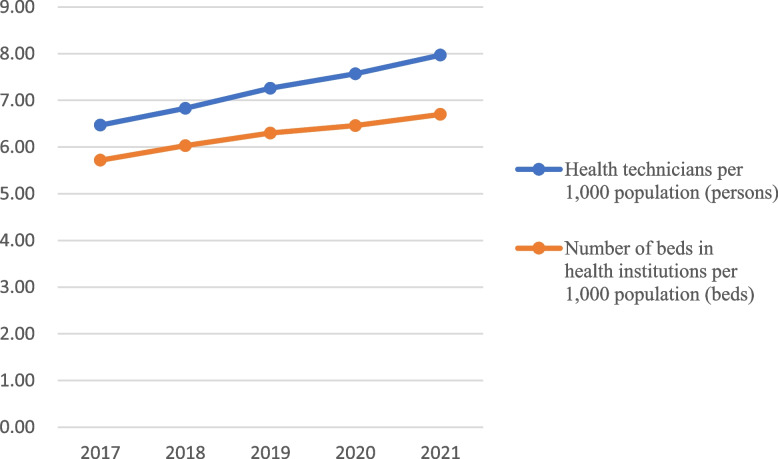
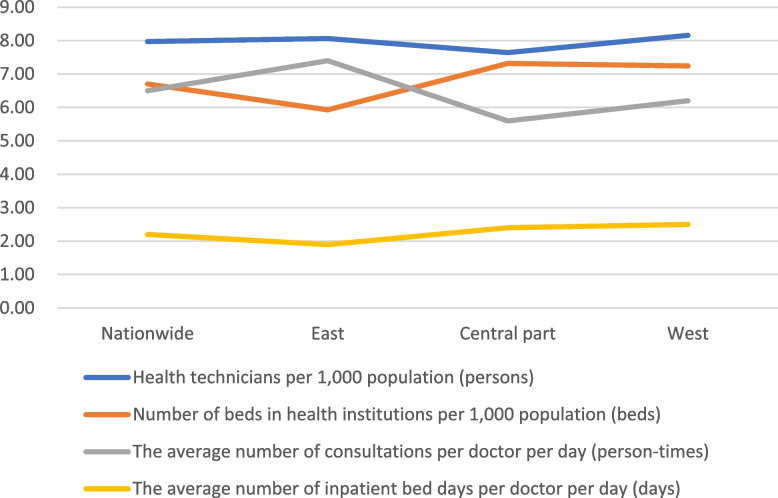
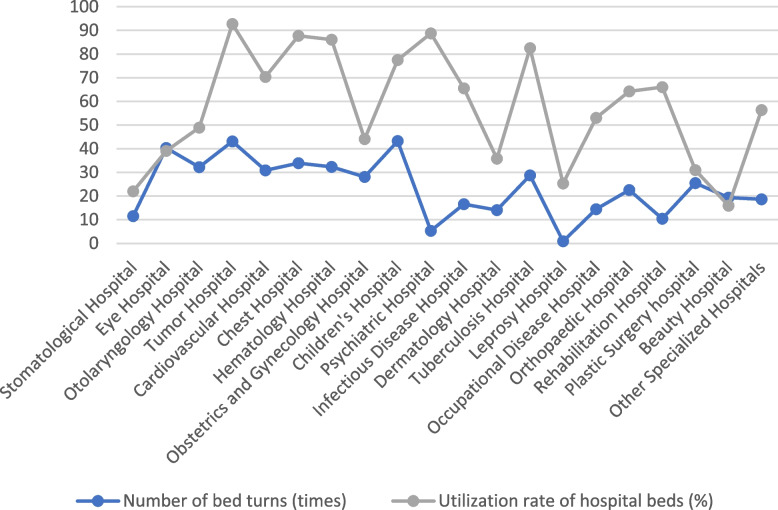
Results: In 2021, the bed utilization rate of China's health institutions was 69.82%, and the number of bed turnover times was 27.65 times; the bed utilization rate of hospitals was 74.6%, and the number of bed turnover times was 26.08 times. The number of hospital bed turnovers was highest in the western region, lowest in the central region, and close to the national average in the eastern region. The average length of stay for discharged patients was the highest in the central region, the lowest in the eastern region, and the same as the national average in the western region. The analysis of rank-sum ratio method shows that among different types of health institutions' bed utilization efficiency (r = 0.935, P = 0.000), general hospitals and traditional Chinese medicine hospitals have the best bed utilization rate, and the bed utilization rate of community health service centers (stations) needs to be improved; while among various types of specialized hospitals' bed utilization efficiency (r = 0.959, P = 0.000), oncology hospitals, thoracic hospitals, and hematology hospitals, children's hospitals have high bed utilization efficiency; leprosy hospitals, cosmetic hospitals, and stomatology hospitals have low bed utilization efficiency. Health technicians per 1,000 population are highest in the western region, lowest in the central region, and lower in the eastern region than in the western region but slightly higher than the national average. The number of beds in health institutions per 1,000 population is the highest in the central region, the lowest in the eastern region, and slightly lower in the northwest than in the central region but higher than the national average.
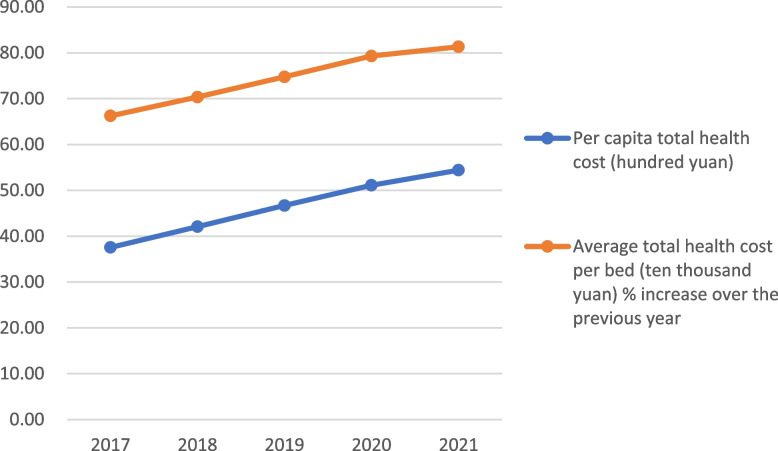
Conclusion: China's investment in health funding in the field of health care has been on the rise in recent years. However, there still exists the situation of uneven investment in health expenses and inconsistent medical efficiency among regions. And change such a status quo can be further improved in terms of government, capital, human resources, technology, information system, and so on.
Keywords: China's health institutions; Efficiency and equity of bed utilization; Rank-sum ratio method.
© 2023. BioMed Central Ltd., part of Springer Nature.
Conflict of interest statement
The authors declare no competing interests.
Figures


References
-
- China National Health and Wellness Commission. 2022 China Health and Wellness Statistics Yearbook [M]. Beijing: Peking Union Medical College Press, 2022, 23–147.
-
- Yan Y, Yan Y. Analysis of bed utilization efficiency in medical institutions in China based on the rank sum ratio method. Chinese Journal of Medical Management Sciences. 2019;9(06):10–5.
-
- Tian D, Zhou Y, Zhou D. Evaluation of medical quality in a hospital from 2012 to 2016 based on the rank sum ratio method and multiple correlation number method. Chinese Journal of Health Statistics. 2018;35(01):80–2.
-
- He S, Liu Z, Zhao D. Analysis of health resource allocation and service utilization at grass-roots medical institutions in Sichuan Province. Chinese Journal of Medical Management Sciences. 2016;6(03):10–5.
-
- Wei Y, Li Y, Li L. Equity and efficiency of health-care resource allocation in Gansu Province2012-2016. Chinese Journal of Medical Management Sciences. 2019;9(03):5–9.
Publication types
MeSH terms
LinkOut - more resources
Full Text Sources
Medical
