

Resveratrol alleviates DSS-induced IBD in mice by regulating the intestinal microbiota-macrophage-arginine metabolism axis
- PMID: 37660064
- PMCID: PMC10474707
- DOI: 10.1186/s40001-023-01257-6
Resveratrol alleviates DSS-induced IBD in mice by regulating the intestinal microbiota-macrophage-arginine metabolism axis
Abstract
Background: Inflammatory bowel disease (IBD) is a global disease with a growing public health concern and is associated with a complex interplay of factors, including the microbiota and immune system. Resveratrol, a natural anti-inflammatory and antioxidant agent, is known to relieve IBD but the mechanism involved is largely unexplored.
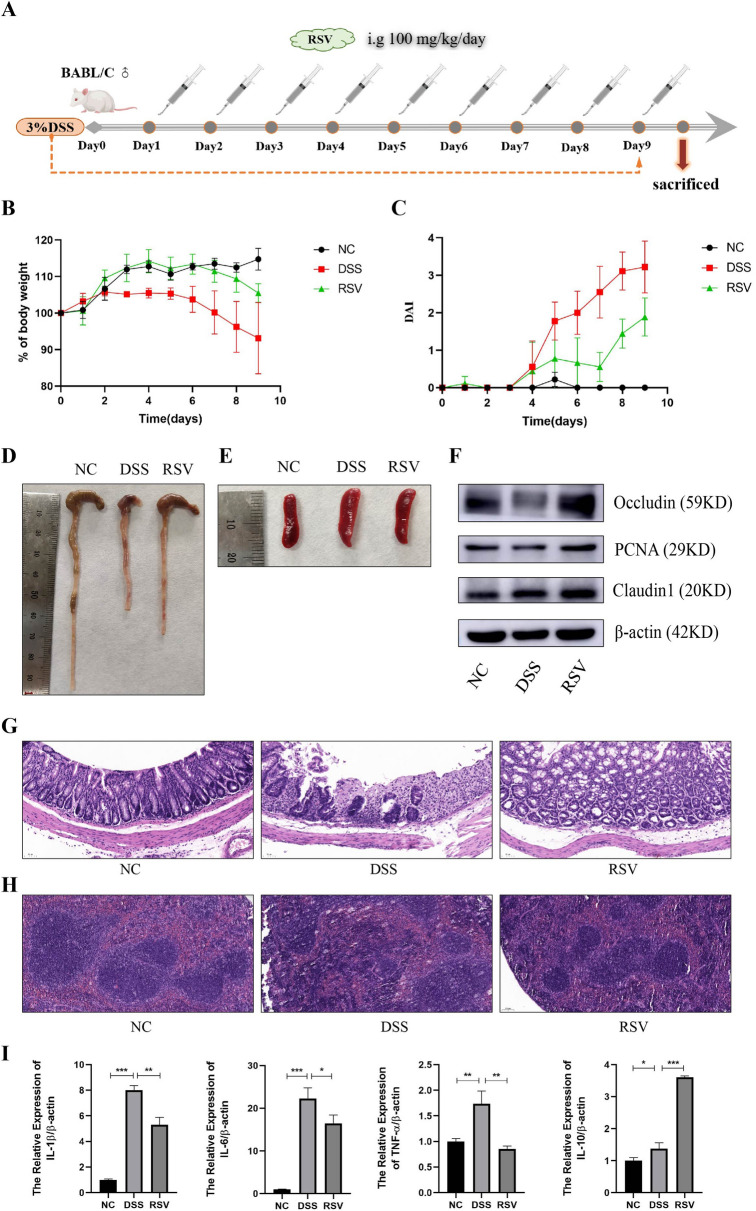
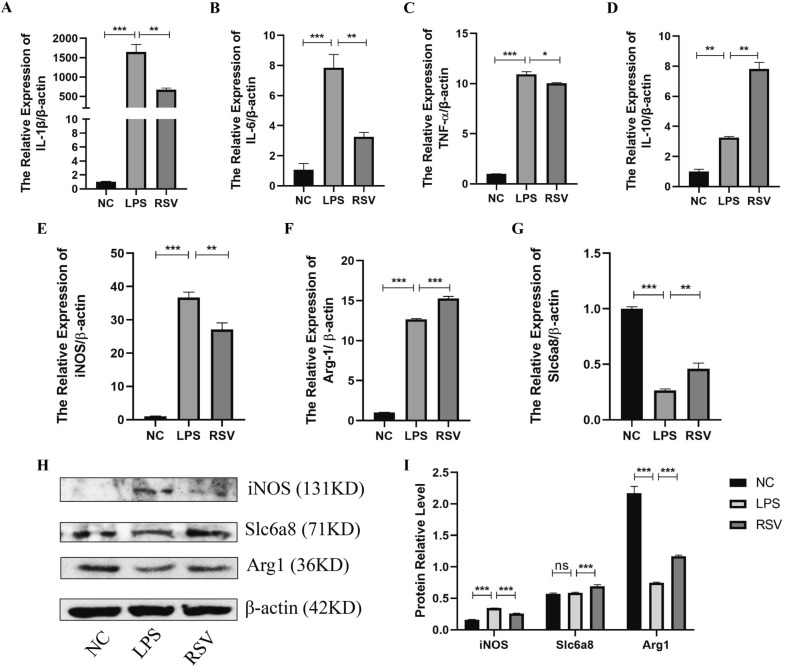
Methods: This study examines the modulatory effect of resveratrol on intestinal immunity, microbiota, metabolites, and related functions and pathways in the BALB/c mice model of IBD. Mouse RAW264.7 macrophage cell line was used to further explore the involvement of the macrophage-arginine metabolism axis. The treatment outcome was assessed through qRT-PCR, western blot, immunofluorescence, immunohistochemistry, and fecal 16S rDNA sequencing and UHPLC/Q-TOF-MS.
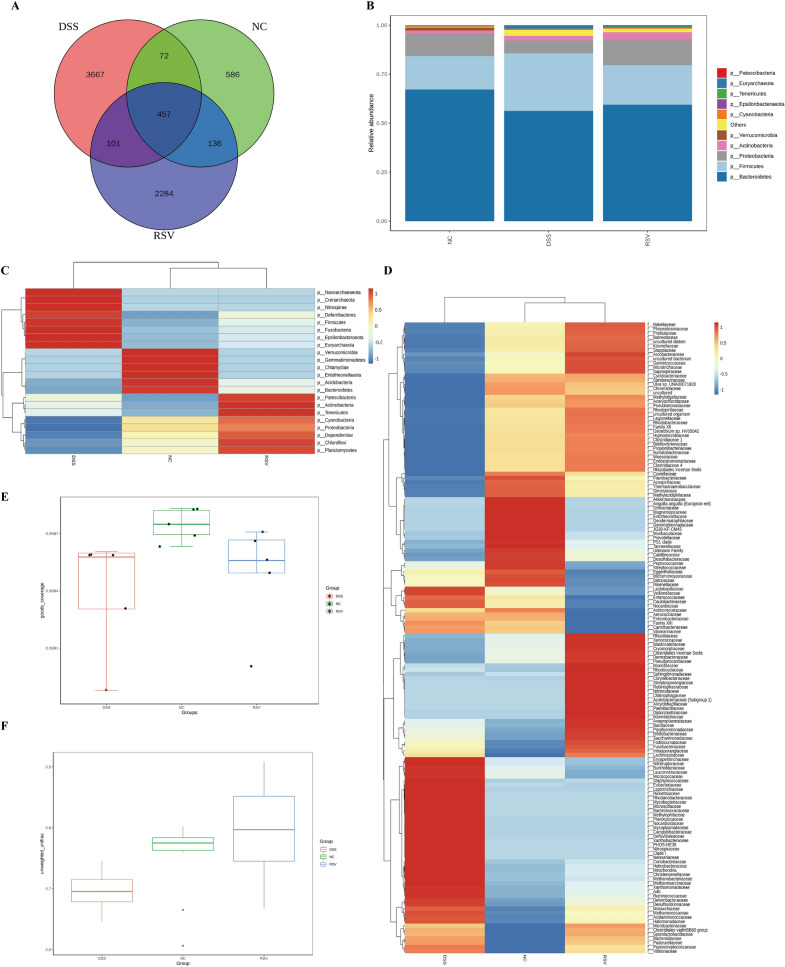
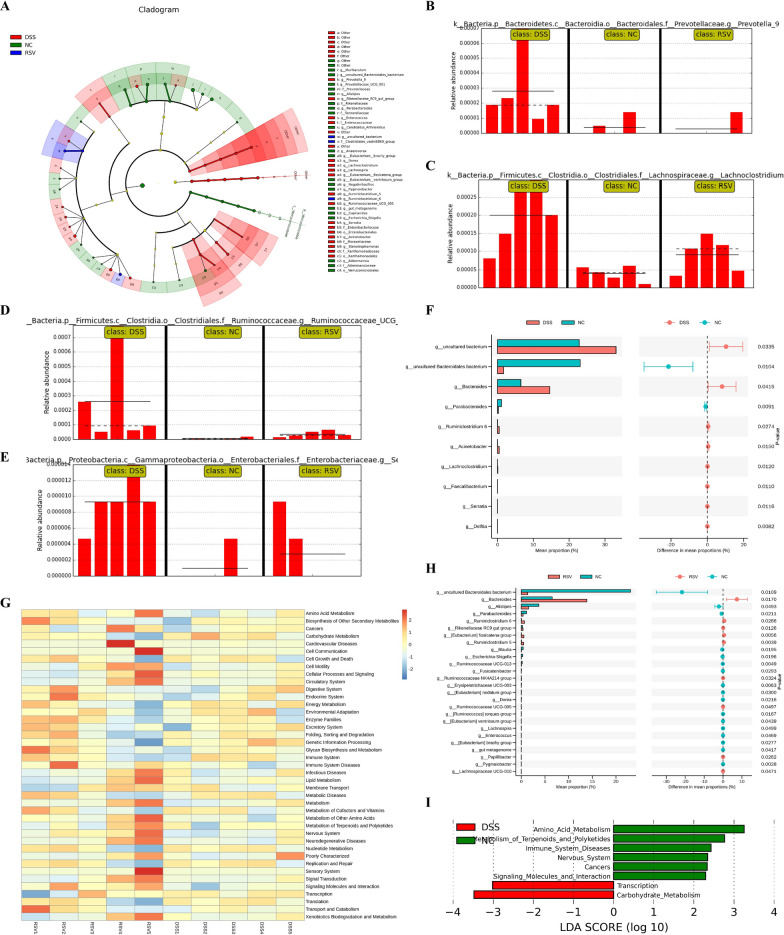
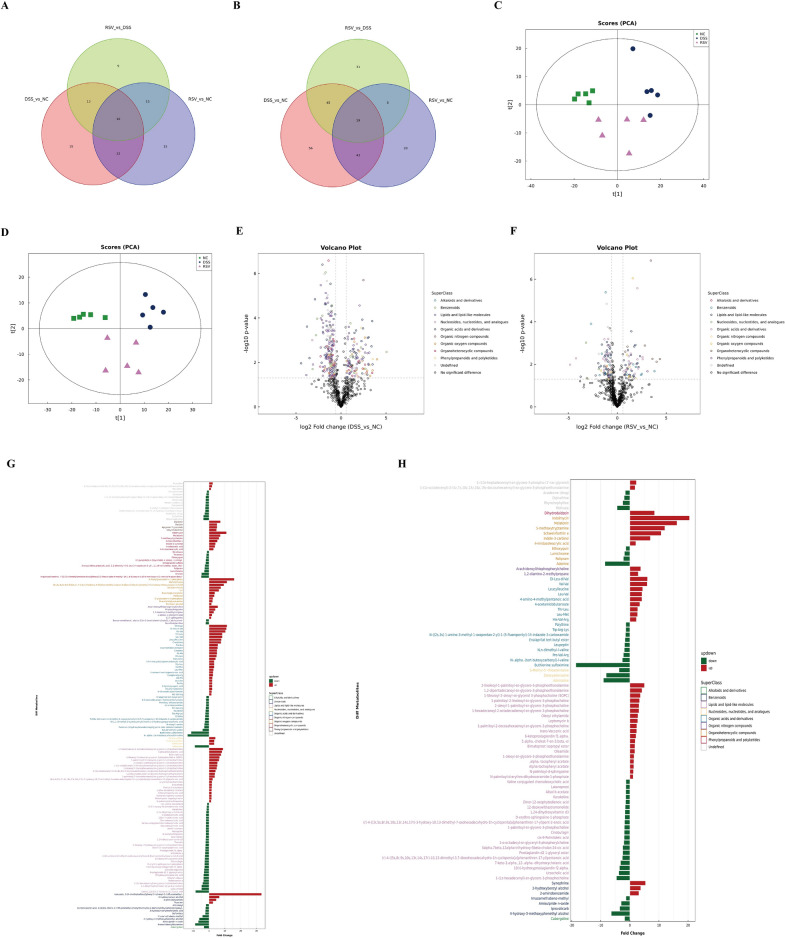
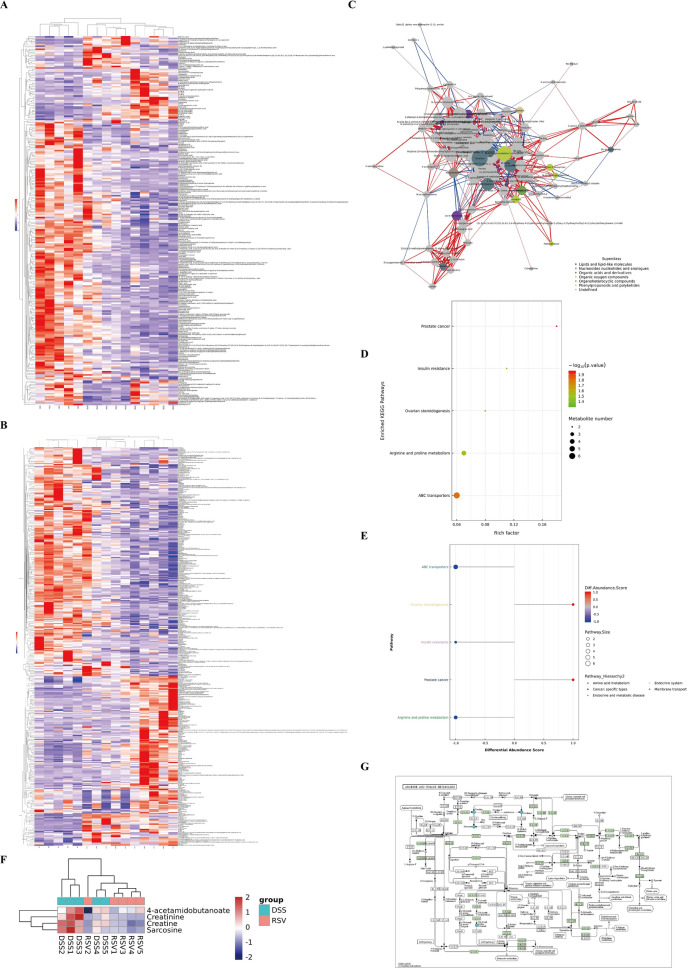
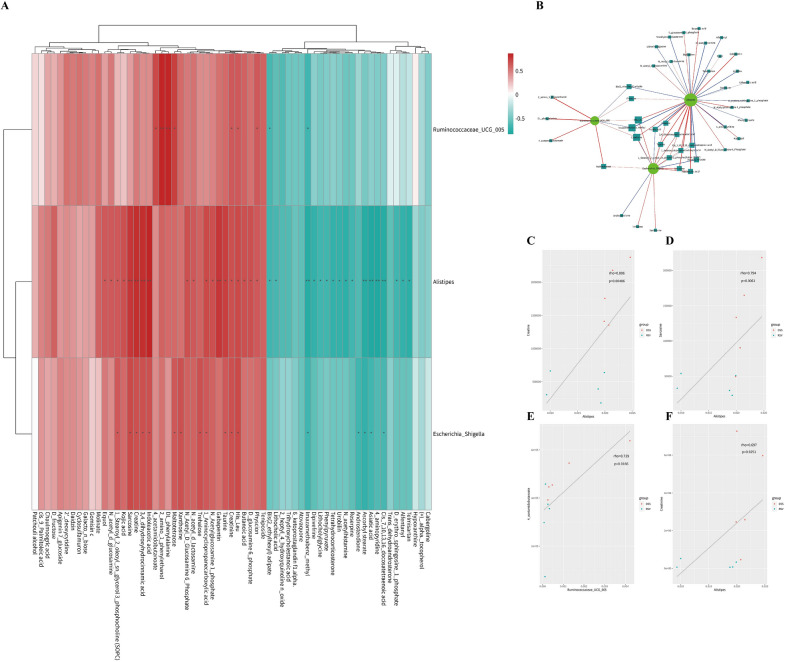
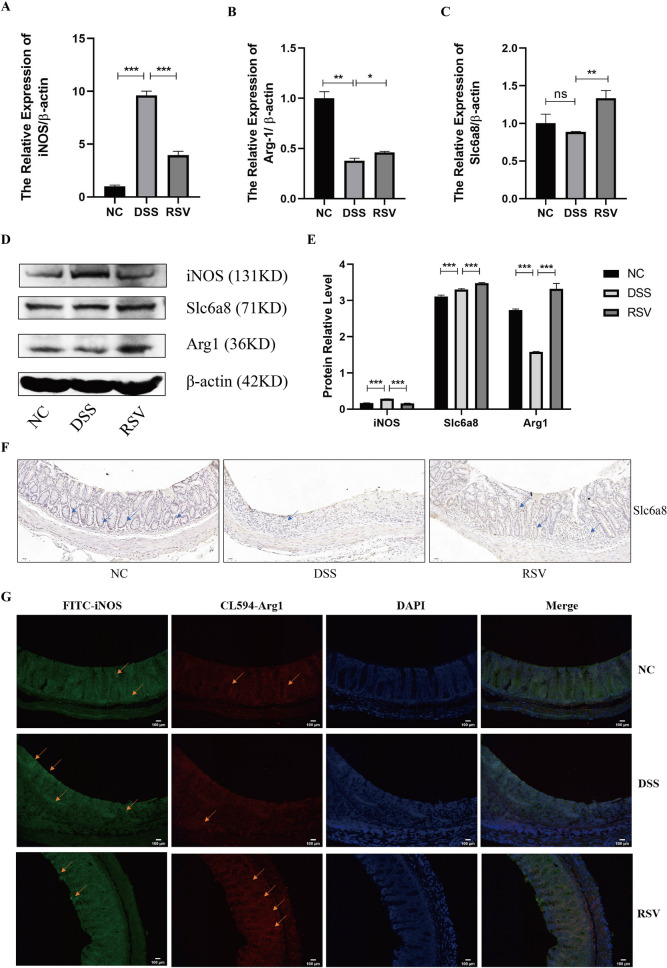
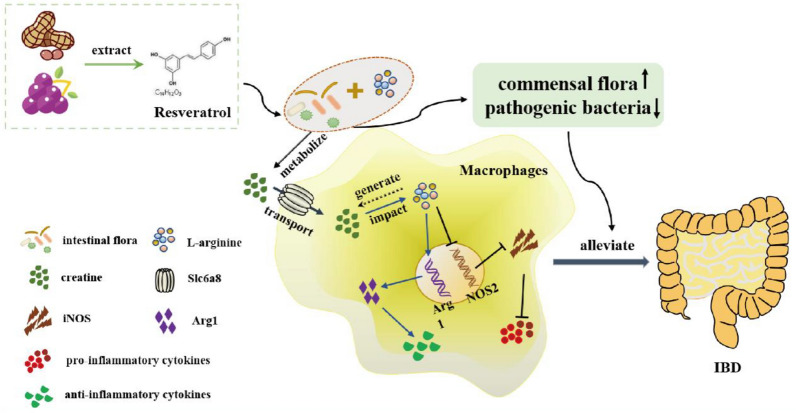
Results: Results showed that resveratrol treatment significantly reduced disease activity index (DAI), retained mice weight, repaired colon and spleen tissues, upregulated IL-10 and the tight junction proteins Occludin and Claudin 1, and decreased pro-inflammatory cytokines IL-1β, IL-6, and TNF-α. Resveratrol reduced the number of dysregulated metabolites and improved the gut microbial community structure and diversity, including reversing changes in the phyla Bacteroidetes, Proteobacteria, and Firmicutes, increasing 'beneficial' genera, and decreasing potential pathogens such as Lachnoclostridium, Acinobacter, and Serratia. Arginine-proline metabolism was significantly different between the colitis-treated and untreated groups. In the colon mucosa and RAW264.7 macrophage, resveratrol regulated arginine metabolism towards colon protection by increasing Arg1 and Slc6a8 and decreasing iNOS.
Conclusion: This uncovers a previously unknown mechanism of resveratrol treatment in IBD and provides the microbiota-macrophage-arginine metabolism axis as a potential therapeutic target for intestinal inflammation.
Keywords: Arginine metabolism; Inflammatory bowel disease; Macrophage; Microbiota; Resveratrol.
© 2023. BioMed Central Ltd., part of Springer Nature.
Conflict of interest statement
The authors declare that they have no competing interests.
Figures
Similar articles
-
Therapeutic Potential of Cajanus cajan (L.) Millsp. Leaf Extract in Modulating Gut Microbiota and Immune Response for the Treatment of Inflammatory Bowel Disease.Pharmaceuticals (Basel). 2025 Jan 9;18(1):67. doi: 10.3390/ph18010067. Pharmaceuticals (Basel). 2025. PMID: 39861130 Free PMC article.
-
2,3,5,4'-Tetrahydroxystilbene-2-O-β-D-glucoside, a major bioactive component from Polygoni multiflori Radix (Heshouwu) suppresses DSS induced acute colitis in BALb/c mice by modulating gut microbiota.Biomed Pharmacother. 2021 May;137:111420. doi: 10.1016/j.biopha.2021.111420. Epub 2021 Feb 23. Biomed Pharmacother. 2021. PMID: 33761623
-
Resveratrol Attenuates Inflammatory Bowel Disease in Mice by Regulating SUMO1.Biol Pharm Bull. 2020;43(3):450-457. doi: 10.1248/bpb.b19-00786. Biol Pharm Bull. 2020. PMID: 32115503
-
Development, validation and implementation of an in vitro model for the study of metabolic and immune function in normal and inflamed human colonic epithelium.Dan Med J. 2015 Jan;62(1):B4973. Dan Med J. 2015. PMID: 25557335 Review.
-
Dietary Supplementation with Vitamin D, Fish Oil or Resveratrol Modulates the Gut Microbiome in Inflammatory Bowel Disease.Int J Mol Sci. 2021 Dec 24;23(1):206. doi: 10.3390/ijms23010206. Int J Mol Sci. 2021. PMID: 35008631 Free PMC article. Review.
Cited by
-
Prophylactic oral application of resveratrol to alleviate acute campylobacteriosis in human gut microbiota associated IL-10-/- mice.Eur J Microbiol Immunol (Bp). 2023 Dec 15;13(4):135-149. doi: 10.1556/1886.2023.00042. Print 2023 Dec 21. Eur J Microbiol Immunol (Bp). 2023. PMID: 38099943 Free PMC article.
-
Evaluating the anti-inflammatory and antioxidant efficacy of complementary and alternative medicines (CAM) used for management of inflammatory bowel disease: a comprehensive review.Redox Rep. 2025 Dec;30(1):2471737. doi: 10.1080/13510002.2025.2471737. Epub 2025 Mar 8. Redox Rep. 2025. PMID: 40056427 Free PMC article. Review.
-
Identification of core gene-gut microbiome associations in diverticulitis patients through a two-sample mendelian randomization and bioinformatics-based investigation.Glob Med Genet. 2025 Jun 13;12(3):100065. doi: 10.1016/j.gmg.2025.100065. eCollection 2025 Sep. Glob Med Genet. 2025. PMID: 40600111 Free PMC article.
-
Mitigating microplastic-induced organ Damage: Mechanistic insights from the microplastic-macrophage axes.Redox Biol. 2025 Jul;84:103688. doi: 10.1016/j.redox.2025.103688. Epub 2025 May 19. Redox Biol. 2025. PMID: 40412021 Free PMC article. Review.
-
Therapeutic Potential of Cajanus cajan (L.) Millsp. Leaf Extract in Modulating Gut Microbiota and Immune Response for the Treatment of Inflammatory Bowel Disease.Pharmaceuticals (Basel). 2025 Jan 9;18(1):67. doi: 10.3390/ph18010067. Pharmaceuticals (Basel). 2025. PMID: 39861130 Free PMC article.
References
MeSH terms
Substances
LinkOut - more resources
Full Text Sources
Research Materials
Miscellaneous
