. 2023 Sep 2;14(1):5346.
doi: 10.1038/s41467-023-40852-3.

Low-dose carboplatin modifies the tumor microenvironment to augment CAR T cell efficacy in human prostate cancer models

Affiliations

Low-dose carboplatin modifies the tumor microenvironment to augment CAR T cell efficacy in human prostate cancer models

L H Porter et al. Nat Commun. .

Abstract

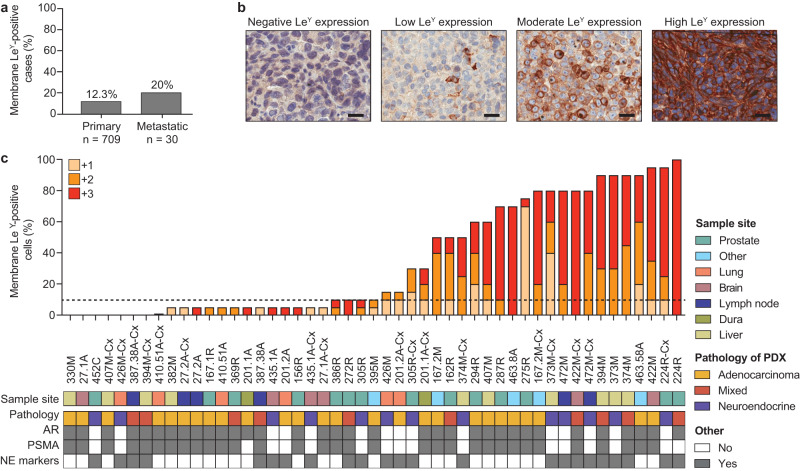
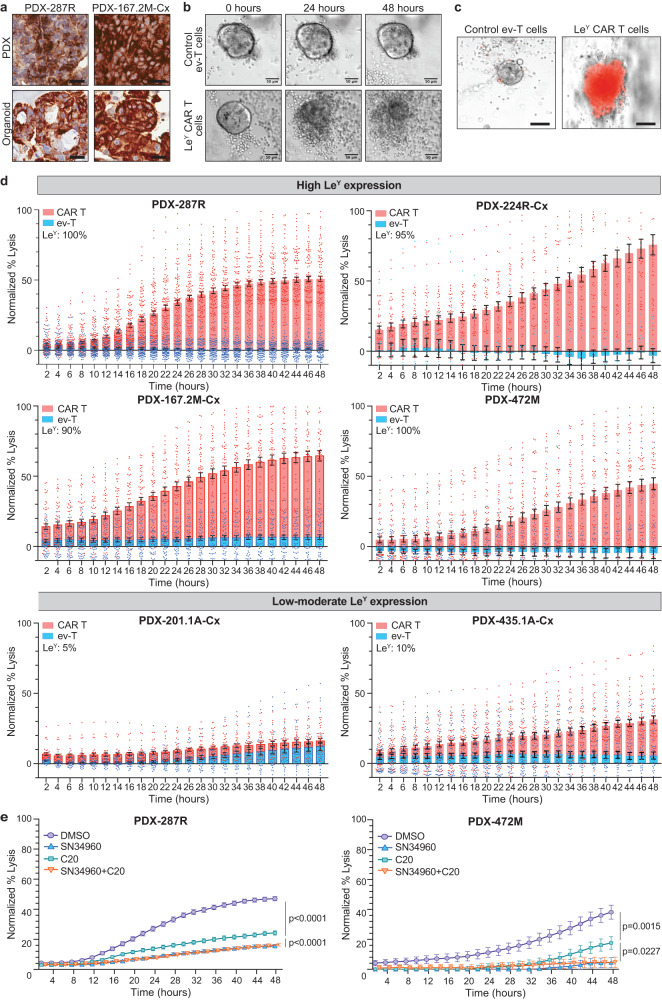
Chimeric antigen receptor (CAR) T cells have transformed the treatment landscape for hematological malignancies. However, CAR T cells are less efficient against solid tumors, largely due to poor infiltration resulting from the immunosuppressive nature of the tumor microenvironment (TME). Here, we assessed the efficacy of Lewis Y antigen (LeY)-specific CAR T cells in patient-derived xenograft (PDX) models of prostate cancer. In vitro, LeY CAR T cells directly killed organoids derived from androgen receptor (AR)-positive or AR-null PDXs. In vivo, although LeY CAR T cells alone did not reduce tumor growth, a single prior dose of carboplatin reduced tumor burden. Carboplatin had a pro-inflammatory effect on the TME that facilitated early and durable CAR T cell infiltration, including an altered cancer-associated fibroblast phenotype, enhanced extracellular matrix degradation and re-oriented M1 macrophage differentiation. In a PDX less sensitive to carboplatin, CAR T cell infiltration was dampened; however, a reduction in tumor burden was still observed with increased T cell activation. These findings indicate that carboplatin improves the efficacy of CAR T cell treatment, with the extent of the response dependent on changes induced within the TME.


Conflict of interest statement

G.P.R. and R.A.T. (Research collaborations: Pfizer, Astellas, Zenith Epigenetics, AstraZeneca); P.K.D. (Research funding from Myeloid Therapeutics, Prescient Therapeutics, and Bristol Myers Squibb); A.A. (Speakers Bureau: Astellas, Janssen, Novartis, Amgen, Ipsen, Bristol Myers Squibb; Merck Serono, Bayer; Honoraria: Astellas, Novartis, Sanofi, AstraZeneca, Tolmar, Telix, Merck Serono, Janssen, Bristol Myers Squibb, Ipsen, Bayer, Pfizer, Amgen, Noxopharm, Merck Sharpe Dome; Scientific Advisory Board: Astellas, Novartis, Sanofi, AstraZeneca, Tolmar, Pfizer, Telix, Merck Serono, Janssen, Bristol Myers Squibb, Ipsen, Bayer, Merck Sharpe Dome, Amgen, Noxopharm; Travel + Accommodation: Astellas, Merck Serono, Amgen, Novartis, Janssen, Tolmar, Pfizer; Investigator Research Funding: Astellas, Merck Serono, AstraZeneca; Institutional Research Funding: Bristol Myers Squibb, AstraZeneca, Aptevo Therapeutics, Glaxo Smith Kline, Pfizer, MedImmune, Astellas, SYNthorx, Bionomics, Sanofi Aventis, Novartis, Ipsen); M.S.H. (personal fees for lectures or advisory boards: Jannsen, Mundipharma, Astellas, Merck/MSD, Astra Zeneca, Point Biopharma; Research support paid to institution: Endocyte and Advanced Accelerator Applications, both Novartis companies); I.V. (Honoraria: Astellas, Abbvie, Tolmar, Janssen; Scientific Advisory Board: Astellas, AstraZeneca, Janssen, Bayer); P.J.N. (Research funding from BMS, Roche Genentech, MSD, Prescient Therapeutics, CRISPR Therapeutics, Allergan, Compugen); All other authors declare no competing interests.

Figures

Fig. 1
Fig. 1. Expression of LeY in human prostate cancer.
a The percentage of primary tumors (n = 709) or metastatic tumors (n = 30) positive for membrane LeY expression. Tumors were considered positive with 10% membrane LeY-positive cells. b Representative images of immunohistochemical staining of LeY in PDXs showing negative (0%), low (<10%), moderate (10–50%), and high (>50%) membrane LeY expression (scale bars = 25 µm). c The percentage of cells positive for low intensity (+1; yellow), moderate intensity (+2; orange), and high intensity (+3; red) membrane LeY expression in PDXs from the MURAL cohort. Staining was repeated on three generations of PDX tissue, and results from the latest generation are shown. NE neuroendocrine. Source data are provided as a Source Data file.
Fig. 2
Fig. 2. On-target killing of prostate cancer organoids by LeY CAR T cells.
a Representative immunohistochemical staining (n = 3 samples per PDX/organoid) of LeY in PDXs or organoids from PDXs (scale bars = 25 µm). b Representative images of LeY-positive organoids killed by infiltrating LeY CAR T cells compared to empty vector T (ev-T) cells (scale bars = 50 µm). c Propidium iodide (PI; red) uptake by organoids after 24-h culture with LeY CAR T cells, but not ev-T cells (scale bars = 50 µm). b, c Representative images of data presented in d. d PI staining of organoids with high or low-moderate LeY expression co-cultured with LeY CAR T cells (red) and ev-T cells (blue) for 48 h. Organoids were established from PDX-287R (n = 100 and 90 organoids co-cultured with CAR T and ev-T cells, respectively), PDX-224R-Cx (n = 42 and 15 organoids for CAR T and ev-T cells, respectively), PDX-167.2M-Cx (n = 50 organoids for CAR T or ev-T cells, respectively), PDX-472M (n = 53 and 46 organoids for CAR T and ev-T cells, respectively), PDX-435.1A-Cx (n = 50 organoids for CAR T or ev-T cells) and PDX-201.A-Cx (n = 33 and 31 organoids for CAR T and ev-T cells, respectively). Normalized percent lysis was calculated for CAR T or ev-T organoids as (MFI of organoid – minmean)/(maxmean – minmean) x 100, with MFI of Triton set as maximal lysis (max) and MFI of organoids alone as spontaneous lysis (min). The percentage membrane LeY-positive cells is shown for each organoid model. e Killing by LeY-positive CAR T cells is abrogated by granzyme and perforin inhibitors. Graphs show normalized percent lysis of organoids by CAR T cells over 48 h established from PDX-287R and treated with DMSO, perforin inhibitor (SN34960), granzyme B inhibitor (C20) and combined inhibition (n = 100 organoids per treatment), or established from PDX-472M and treated with DMSO (n = 54 organoids), SN34960 (n = 56 organoids), C20 (n = 60 organoids), and combined inhibition (n = 53 organoids). Data in d and e are shown as mean ± SEM. Significance was determined by two-tailed unpaired t test. Source data are provided as a Source Data file.
Fig. 3
Fig. 3. Low-dose chemotherapy enhances anti-tumor efficacy of LeY CAR T cells in vivo.
a Tumor volume (mean ± SEM) of PDX-287R grafts following treatment with no T cell control (n = 21 grafts), LeY CAR T cells (n = 17 grafts) or control empty vector T (ev-T; n = 17 grafts) cells alone. Data from three independent experiments. b Tumor volume (mean ± SEM) of PDX-287R grafts following treatment with no T cell control (n = 15 grafts), LeY CAR T cells (n = 12 grafts), ev-T cells (n = 12 grafts), nivolumab (200 µg/dose, 4 doses, n = 13 grafts), and nivolumab with LeY CAR T cells (n = 8 grafts). Data from two independent experiments. c Tumor volume (mean ± SEM) of PDX-287R grafts following treatment with no T cell control (n = 6 grafts), LeY CAR T cells (n = 5 grafts), ev-T cells (n = 5 grafts), docetaxel (10 mg/kg, 1 dose; n = 6 grafts) and docetaxel with LeY CAR T cells (n = 6 grafts). Data from 1 experiment. d Tumor volume (mean ± SEM) of PDX-287R grafts following treatment with no T cell control (n = 15 grafts), LeY CAR T cells (n = 12 grafts), ev-T cells (n = 12 grafts), carboplatin (50 mg/kg, 1 dose; n = 17 grafts), and carboplatin with LeY CAR T cells (n = 10 grafts). Data from two independent experiments. e Representative PDX-287R grafts after treatment with ev-T cells (n = 12 grafts), CAR T cells (n = 12 grafts), carboplatin (carbo; n = 17 grafts), and carboplatin with CAR T cells (carbo + CAR T cells; n = 10 grafts). f Quantification of pHH3 immunohistochemistry in PDX-287R grafts 5–6 weeks post-treatment with no T cell control (n = 8 grafts), carboplatin (n = 4 grafts), docetaxel (DTX; n = 5 grafts), nivolumab (n = 6 grafts), ev-T cells (n = 6 grafts), CAR T cells (n = 7 grafts), nivolumab (nivo) + CAR T cells (n = 6 grafts), carbo + CAR T cells (n = 4 grafts), and DTX + CAR T cells (n = 3 grafts). Statistical significance determined by one-way ANOVA with post-hoc Tukey’s test. g Tumor volume (mean ± SEM) of PDX-224R-Cx grafts following treatment with no T cell control (n = 12 grafts), LeY CAR T cells (n = 6 grafts), ev-T cells (n = 8 grafts), carboplatin (50 mg/kg, 1 dose; n = 14 grafts), carboplatin with LeY CAR T cells (n = 6 grafts), and carboplatin with ev-T cells (n = 9 grafts). Data from two independent experiments. Compared to PDX-287R, PDX-224R-Cx had decreased sensitivity to carboplatin treatment alone, and a reduced response to carboplatin-CAR T cell combination treatment. Significance was determined by linear mixed model analysis at end of treatment with a test of simple main effects to compare between treatment groups: a CAR T cells vs carboplatin + CAR T cells, p = 0.015; b carboplatin + ev-T cells vs carboplatin + CAR T cells, p = 0.044; c no T cells vs carboplatin + CAR T cells, p = 0.008; d carboplatin vs carboplatin + CAR T cells, p = 0.028. Source data are provided as a Source Data file.
Fig. 4
Fig. 4. Carboplatin increases CAR T cell accumulation and activation in PDX-287R.
a, b Number of CD3+ T cells per mm2, based on immunohistochemistry (a), and representative immunohistochemistry images of CD3+ T cells (b) in PDX-287R grafts 5–6 weeks post-treatment with no T cell control (n = 8 grafts), carboplatin (n = 5 grafts), docetaxel (DTX; n = 6 grafts), nivolumab (n = 7 grafts), ev-T cells (n = 8 grafts), CAR T cells (n = 7 grafts), nivolumab (nivo) + CAR T cells (n = 6 grafts), carboplatin (carbo) + CAR T cells (n = 9 grafts), and DTX + CAR T cells (n = 3 grafts). c, d Number of CD8+ effector T cells per mm2, based on immunohistochemistry (c), and representative immunohistochemistry images of CD8+ effector T cells (d) in PDX-287R grafts after 48 h post-adoptive transfer with CAR T cells (n = 3 grafts/treatment). e, f Number of F4/80+ mouse macrophages per mm2, based on immunohistochemistry (e), and representative immunohistochemistry images of F4/80+ mouse macrophages (f) in PDX-287R grafts after 48 h post-adoptive transfer of CAR T cells (n = 3 grafts/treatment). gl Quantification and activation of CAR T cells in mice bearing PDX-287R grafts (gi) and PDX-224R-Cx grafts (jl) 48 h post-adoptive transfer of CAR T cells by flow cytometry. Compared to PDX-287R, PDX-224R-Cx had decreased sensitivity to carboplatin treatment alone, and a reduced response to carboplatin-CAR T cell combination treatment. g, j Number of CD3+CAR+ T cells extracted from blood, spleen, and tumor (TILs) in mice bearing PDX-287R (g) and PDX-224R-Cx (j; n = 6 mice/treatment for blood and spleen, n = 3 grafts/treatment for tumors). h, k Geometric mean fluorescence intensity (MFI) of CD25 and CD137 on TILs activated by anti-idiotype antibody of LeY CAR in PDX-287R (h) and PDX-224R-Cx (k; n = 3 tumors/treatment). i, l Percentage of IL-2-, TNF-α-, and IFN-γ-positive TILs activated by anti-idiotype antibody of LeY CAR using intracellular staining in PDX-287R (i) and PDX-224R-Cx (l; n = 3 tumors/treatment). Statistical significance in violin plots (a, c, e) was determined by one-way ANOVA with post-hoc Tukey’s test: a all groups vs carbo + CAR T, p < 0.0001; b no T cells vs carbo + CAR T, p = 0.0014; c carboplatin vs carbo + CAR T, p = 0.0033; d ev-T cells vs carbo + CAR T, p = 0.0008; e carbo + ev-T vs carbo + CAR T, p = 0.0011; f CAR T cells vs carbo + CAR T, p = 0.0010; g no T cells vs carbo + ev-T, p = 0.0048; h no T cells vs carbo + CAR T, p = 0.0003; i carboplatin vs carbo + CAR T, p = 0.0165; j ev-T cells vs carbo + ev-T, p = 0.0403; k ev-T cells vs carbo + CAR T, p = 0.0018; l CAR T cells vs carbo + ev-T, p = 0.0240; m CAR T cells vs carbo + CAR T, p = 0.0011. Data in gl represents the mean ± SEM, and the significance was determined by two-tailed unpaired t test. ns not significant. Scale bars = 50 µm (b, d, f). Source data are provided as a Source Data file.
Fig. 5
Fig. 5. Carboplatin induces tumor cell death and immune cell infiltration in PDX-287R, but not PDX-224R-Cx.
af Flow cytometry analyses of PDX-287R and PDX-224R-Cx 1 week following treatment with carboplatin (50 mg/kg, 1 dose). Compared to PDX-287R, PDX-224R-Cx had decreased sensitivity to carboplatin treatment alone, and a reduced response to carboplatin-CAR T cell combination treatment. a Representative flow cytometry plots showing proportions of EpCAM+ epithelial tumor cells, CD45+ immune cells and EpCAM-CD45- stromal cells in PDX-287R following vehicle (n = 4 grafts) and carboplatin treatment (n = 3 grafts). b The proportion of EpCAM+ epithelial tumor cells in PDX-287R grafts following vehicle (n = 4 grafts) and carboplatin treatment (n = 3 grafts). c The proportion of hFAS+ tumor cells, normalized to vehicle control, in PDX-287R grafts (n = 3 grafts/treatment). d Representative flow cytometry plots showing proportions of EpCAM+ epithelial tumor cells, CD45+ immune cells and EpCAM-CD45- stromal cells in PDX-224R-Cx grafts following vehicle (n = 5 grafts) and carboplatin treatment (n = 5 grafts). e The proportion of EpCAM+ epithelial tumor cells in PDX-224R-Cx grafts (n = 5 grafts). f The proportion of hFAS+ tumor cells, normalized to vehicle control, in PDX-224R-Cx grafts (n = 3 grafts/treatment). g Volcano plot of genes significantly upregulated or downregulated, based on RNA seq, in tumor cells from PDX-287R 1 week following carboplatin treatment. hj Violin plots showing expression of genes involved in apoptosis (h), cGAS-STRING signaling (i), and T cell chemotaxis (j) in PDX-287R tumor cells 1 week after treatment with vehicle or carboplatin (n = 3 samples/treatment). Data in b, c, e, f represents mean ± SEM, and the significance was determined by two-tailed unpaired t test. ns not significant. Box plots in hj show the first to third quartile with median, whiskers show the minimum and maximum. Source data are provided as a Source Data file.
Fig. 6
Fig. 6. Carboplatin induces a pro-inflammatory immune response, effectively priming the TME to facilitate LeY-specific CAR T cell infiltration in PDX-287R.
a Representative images of residual PDX tumors 3 weeks post a single dose of carboplatin treatment (50 mg/kg; n = 12 grafts) or vehicle (n = 7 grafts) using immunohistochemistry for the human epithelial cell marker CK8/18 (scale bars = 50 µm). Cellular composition (%) of human epithelium and murine stroma in each treatment group, as determined by scRNAseq, is also shown. b Proportions of infiltrative cell types within carboplatin-treated (n = 5 samples) and vehicle control (n = 1 sample) stromal tissue (%). c UMAP-defined stromal cell populations. d Violin plots showing GSEA score enriched proportions of M1 and M2 macrophages within carboplatin-treated (n = 245 cells) and vehicle control tissue (n = 135 cells). GSEA statistical and empirical evaluation were used to yield a normalized enrichment score (NES; significance level of 5%), and significance was determined by Welch’s T-test. e Defined macrophage populations isolated from harvested PDX tissue post-carboplatin or control treatment, and their relative expression of M1 phenotypic markers. f Quantification and relative proportion of macrophage upregulation of Ccl5 and Cxcl10 genetic elements encoding chemoattractants within carboplatin-treated (n = 245 cells) and vehicle control tissue (n = 135 cells). g UMAP characterizing distinct populations of CAFs present in harvested tissue. h Dot plots showing normalized gene expression of ECM-associated constituents, immunosuppressive agents and chemotactic factors by cancer-associated fibroblasts (CAFs). i Violin plots showing the proportion of carboplatin-treated (n = 19 cells) or control-treated (n = 73 cells) endothelial cell markers associated with the tumor-associated high endothelial venule (TA-HEV) cellular profile responsible for regulation of lymphocyte trafficking. Significance was determined by GSEA statistical and empirical evaluation to yield a normalized enrichment score (NES; significance level of 5%). Box plots in d, f, and I show the first to third quartile with median, whiskers show the minimum and maximum. Source data are provided as a Source Data file.
Fig. 7
Fig. 7. Schematic defining the mechanistic actions of carboplatin on the tumor microenvironment of PDX grafts.
Carboplatin induced a series of alterations to the tumor microenvironment (TME) that collectively facilitate LeY CAR T cell entry and persistence in vivo. These mechanisms include tumor cell apoptosis by day 7 (D7), followed by a cascade of changes to the TME by day 21 (D21), including ECM degradation, induction of an iCAF (inflammatory carcinoma-associated fibroblast) phenotype, CAF-secretion of macrophage chemoattractants, recruitment and polarization of M1 macrophages, macrophage-secretion of chemokines and cytokines that attract T cells, and an increase in tumor-associated high endothelial venule (TA-HEV) cells that enhance trans-endothelial cell migration and facilitate T cell trafficking into the tumor. This image was created with BioRender.com.

References

    1. Gorchakov AA, Kulemzin SV, Kochneva GV, Taranin AV. Challenges and prospects of chimeric antigen receptor T-cell therapy for metastatic prostate cancer. Eur. Urol. 2020;77:299–308. - PubMed
    1. Park JH, et al. Long-term follow-up of CD19 CAR therapy in acute lymphoblastic leukemia. N. Engl. J. Med. 2018;378:449–459. - PMC - PubMed
    1. Maude SL, et al. Chimeric antigen receptor T cells for sustained remissions in leukemia. N. Engl. J. Med. 2014;371:1507–1517. - PMC - PubMed
    1. Mardiana, S., Solomon, B. J., Darcy, P. K. & Beavis, P. A. Supercharging adoptive T cell therapy to overcome solid tumor-induced immunosuppression. Sci. Transl. Med. 11, 10.1126/scitranslmed.aaw2293 (2019). - PubMed
    1. Alzubi J, et al. PSMA-directed CAR T cells combined with low-dose docetaxel treatment induce tumor regression in a prostate cancer xenograft model. Mol. Ther. Oncolytics. 2020;18:226–235. - PMC - PubMed

Publication types