. 2023 Sep 2;14(1):5359.
doi: 10.1038/s41467-023-41146-4.

Interpreting biologically informed neural networks for enhanced proteomic biomarker discovery and pathway analysis

Affiliations

Interpreting biologically informed neural networks for enhanced proteomic biomarker discovery and pathway analysis

Erik Hartman et al. Nat Commun. .

Abstract

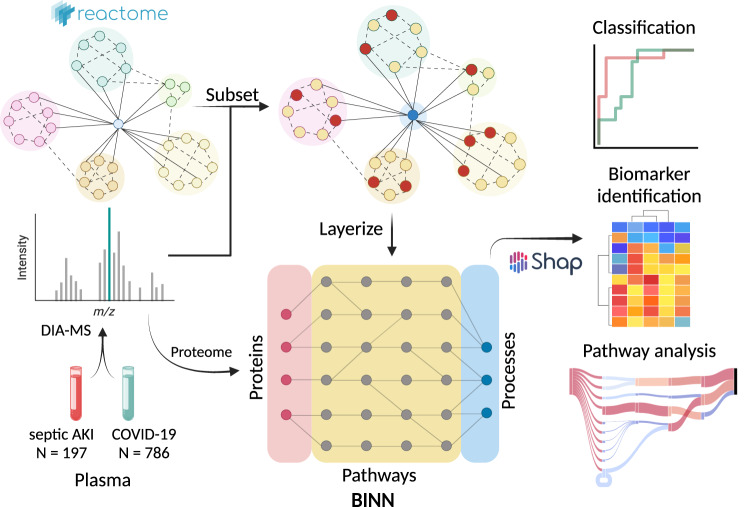
The incorporation of machine learning methods into proteomics workflows improves the identification of disease-relevant biomarkers and biological pathways. However, machine learning models, such as deep neural networks, typically suffer from lack of interpretability. Here, we present a deep learning approach to combine biological pathway analysis and biomarker identification to increase the interpretability of proteomics experiments. Our approach integrates a priori knowledge of the relationships between proteins and biological pathways and biological processes into sparse neural networks to create biologically informed neural networks. We employ these networks to differentiate between clinical subphenotypes of septic acute kidney injury and COVID-19, as well as acute respiratory distress syndrome of different aetiologies. To gain biological insight into the complex syndromes, we utilize feature attribution-methods to introspect the networks for the identification of proteins and pathways important for distinguishing between subtypes. The algorithms are implemented in a freely available open source Python-package ( https://github.com/InfectionMedicineProteomics/BINN ).


Conflict of interest statement

The authors declare no competing interests.

Figures

Fig. 1
Fig. 1. The complete workflow of analyzing proteomic data with biologically informed neural networks.
The plasma proteome from patients suffering from septic AKI and COVID-19 were gathered and analyzed elsewhere, . The data was downloaded and re-analyzed, resulting in datasets for the respective disease. The workflow starts by generating a BINN for each dataset by subsetting the pathway database, such as Reactome, using the proteomic content of the dataset of interest and layerizing it to fit a sequential neural network-like structure. The protein quantities for each sample are used to train the respective BINNs to differentiate between two subphenotypes. Thereafter, the networks are interpreted using SHAP and the resulting feature importance values allow for biomarker identification and pathway analysis. Created with BioRender.com.
Fig. 2
Fig. 2. Performance of machine learning methods on the septic AKI and COVID-datasets.
The BINNs and five other machine learning models (support vector machine with radial-basis function kernel, k-nearest neighbor, random forest, LightGBM and XGBoost) were used to predict septic AKI and COVID-19 subphenotypes given the proteomic content of the samples. The models were trained and evaluated using k-fold cross validation (k = 3). a The mean ROC-curve and 95% confidence interval for the machine learning methods on the septic AKI dataset. b The mean PR-curve and 95% confidence interval for the machine learning methods on the septic AKI dataset. c The normalized confusion matrix for the AKI-BINN. The mean ± SD confidence interval is annotated in the matrix. d Same as (a) but for the COVID dataset. e Same as (b) but for the COVID dataset. f Same as (c) but for the COVID dataset. Source data for all panels are provided as a Source Data file.
Fig. 3
Fig. 3. Sankey diagram visualization of node importance in the complete sepsis and COVID-BINNs.
The importance for each node was calculated layer-wise using SHAP and reduced by the level of connectivity, and represented as the outgoing flow from the given node. Node sizes are proportional to the sum of incoming and outgoing values, and therefore take connectivity and importance into account. Additionally, the nodes color reflects its relative importance, as darker nodes are more important in a given layer. The top 10 most important nodes in each layers are showcased and labeled, whereas the rest are gathered in the gray nodes at the bottom of the diagram (labeled “Other connections"). Nodes that had no connection to the labeled nodes i.e., both originated and targeted unlabeled nodes, were discarded for the sake of improved visualization. a The AKI-BINN. Nodes related to metabolic processes, such as lipoprotein assembly, remodeling and clearance and metabolism of vitamins and cofactors, and disease, such as infectious disease are considered important in the AKI-BINN. b The COVID-BINN. In the COVID-BINN, processes related to immunity, protein metabolism and programmed cell death are dominating. Source data for all panels are provided as a Source Data file.
Fig. 4
Fig. 4. Clustering on the proteins with the highest SHAP values in the septic AKI and COVID-datasets.
The most important proteins as determined by the BINNs were selected and subject to hierarchical clustering. a A clustermap showcasing the clustering based on the scaled protein abundances of the top 20 most important proteins in the AKI-BINN. The left-most column shows the subphenotype classification (subphenotype 2: red, subphenotype 1: blue). Clustering was performed using Wards minimum variance method and Euclidean distances. The Rand index for the clustering was 0.765. b The upper panel shows the protein quantity for the 10 most important proteins. The boxes show the quartiles of the distribution while the whiskers extend to show the rest of the distribution, except for points that are determined to be outliers using a method that is a function of the inter-quartile range. The center-line shows the mean of the dataset. n = 141 biologically independent samples. The lower panel shows in which fraction of the samples the given protein was identified. When training the predictors, proteins which were not identified in a sample were imputed with a 0. c Same as (a) but on the COVID dataset. The Rand index for the clustering was 0.663. d Same as (b) but for the COVID dataset. Here n = 687 biologically independent samples. Source data for all panels are provided as a Source Data file.
Fig. 5
Fig. 5. Custom pathway-analysis utilizing the interpreted BINNs.
The graph underlying the interpreted BINNs can be extracted and subsetted for custom pathway analysis. a The down-stream graph originating from CD14 in the AKI-BINN. The most important contribution of CD14 is to caspase activation via death receptors, MyD88 deficiency, and subsequently, disease and programmed cell death. b The up-stream graph originating from plasma lipoprotein remodeling. Its most important contributor is LDL remodeling, HDL remodeling and four apolipoproteins: APOB, APOA1, APOA4, and APOA2. c The down-stream graph originating from GELS in the COVID-BINN. GELS eventually connects to programmed cell death, sensory perception, immune system, and metabolism of proteins where programmed cell death and immune system are the most important high-level processes and sensory perception has little impact on the network. Source data for all panels are provided as a Source Data file.
Fig. 6
Fig. 6. A BINN trained and constructed from Olink-data.
To demonstrate the ability of the BINN package to generalize cross-platform, a BINN was constructed using an proteomic dataset generated using the Olink platform and the Reactome pathway database. The Olink-BINN was trained to differentiate between COVID-19-induced ARDS, bacterial sepsis-induced ARDS and healthy controls. a The resulting BINN. Since this is a three-class classification, the connections are colored based on which class the SHAP value pertains to. The flow is partitioned into the three classes, allowing us to identify which nodes are important for classifying a particular class. For example, Neutrophil degranulation is important during the classification of bacterial sepsis-induced ARDS and healthy controls, whereas Post translatuional protein phosphorylation is mostly important for COVID-19-induced ARDS. The node colors still reflect the mean importance and the nodes are ordered accordingly. b The average f1-score, precision and recall of the Olink-BINN for the different classes during validation with k-fold cross validation (k = 3). Error bars show the 95% confidence interval. c Confusion matrix averaged across folds and normalized per true label (rows sum to 100%). The mean and 95% confidence interval is annotated in the matrix. Source data for all panels are provided as a Source Data file.

References

    1. Meier F, et al. diaPASEF: parallel accumulation-serial fragmentation combined with data-independent acquisition. Nat. Methods. 2020;17:1229–1236. - PubMed
    1. Aebersold R, Mann M. Mass-spectrometric exploration of proteome structure and function. Nature. 2016;537:347–355. - PubMed
    1. Filippini DFL, et al. Latent class analysis of imaging and clinical respiratory parameters from patients with COVID-19-related ARDS identifies recruitment subphenotypes. Critical Care. 2022;26:363. - PMC - PubMed
    1. Zhang, H. et al. Data-driven identification of post-acute SARS-CoV-2 infection subphenotypes. Nat. Med.29, 226–23 (2022). - PMC - PubMed
    1. Vasquez CR, et al. Identification of distinct clinical subphenotypes in critically Ill patients with COVID-19. Chest. 2021;160:929–943. - PMC - PubMed

Publication types