. 2023 Sep 2;14(9):584.
doi: 10.1038/s41419-023-06095-2.

Ufmylation on UFBP1 alleviates non-alcoholic fatty liver disease by modulating hepatic endoplasmic reticulum stress

Affiliations

Ufmylation on UFBP1 alleviates non-alcoholic fatty liver disease by modulating hepatic endoplasmic reticulum stress

Ziming Mao et al. Cell Death Dis. .

Abstract

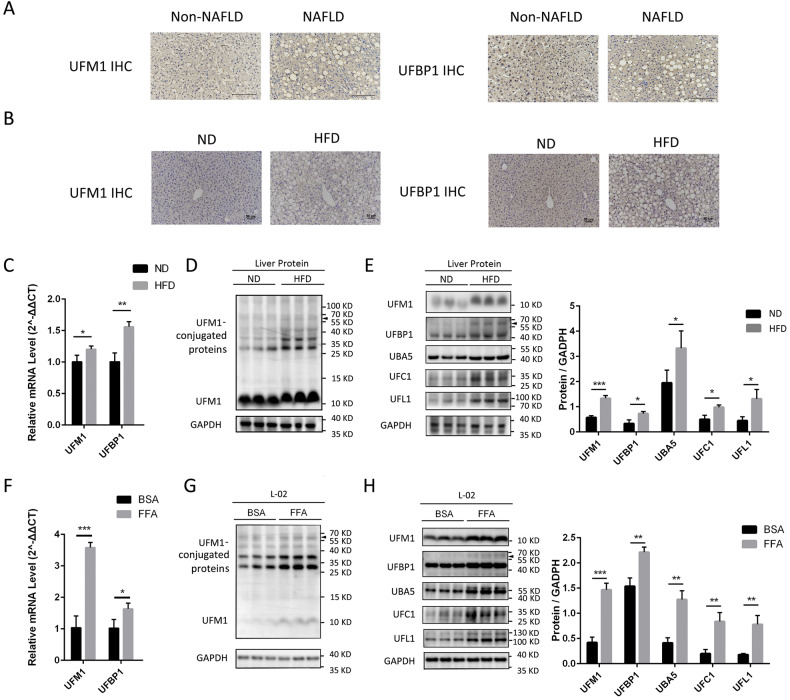
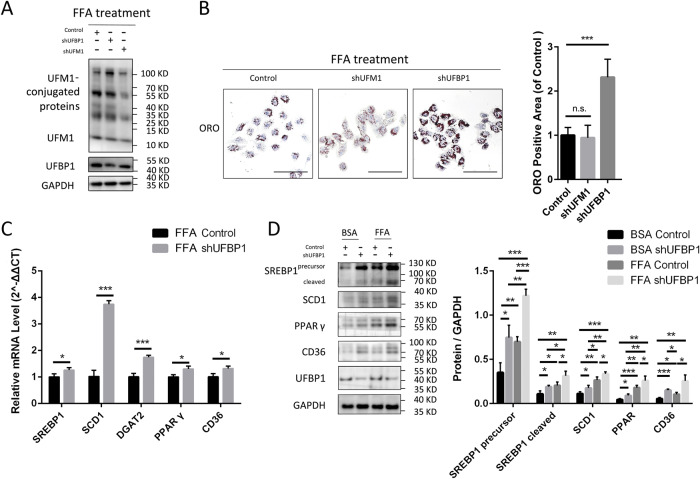
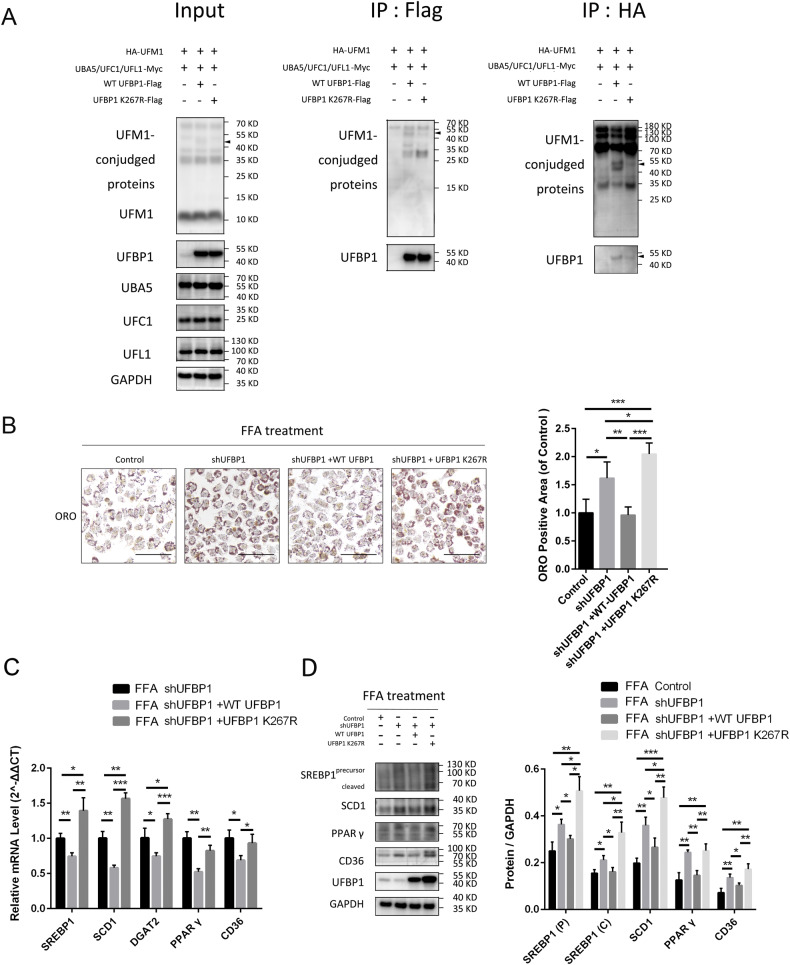
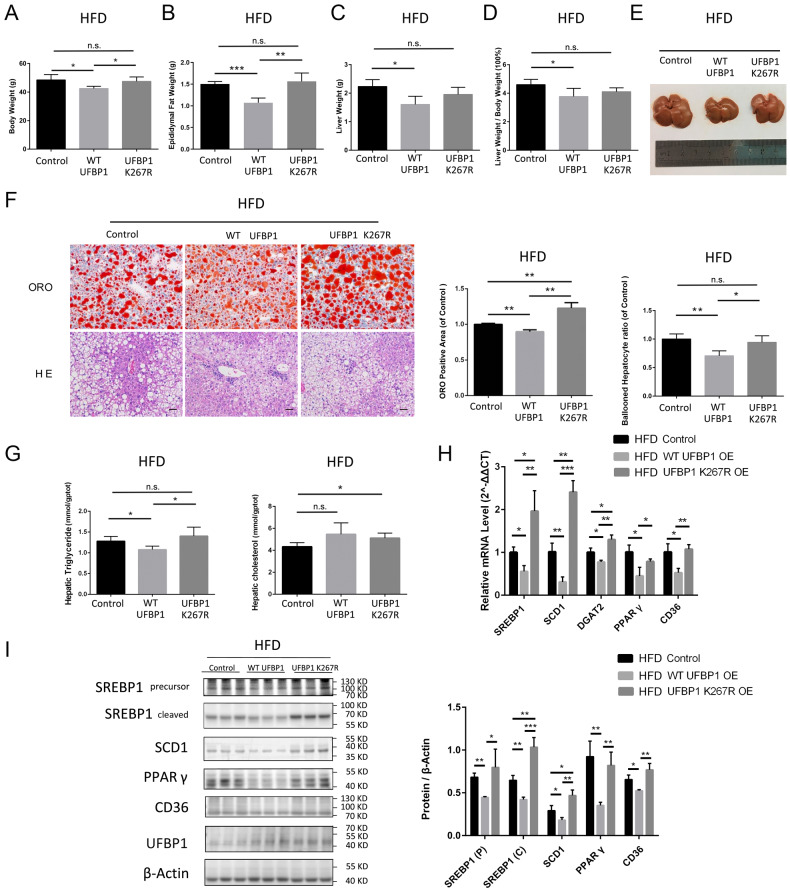
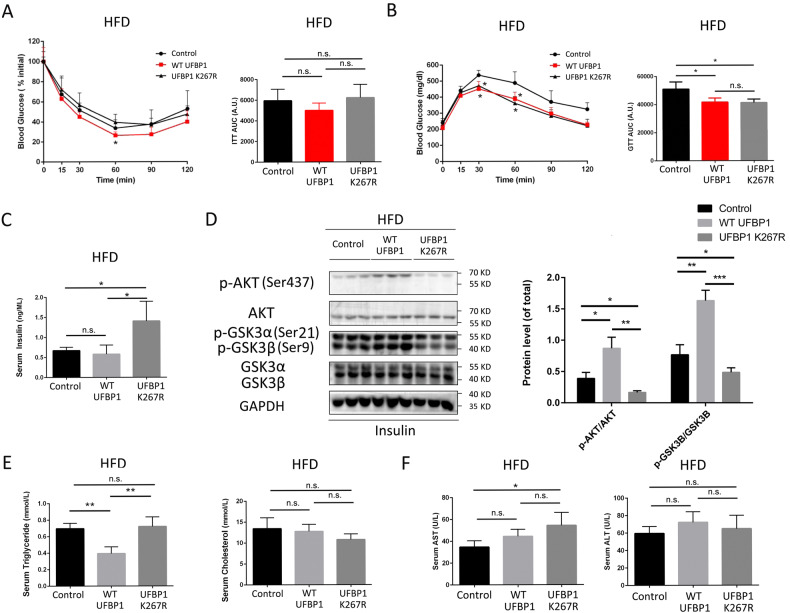
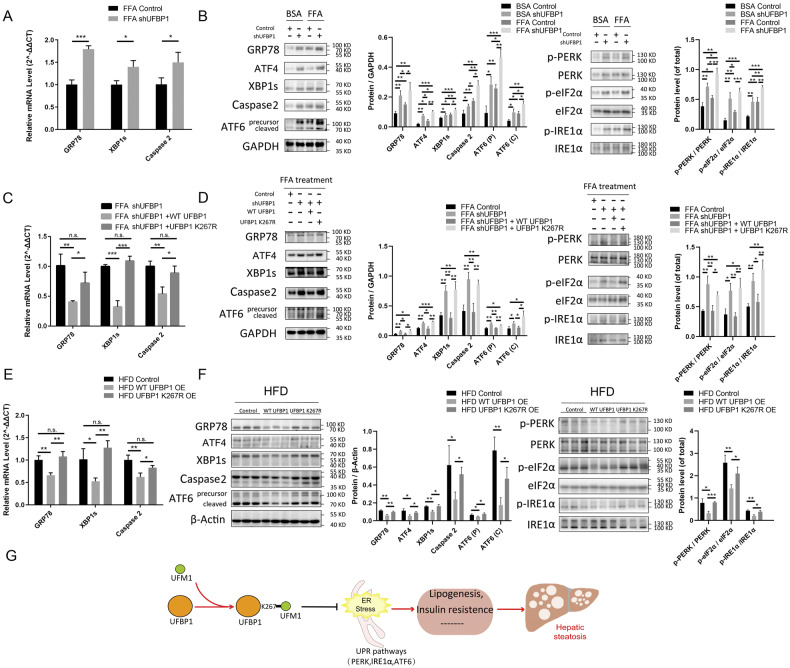
Non-alcoholic fatty liver disease (NAFLD) is the most common liver disease characterized by lipid accumulation and endoplasmic reticulum (ER) stress, while effective therapies targeting the specific characteristics of NAFLD are limited. Ufmylation is a newly found post-translational modification process that involves the attachment of the Ubiquitin-fold modifier 1 (UFM1) protein to its substrates via ufmylation modification system. Ufmylation regulates ER stress via modifying UFM1 binding protein 1 (UFBP1), suggesting a potential role for ufmylation in NAFLD pathogenesis. However, the precise role of ufmylation in NAFLD remains unclear. Herein, we aim to elucidate the impact of ufmylation on UFBP1 in NAFLD and explore the underlying mechanisms involved. We observed increased expression of UFM1-conjugated proteins and ufmylation modification system components in livers with steatosis derived from NAFLD patients and NAFLD models. Upregulation of ufmylation on hepatic proteins appeared to be an adaptive response to hepatic ER stress in NAFLD. In vitro, knocking down UFBP1 resulted in increased lipid accumulation and lipogenesis in hepatocytes treated with free fatty acids (FFA), which could be rescued by wild-type UFBP1 (WT UFBP1) but not by a mutant form of UFBP1 lacking the main ufmylation site lys267 (UFBP1 K267R). In vivo, ufmylation on UFBP1 ameliorated obesity, hepatic steatosis, hepatic lipogenesis, dyslipidemia, insulin resistance and liver damage in mice with NAFLD induced by a high fat diet (HFD). We also demonstrated that the downregulation of UFBP1 induced ER stress, whereas the reintroduction or overexpression of UFBP1 alleviated ER stress in a manner dependent on ufmylation in NAFLD. This mechanism could be responsible for the amelioration of aberrant hepatic lipogenesis and insulin resistance in NAFLD. Our data reveal a protective role of ufmylation on UFBP1 against NAFLD and offer a specific target for NAFLD treatment.


Conflict of interest statement

The authors declare no competing financial interests.

Figures

Fig. 1
Fig. 1. The expression of ufmylation modification system components and UFM1-conjugated proteins is increased in NAFLD.
A Representative immunohistochemical (IHC) staining of UFM1 and UFBP1 in the liver samples obtained from NAFLD patients or patients without NAFLD (n = 7 in each group. Scale bar, 150 μm). B Representative IHC staining of UFM1 and UFBP1 in the livers from mice treated with HFD or ND for 12 weeks (n = 3 in each group. Scale bar, 50 μm). C The mRNA levels of UFM1 and UFBP1 in the livers from mice feeding HFD or ND for 12 weeks (n = 3 in each group). D The expression of UFM1-conjugated proteins in the livers from mice feeding HFD or ND for 12 weeks (n = 3 in each group). Arrow head indicates UFM1-conjugated UFBP1. E The expression of ufmylation modification system components (including UFM1, UFBP1, UBA5, UFC1, and UFL1) in the livers from mice feeding HFD or ND for 12 weeks (n = 3 in each group). Protein expression was normalized to that of GAPDH. Arrow head indicates UFM1-conjugated UFBP1. F The mRNA levels of UFM1 and UFBP1 in L02 cell lines treated with free fatty acids (FFA, OA/PA = 200 μM/100 μM) or vehicle solution (BSA) for 24 h (n = 3 in each group). G The expression of UFM1-conjugated proteins in L02 cell lines treated with FFA or BSA for 24 h (n = 3 in each group). Arrow head indicates UFM1-conjugated UFBP1. H The expression of ufmylation modification system components (including UFM1, UFBP1, UBA5, UFC1, and UFL1) in L02 cell lines treated with FFA or BSA for 24 h (n = 3 in each group). Protein expression was normalized to that of GAPDH. Arrow head indicates UFM1-conjugated UFBP1. The data in (C, D, E, F, G, H) were presented as the means ± SDs and analyzed by two-tailed Student’s t test. *p < 0.05; **p < 0.01; ***p < 0.001.
Fig. 2
Fig. 2. UFBP1 deficiency promotes FFA-induced lipid deposit and hepatic lipogenesis in hepatocytes in vitro.
A The expression of UFM1 and UFBP1 in L02 cell lines infected with the corresponding control lentivirus-shRNA, lentivirus-shUFM1 or lentivirus-shUFBP1 (Control, shUFM1 and shUFBP1) and treated with FFA (OA/PA = 200 μM/100 μM) for 24 h. B Representative images of oil red O (ORO) staining of the indicated L02 cell lines (Control, shUFM1 and shUFBP1) treated with FFA. ORO positive areas were quantified by calculating the ratio of the ORO stained area to the total cell area using Image-Pro Plus and were normalized to those of the control group (n = 4 in each group. Scale bar, 50 μm). C The mRNA levels of hepatic lipogenic genes (including SREBP1, SCD1, DGAT2, PPARγ and CD36) in the indicated L02 cell lines (Control and shUFBP1) treated with FFA for 24 h (n = 3 in each group). D The protein levels of SREBP1 (precursor and cleaved forms), SCD1, PPARγ and CD36 in the indicated L02 cell lines treated with FFA or vehicle solution (BSA) for 24 h (n = 3 in each group). Protein expression was normalized to that of GAPDH. The data in (B, C and D) were presented as the means ± SDs and analyzed by two-tailed Student’s t test. *p < 0.05; **p < 0.01; ***p < 0.001. n.s., non-specific signals.
Fig. 3
Fig. 3. Ufmylation on UFBP1 suppresses lipid accumulation and lipogenesis in FFA-treated hepatocytes in vitro.
A Analysis of ufmylation on WT UFBP1 and UFBP1 K267R in HEK293T cells expressed the ufmylation system components in various combinations as indicated. Ufmylation of WT UFBP1 and UFBP1 K267R were analyzed by immunoprecipitation with Flag antibody and HA antibody respectively, followed by Western blot with UFBP1 antibody and UFM1 antibody respectively. Arrow head indicates UFM1-conjugated UFBP1. B Representative images of oil red (ORO) staining of the indicated L02 cell lines treated with FFA, including cell lines infected with Control lentivirus-shRNA, lentivirus-shUFBP1, and cell lines in which endogenous UFBP1 was knocked down and exogenous WT UFBP1 or UFBP1 K267R was re-expressed (Control, shUFBP1, shUFBP1+WT UFBP1, and shUFBP1 + UFBP1 K267R). All these cell lines were treated with FFA (OA/PA = 200 μM/100 μM) for 24 h. ORO positive areas were quantified by calculating the ratio of the ORO stained area to the total cell area using Image-Pro Plus and were normalized to those of the control group (n = 4 in each group. Scale bar, 50 μm). C The mRNA levels of hepatic lipogenic genes (SREBP1, SCD1, DGAT2, PPARγ, and CD36) in the indicated L02 cell lines (shUFBP1, shUFBP1+WT UFBP1 and shUFBP1 + UFBP1 K267R) treated with FFA for 24 h (n = 3 in each group). D The protein levels of SREBP1 (precursor and cleaved forms), SCD1, PPARγ and CD36 in the indicated L02 cell lines (Control, shUFBP1, shUFBP1+WT UFBP1, and shUFBP1 + UFBP1 K267R) treated with FFA for 24 h (n = 3 in each group). Protein expression was normalized to that of GAPDH. The data in (B, C and D) were presented as the means ± SDs and analyzed by two- tailed Student’s t test. *p < 0.05; **p < 0.01; ***p < 0.001.
Fig. 4
Fig. 4. Ufmylation on UFBP1 facilitates the mitigation of obesity and hepatic steatosis and suppresses hepatic lipogenesis in NAFLD mice.
A The body weight of HFD-fed mice in the indicated groups (mice injected with AAV8-GFP, AAV8-WT UFBP1 or AAV8-UFBP1 K267R) at 12 weeks post-AAV injection (n = 4 in each group). B The epididymal fat weight of HFD-fed mice in the indicated groups at 12 weeks post-AAV injection (n = 4 in each group). C The liver weight of HFD-fed mice in the indicated groups at 12 weeks post-AAV injection (n = 4 in each group). D The ratio of liver weight to body weight (LW/BW) of HFD-fed mice from the indicated groups at 12 weeks post-AAV injection (n = 4 in each group). E The liver morphology of HFD-fed mice from the indicated groups at 12 weeks post-AAV injection. F Representative images of ORO and HE staining of liver sections from HFD-fed mice in the indicated groups at 12 weeks post-AAV injection (n = 4 in each group. Scale bar, 50 μm). ORO positive areas were quantified by calculating the ratio of the ORO stained area to the total area of an image using Image-Pro Plus and were normalized to those of the control group. Hepatocyte ballooning ratios were quantified by calculating the ratio of the number of ballooned hepatocytes to the total number of hepatocytes in per high-magnification field and were normalized to those of the control group. G Hepatic triglycerides (TG) levels (Left panels) and total cholesterol (TC) (Right panels) levels of HFD-fed mice from the indicated groups at 12 weeks post-AAV injection (n = 4 in each group). H The mRNA levels of hepatic lipogenic genes (including SREBP1, SCD1, DGAT2, PPARγ and CD36) in HFD-fed mice from the indicated groups at 12 weeks post-AAV injection (n = 3 in each group). I The protein levels of SREBP1 (precursor and cleaved forms), SCD1, PPARγ and CD36 in the livers of HFD-fed mice from the indicated groups at 12 weeks post-AAV injection (n = 3 in each group). Protein expression was normalized to that of β-actin. The data in (A, B, C, D, F, G, H and I) were presented as the means ± SDs and analyzed by two- tailed Student’s t test. *p < 0.05; **p < 0.01; ***p < 0.001. n.s., non-specific signals.
Fig. 5
Fig. 5. Ufmylation on UFBP1 relieves insulin resistance, hypertriglyceridemia and liver damage in NAFLD mice.
A Insulin tolerance test (ITT; 0.75 U insulin/kg body weight) on HFD mice from the indicated groups at 11 weeks post-AAV injection. The area under the curve (AUC) of blood glucose level was calculated (n = 4 in each group). B Glucose tolerance test (GTT; 1 g glucose/kg body weight) on HFD mice from the indicated groups at 10 weeks post-AAV injection. The area under the curve (AUC) of blood glucose was calculated (n = 4 in each group). C Fasting serum insulin levels of HFD mice from the indicated groups at 12 weeks post-AAV injection (n = 4 in each group). D The phosphorylation levels of AKT and GSK3β in the livers of HFD mice from the indicated groups at 12 weeks post-AAV injection (n = 3 in each group). Mice received intraperitoneal insulin injection (0.75 U/kg) 10 min before liver tissue collection. Phosphorylation levels were normalized to the level of total proteins (n = 3 in each group). E Fasting serum triglycerides (TG) (Left panels) and fasting serum total cholesterol (TC) (Right panels) of HFD mice from the indicated groups at 12 weeks post-AAV injection (n = 4 in each group). F Serum aspartate aminotransferase (AST) (Left panels) or alanine aminotransferase (ALT) (Right panels) levels of HFD mice from the indicated groups at 12 weeks post-AAV injection (n = 4 in each group). The data in (A, B, C, D, E and F) were presented as the means ± SDs and analyzed by two- tailed Student’s t test. *p < 0.05; **p < 0.01; ***p < 0.001. A.U. arbitrary units. n.s. non-specific signals.
Fig. 6
Fig. 6. UFBP1 suppresses hepatic ER stress in an ufmylation-dependent way.
A The mRNA levels of ER stress-related genes (including GRP78, XBP1s and Caspase 2) in the indicated L02 cell lines (Control, shUFBP1) treated with FFA for 24 h (n = 3 in each group). B The protein levels of GRP78, ATF4, XBP1s, Caspase 2, and ATF6 (precursor and cleaved forms) (Left panels) and phosphorylation levels of PERK, eIF2α and IRE1α (Right panels) in the indicated L02 cell lines treated with FFA or vehicle solution (BSA) for 24 h. Protein expression was normalized to that of GAPDH and phosphorylation levels were normalized to the level of total proteins (n = 3 in each group). C The mRNA levels of ER stress-related genes (including GRP78, XBP1s and Caspase 2) in the indicated L02 cell lines (Control, shUFBP1, shUFBP1+WT UFBP1, and shUFBP1 + UFBP1 K267R) treated with FFA for 24 h (n = 3 in each group). D The protein levels of GRP78, ATF4, XBP1s, Caspase 2, and ATF6 (precursor and cleaved forms) (Left panels) and phosphorylation levels of PERK, eIF2α and IRE1α (Right panels) in the indicated L02 cell lines treated with FFA for 24 h. Protein expression was normalized to that of GAPDH and phosphorylation levels were normalized to the level of total proteins (n = 3 in each group). E The mRNA levels of ER stress-related genes (including GRP78, XBP1s and Caspase 2) in the livers of HFD mice from the indicated groups at 12 weeks post-AAV injection (n = 3 in each group). F The protein levels of GRP78, ATF4, XBP1s, Caspase 2 and ATF6 (precursor and cleaved forms) (Left panels) and phosphorylation levels of PERK, eIF2α and IRE1α (Right panels) in the livers of HFD mice from the indicated groups at 12 weeks post-AAV injection (n = 3 in each group). Protein expression was normalized to that of β-actin and phosphorylation levels were normalized to the level of total proteins. G A schematic model depicting that ufmylation on UFBP1 K267 mitigates ER stress and the progression of hepatic steatosis. The data in (A, B, C, D, E, F) were presented as the means ± SDs and analyzed by two- tailed Student’s t test. *p < 0.05; **p < 0.01; ***p < 0.001. n.s., non-specific signals.

Similar articles

Cited by

References

    1. Friedman SL, Neuschwander-Tetri BA, Rinella M, Sanyal AJ. Mechanisms of NAFLD development and therapeutic strategies. Nat Med. 2018;24:908–22. doi: 10.1038/s41591-018-0104-9. - DOI - PMC - PubMed
    1. Gao X, Fan JG. Diagnosis and management of non-alcoholic fatty liver disease and related metabolic disorders: consensus statement from the Study Group of Liver and Metabolism, Chinese Society of Endocrinology. J Diabetes. 2013;5:406–15. doi: 10.1111/1753-0407.12056. - DOI - PMC - PubMed
    1. Lin H, Zhang X, Li G, Wong GL, Wong VW. Epidemiology and clinical outcomes of metabolic (Dysfunction)-associated fatty liver disease. J Clin Transl Hepatol. 2021;9:972–82. - PMC - PubMed
    1. Lambert JE, Ramos-Roman MA, Browning JD, Parks EJ. Increased de novo lipogenesis is a distinct characteristic of individuals with nonalcoholic fatty liver disease. Gastroenterology. 2014;146:726–35. doi: 10.1053/j.gastro.2013.11.049. - DOI - PMC - PubMed
    1. Lebeaupin C, Vallée D, Hazari Y, Hetz C, Chevet E, Bailly-Maitre B. Endoplasmic reticulum stress signalling and the pathogenesis of non-alcoholic fatty liver disease. J Hepatol. 2018;69:927–47. doi: 10.1016/j.jhep.2018.06.008. - DOI - PubMed

Publication types

Substances